. 2023 Sep;26(9):1595-1602.
doi: 10.1038/s41593-023-01414-4. Epub 2023 Aug 24.

High-precision mapping reveals the structure of odor coding in the human brain

Affiliations

High-precision mapping reveals the structure of odor coding in the human brain

Vivek Sagar et al. Nat Neurosci. 2023 Sep.

Abstract

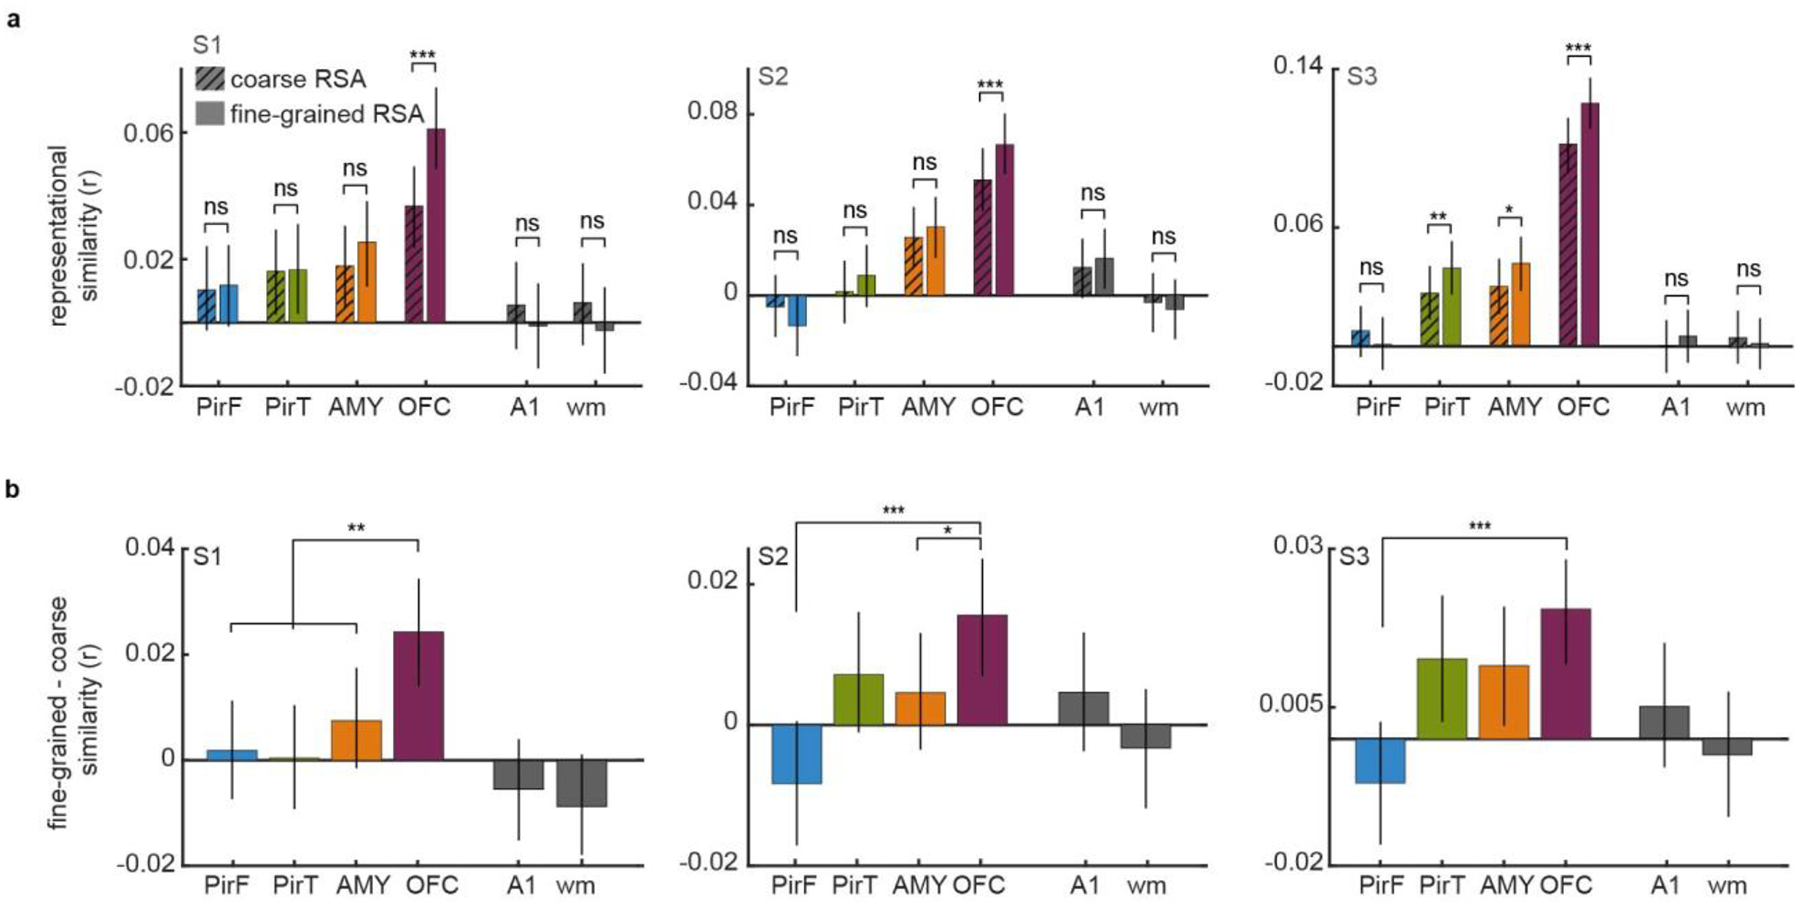
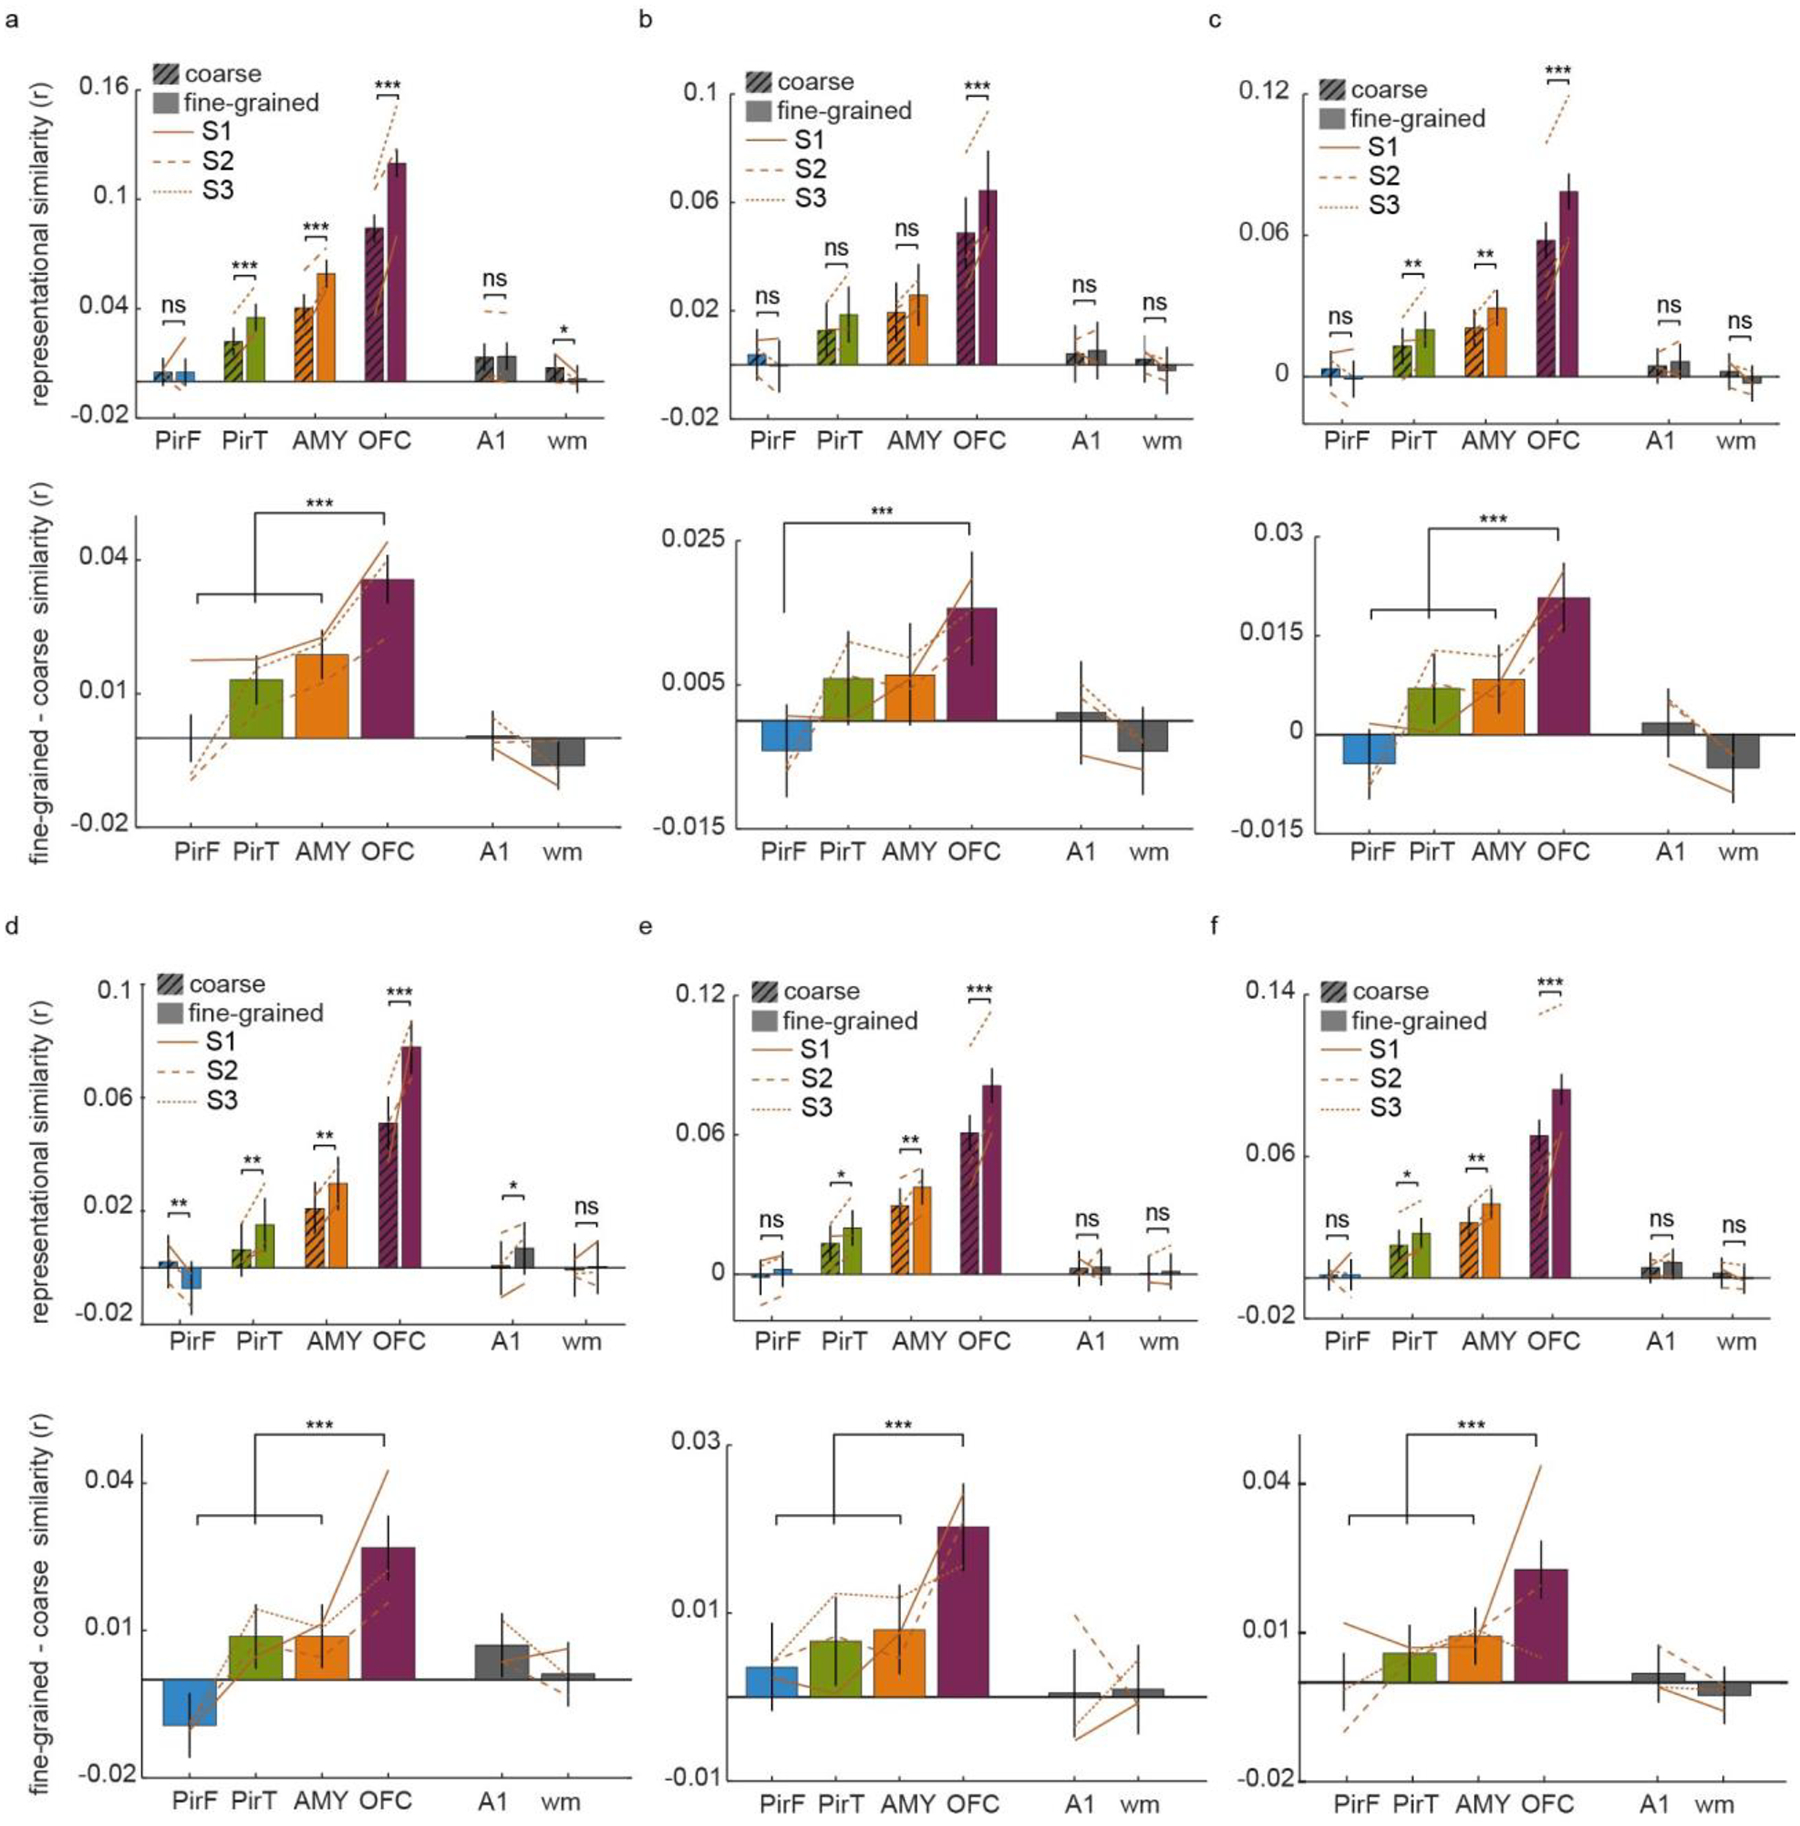
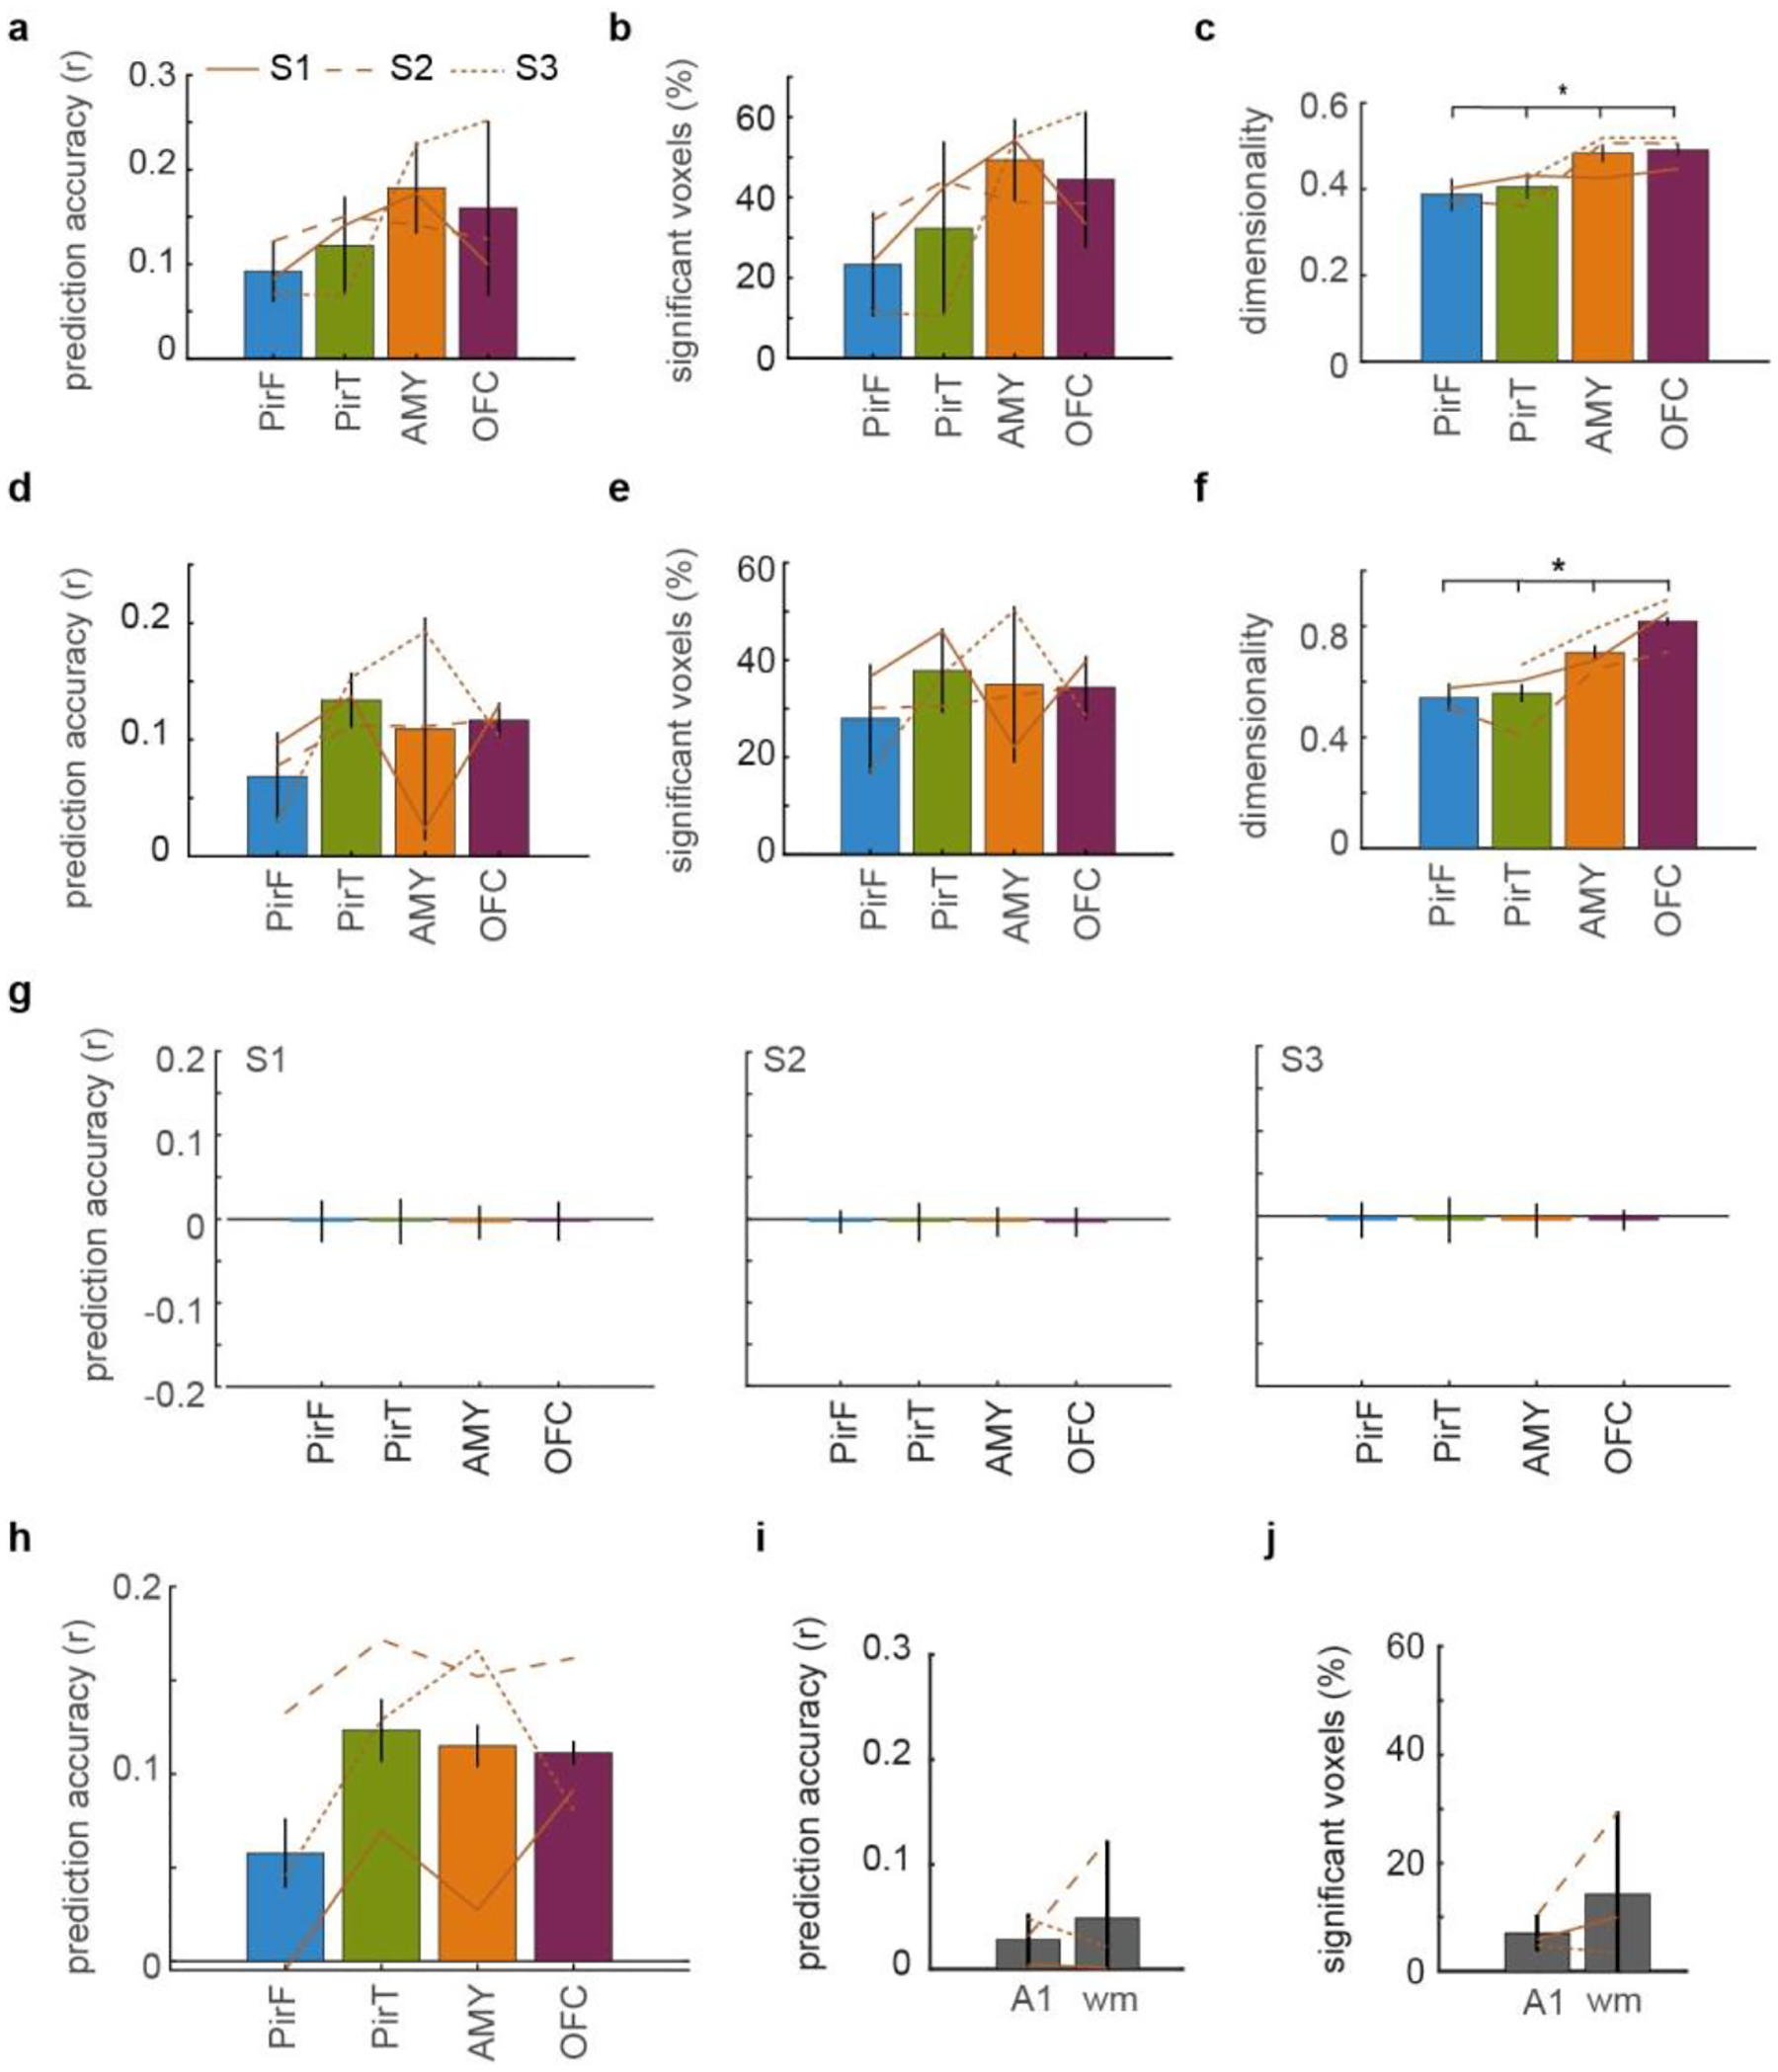
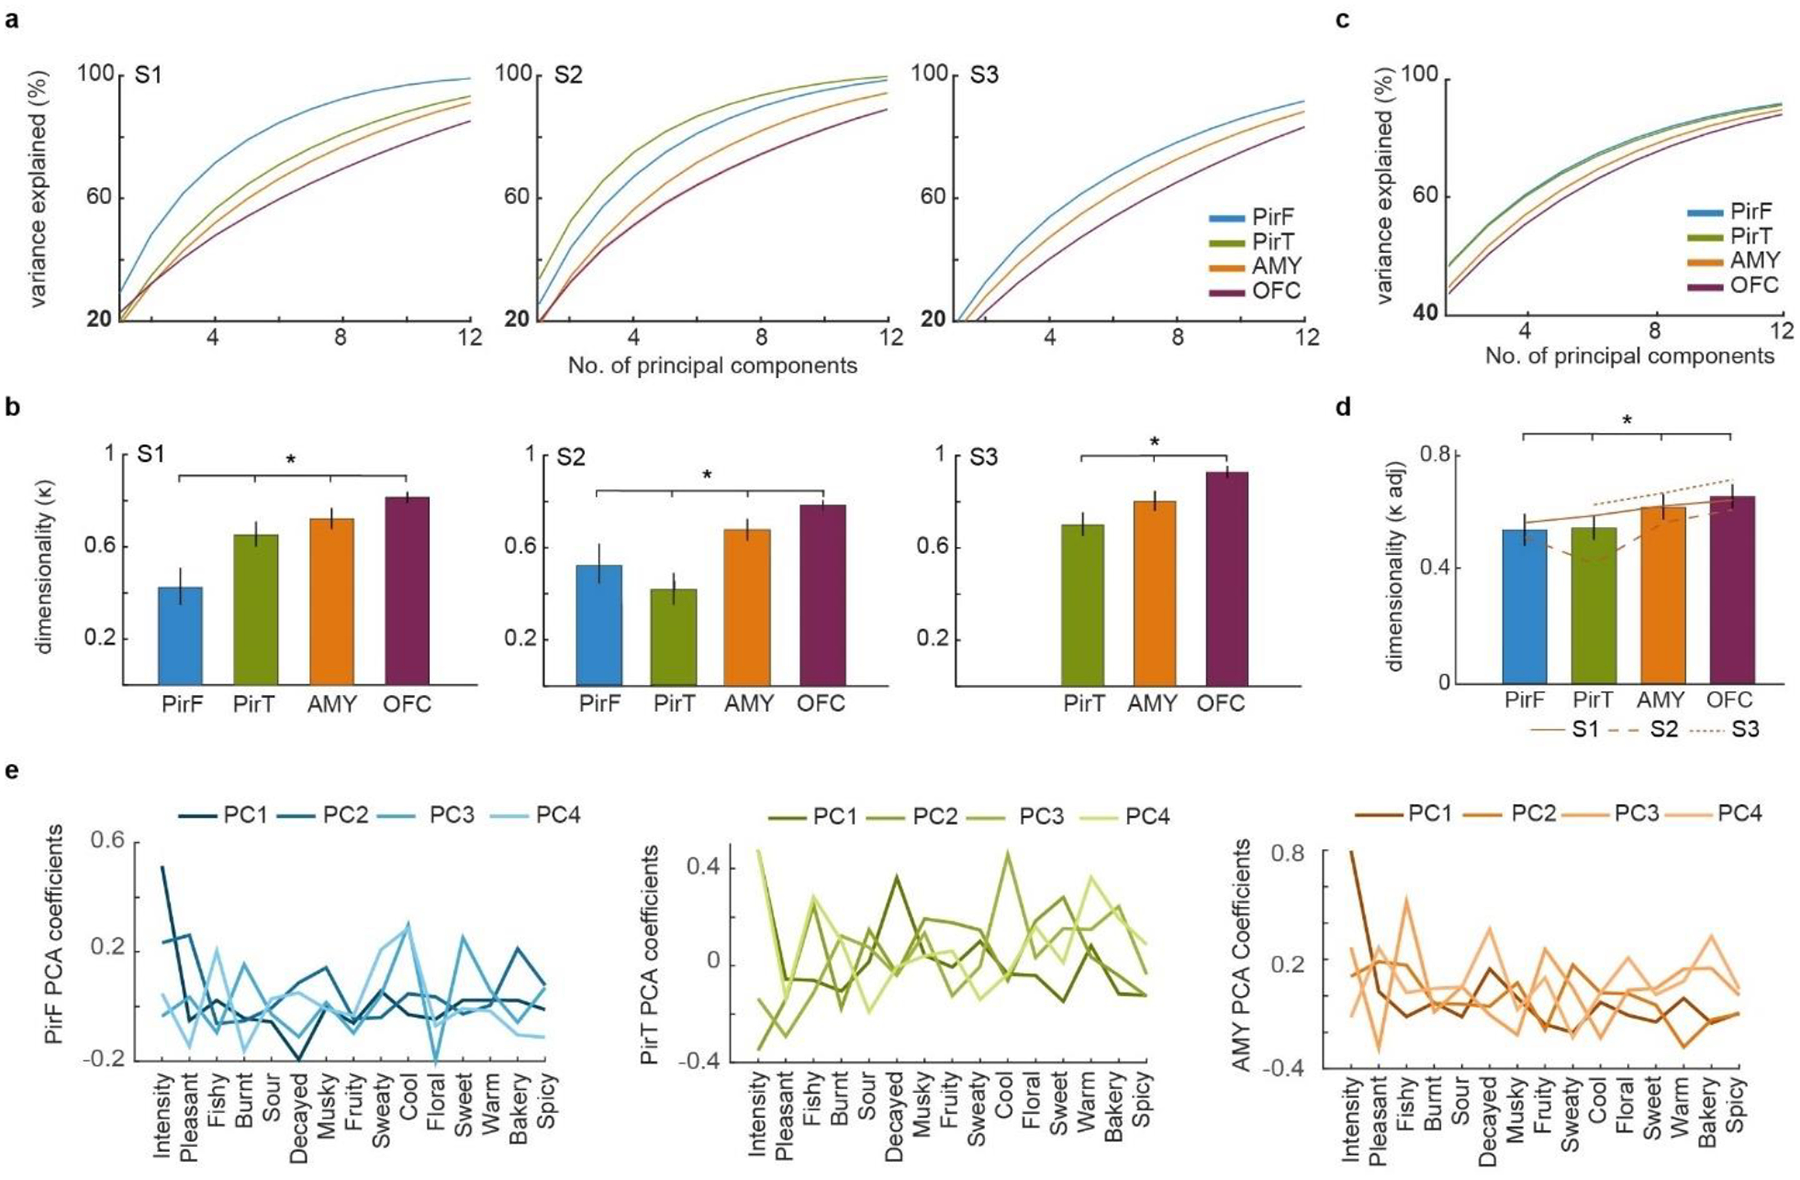
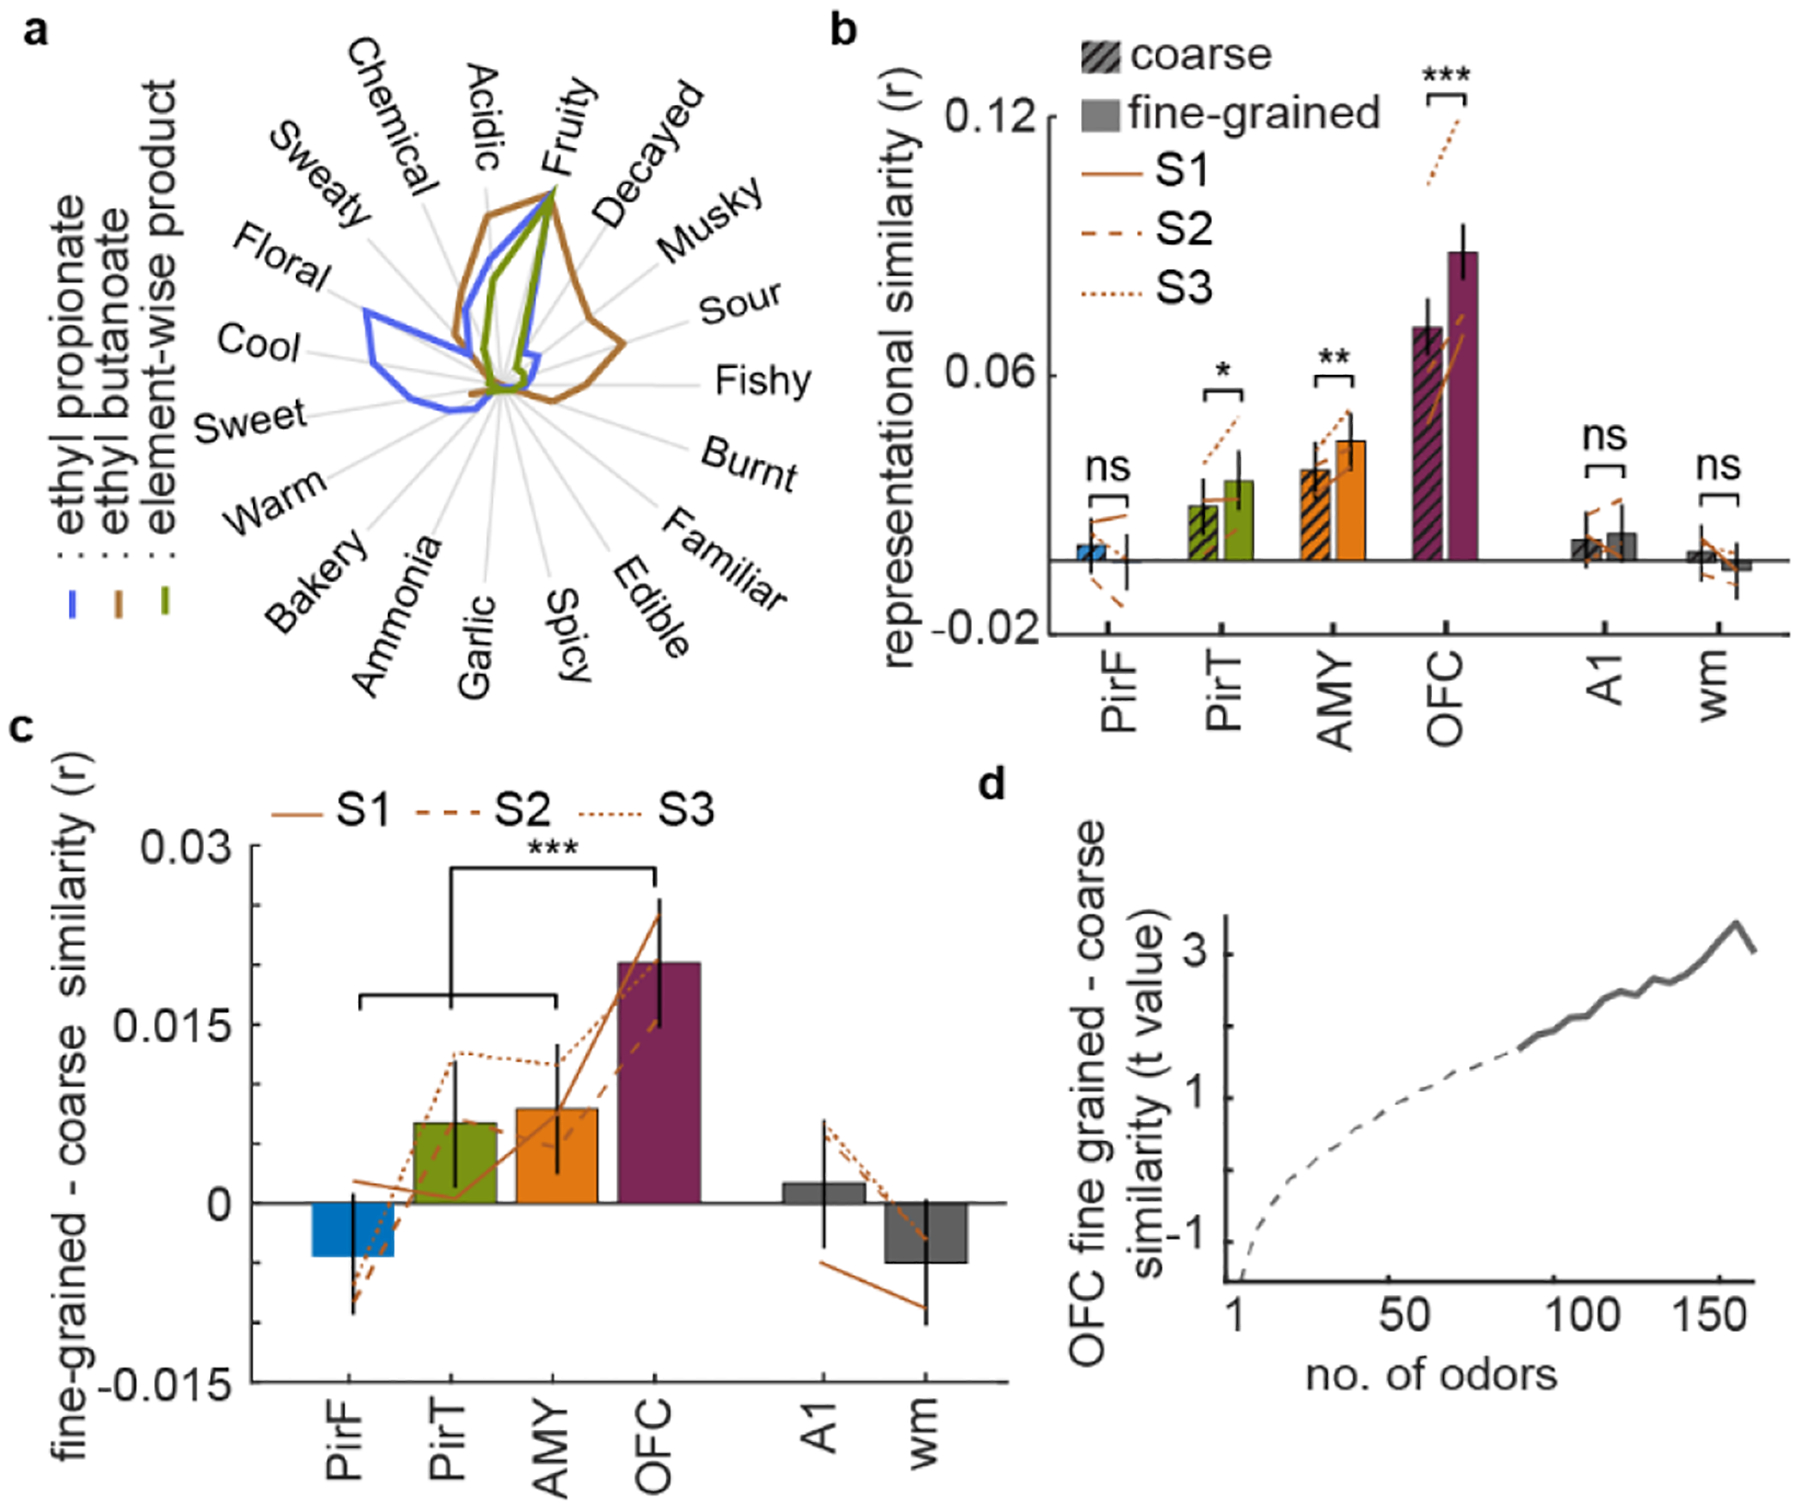
Odor perception is inherently subjective. Previous work has shown that odorous molecules evoke distributed activity patterns in olfactory cortices, but how these patterns map on to subjective odor percepts remains unclear. In the present study, we collected neuroimaging responses to 160 odors from 3 individual subjects (18 h per subject) to probe the neural coding scheme underlying idiosyncratic odor perception. We found that activity in the orbitofrontal cortex (OFC) represents the fine-grained perceptual identity of odors over and above coarsely defined percepts, whereas this difference is less pronounced in the piriform cortex (PirC) and amygdala. Furthermore, the implementation of perceptual encoding models enabled us to predict olfactory functional magnetic resonance imaging responses to new odors, revealing that the dimensionality of the encoded perceptual spaces increases from the PirC to the OFC. Whereas encoding of lower-order dimensions generalizes across subjects, encoding of higher-order dimensions is idiosyncratic. These results provide new insights into cortical mechanisms of odor coding and suggest that subjective olfactory percepts reside in the OFC.


Conflict of interest statement

Competing interests

The authors declare no competing interests.

Figures

Extended Data Figure 1:
Extended Data Figure 1:. Perceptual odor descriptors and ratings.
a, Reliability of perceptual ratings. In each subject and for each descriptor, reliability of the perceptual descriptor is computed by correlating perceptual ratings for the same odor acquired in different sessions. Gray line indicates threshold for statistical significance (r>0.131, threshold p=0.05, n = 3 subjects, 160 odors/subject, one tailed t-test) and dots are individual subjects. Reliability is computed between different fMRI sessions for S1. For S2 and S3, the average ratings acquired in two behavioral sessions outside the scanner were correlated with ratings acquired inside the scanner (S2, r=0.589; S3, r=0.660, n = 3 subjects, 160 odors/subject,). The correlation of odor-wise descriptor ratings (averaged across odors) between S2 and S3 was 0.377. b, Histogram of discriminability of odors for the average subject. Discriminability between two odors is the absolute difference (in standard deviations) of the perceptual feature with maximum difference. c, Perceptual similarity matrices for all subjects. Each cell in the matrix depicts the correlation between the perceptual ratings of two odors. For illustration, rows and columns are sorted using k-means, independently for each subject. d, Generalizability of perceptual ratings across subjects is computed as the correlation between the (off-diagonal entries of) the perceptual similarity matrices of two subjects and averaged across all subject pairs (r=0.168, p=0.0000, n = 3 subjects, 12720 odor pairs/subject, two-tailed t-test). Dots indicate subject pairs. The gray line indicates the threshold for statistical significance (r>0.022, threshold p=0.05, n = 3 subjects, 12720 odor pairs/subject, two-tailed t-test). Errorbars indicate 95% C.I.
Extended Data Figure 2:
Extended Data Figure 2:. Neural responses to odors.
a, Task design comprising of self-paced behavioral task (top-panel) to acquire at least two sets of ratings per odor per descriptor and fMRI task (bottom panel) to rate the odors. S1 provided ratings in all fMRI sessions, whereas S2 and S3 did not rate odors in the third fMRI session. b, Odor-evoked fMRI response in each ROI for each subject. Shaded areas depict 95% C.I. for the mean (black lines) per subject. Peaks in all areas occurred at least 4 seconds after odor presentation. Analyses were restricted to up to 6 seconds to avoid confounding the neural activity with the perceptual rating task. For OFC in S3, BOLD response does not return to baseline, highlighting individual and inter-regional variability in the shape of the hemodynamic response. c, Mean percentage of gray matter voxels with significant odor-evoked responses for each ROI. Error bars depict 95% C.I. and lines depict individual subjects (n=3 subjects, 160 odors/subject). d, Average temporal signal to noise ratio (t-snr: mean/standard deviation of the voxel time-series) in an ROI. Bars denote mean effects and errorbars are s.e.m. across subjects (n=3 subjects, 160 odors/subject). t-snr did not differ significantly across areas (F3,8=0.39, p=0.78, one way ANOVA). e, Neural similarity matrices for each ROI in each subject. Each cell in the matrix depicts the correlation between the multi-voxel response patterns of two odors. For illustration purposes, rows and columns are sorted using k-means (4 total clusters), independently for each subject. f, Correlation of neural activity patterns evoked by the same odor in different sessions (pattern reliability), averaged across odors and subjects. Error bars indicate s.e.m. across subjects. Pattern reliability is significant in all areas and in all subjects (r>0, p=0.000, Wilcoxon signed rank test, (n=3 subjects, 12720 odor pairs/subject)), except PirF in S3 (r=0.04, p=0.086, Wilcoxon signed rank test, (n=3 subjects, 12720 odor pairs/subject)). g, Pattern reliability separately measured between sessions 1 and 2, sessions 2 and 3, and sessions 1 and 3. Pattern reliability between sessions 1 and 2 and 2 and 3 is not significantly different from pattern reliability between sessions 1 and 3 (F1,6=0.02, p=0.90, repeated measures 2-way ANOVA with session pairs and ROI as factors). There was no significant main effect of ROI (F3,6=2.07, p=0.206), and no significant interaction (F3,6=2.12, p=0.198), suggesting that odor-evoked activity patterns remained stable across fMRI sessions. Error bars indicate 95% C.I. For all tests, n=3 subjects, 12720 odor pairs/subject.
Extended Data Figure 3:
Extended Data Figure 3:. Representational similarity analysis (RSA) for individual subjects.
RSA analysis based on coarse and fine-grained perceptual similarity for individual subjects. Correlations were taken across 12,720 odor pairs. a, Bars depict the Spearman rank-correlation between neural and coarse perceptual similarity (rc hatched) or fine-grained perceptual similarity matrices (rf solid), for individual subjects. Bars indicate mean correlation and error bars depict 95% C.I. (perc. bootstrap). In all subjects, fine-grained and coarse perceptual representational similarity is significant in AMY and OFC. In subject S1, representation of fine-grained perceptual similarity is significantly higher than coarse perceptual similarity in OFC, but not in any other area (PirF, rc=0.010, p=0.132, rf=0.012, p=0.075 p(rf>rc)=0.692; PirT, rc=0.016, p=0.022, rf=0.017, p=0.019, p(rf>rc)=0.932; AMY, rc=0.018, p=0.002, rf=0.025, p=0.0000, p(rf>rc)=0.127; OFC, rc=0.037, p=0.0000, rf=0.061, p=0.0000, p(rf>rc)=0.0000; A1, rc=0.005, p=0.472, rf=−0.0001, p=0.988, p(rf>rc)=0.312; wm, rc=0.006, p=0.351, rf=−0.002, p=0.721, p(rf>rc)=0.057, two-tailed bootstrap comparison). In subject S2, representation of fine-grained perceptual similarity is significantly higher than coarse perceptual similarity in OFC, but not in other areas (PirF, rc=−0.005, p=0.442, rf=−0.013, p=0.050, p(rf>rc)=0.060; PirT, rc=0.002, p=0.793, rf=0.009, p=0.223, p(rf>rc)=0.095; AMY, rc=0.026, p=0.0000, rf=0.030, p=0.0000, p(rf>rc)=0.290; OFC, rc=0.051, p=0.0000, rf=0.067, p=0.0000, p(rf>rc)=0.0000; A1, rc=0.012, p=0.076, rf=0.016, p=0.015, p(rf>rc)=0.290; wm, rc=−0.003, p=0.619, rf=−0.006, p=0.330, p(rf>rc)=0.463, two-tailed bootstrap comparison). In subject S3, representation of fine-grained perceptual similarity is significantly higher than coarse perceptual similarity in PirT, AMY and OFC, but not in PirF, A1 and wm (PirF, rc=0.007, p=0.295, rf=0.0002, p=0.960, p(rf>rc)=0.177; PirT, rc=0.026, p=0.0000, rf=0.039, p=0.0000, p(rf>rc)=0.009; AMY, rc=0.030, p=0.0000, rf=0.041, p=0.0000, p(rf>rc)=0.018; OFC, rc=0.101, p=0.0000, rf=0.122, p=0.0000, p(rf>rc)=0.0000; A1, rc=−0.0002, p=0.976, rf=0.005, p=0.460, p(rf>rc)=0.282; wm, rc=0.005, p=0.476, rf=−0.002, p=0.771, p(rf>rc)=0.553, two-tailed bootstrap comparison). Thus, OFC is the only ROI where the fine-grained RSA exceeds the coarse RSA in all three subjects. b, Difference between the neural representation of fine-grained and coarse perceptual similarity in a (r). Bars depict mean correlation difference in each subject, error bars depict 95% C.I. (perc. bootstrap). The difference is significantly larger in OFC than in PirF in all subjects (OFC-PirF all subjects, p=0.0000), in PirT for S1 (p=0.0012) but not S2 (p=0.106) or S3 (p=0.211) and in AMY for S1 (p=0.0012) and S2 (p=0.025) but not in S3 (p=0.171) (two-tailed bootstrap comparison, 12720 odor pairs). The difference between the coarse and fine-grained RSA is maximum in OFC across areas for all subjects. Further, OFC is the only area where the difference between the coarse and fine-grained RSA is significant across all subjects.
Extended Data Figure 4:
Extended Data Figure 4:. Control analyses for RSA.
We performed control RSAs in olfactory ROIs as well as control areas A1 (primary auditory cortex) and wm (white matter voxels). For statistics on subject-wise results, see Extended Data Table 2. a, (Top panel) bars depict the Spearman rank-correlation between neural and coarse (rc hatched) or fine-grained perceptual similarity matrices (rf solid), averaged across subjects, adjusted to include intensity and pleasantness. rf>rc in all areas except PirF, A1 and wm. All p-values are based on null hypothesis rc = rf, tested using two tailed bootstrap comparison (PirF, rc=0.005, rf=0.005, p=0.992; PirT, rc=0.022, rf=0.035, p=0.0000; AMY, rc=0.040, rf=0.059, p=0.0000; OFC, rc=0.084, rf=0.120, p=0.0000; A1, rc =0.014, rf =0.015, p=0.734; wm, rc =0.008, rf =0.002, p=0.03). Note that in wm, rc significantly exceeds rf (i.e., rc>rf), which is the opposite of what is expected and found in olfactory brain areas, and testing rf>rc using a one-tailed test is not significant (p=0.97). (Bottom panel) Difference between the fine-grained and coarse representational similarity in a, top panel (r). Difference is significantly higher in OFC than in PirF, PirT, AMY, A1 or wm (all areas, p=0.0000, two-tailed bootstrap comparison). b, (Top panel) bars depict the Spearman rank correlation between neural and coarse (rc hatched) or fine-grained perceptual similarity matrices (rf solid), averaged across subjects, adjusted to account for differences in size of the ROI. 70 voxels were chosen with replacement from each ROI and subject to construct the neural similarity matrix. rf>rc only in the OFC and not other areas (PirF, rc=0.004, rf=0.000, p=0.196; PirT, rc=0.012, rf=0.018, p=0.080; AMY, rc=0.019, rf=0.026, p=0.077; OFC, rc=0.049, rf=0.064, p=0.0000; A1, rc =0.005, rf =0.006, p=0.745; wm, rc =0.002, rf =−0.002, p=0.172). (Bottom panel) Difference between the fine-grained and coarse representational similarity in b, top panel (r). Difference is significantly higher in OFC than in PirF, A1 or wm (p=0.0000) and trending for PirT (p=0.053) and AMY (p=0.074). c, (Top panel) bars depict the Spearman rank correlation between neural and coarse (rc hatched) or fine-grained perceptual similarity matrices (rf solid), averaged across subjects, adjusted to account for perceptual correlations with molecular features. 4869 molecular features were used to construct the molecular similarity matrix. Molecular similarity was regressed out from both fine-grained and coarse perceptual similarity matrices. rf>rc in all areas except PirF, A1 and wm (PirF, rc=0.003, rf=−0.000, p=0.113; PirT, rc=0.013, rf=0.020, p=0.010; AMY, rc=0.021, rf=0.029, p=0.002; OFC, rc=0.058, rf=0.078, p=0.0000; A1, rc =0.004, rf =0.006, p=0.538; wm, rc =0.002, rf =−0.003, p=0.060). (Bottom panel) Difference between the fine-grained and coarse representational similarity in c, top panel (r). Difference is significantly higher in OFC than all areas (PirF, A1, wm, p=0.0000; PirT, p=0.0004; AMY, p=0.0002). d, (Top panel) bars depict the Spearman rank correlation between neural and coarse (rc hatched) or fine-grained perceptual similarity matrices (rf solid), averaged across subjects, after excluding odors with low detectability. rf>rc all areas except wm (PirF, rc=0.002, rf=−0.007, p=0.005; PirT, rc=0.006, rf=0.015, p=0.008; AMY, rc=0.021, rf=0.030, p=0.007; OFC, rc=0.051, rf=0.078, p=0.0000; A1, rc =0.000, rf =0.087, p=0.049; wm, rc =−0.001, rf =0.000, p=0.701). (Bottom panel) Difference between the fine-grained and coarse representational similarity in d, top panel (r). Difference is significantly higher in OFC than all areas (PirF, AMY, A1, wm p=0.0000; PirT, p=0.0001;). e, (Top panel) bars depict the Spearman rank correlation between neural and coarse (rc hatched) or fine-grained perceptual similarity matrices (rf solid), averaged across subjects when neural responses were extracted from the same time bin (5 second after odor onset) in all areas and subjects. rf>rc in PirT, AMY and OFC but not other areas (PirF, rc=−0.001, rf=0.002, p=0.184; PirT, rc=0.013, rf=0.020, p=0.012; AMY, rc=0.030, rf=0.038, p=0.002; OFC, rc=0.060, rf=0.081, p=0.0000; A1, rc =0.002, rf =0.002, p=0.859; wm, rc =0.000, rf =0.001, p=0.733). (Bottom panel) Difference between the fine-grained and coarse representational similarity in e, top panel (r). Difference is significantly higher in OFC than all areas (all areas, p=0.0000). f, (Top panel) bars depict the Pearson’s (instead of Spearman) correlation between neural and coarse (rc hatched) or fine-grained perceptual similarity matrices (rf solid), averaged across subjects. rf>rc only in PirT, AMY and OFC but not other areas (PirF, rc=0.002, rf=0.002, p=0.97; PirT, rc=0.016, rf=0.022, p=0.046; AMY, rc=0.027, rf=0.037, p=0.002; OFC, rc=0.070, rf=0.093, p=0.0000; A1, rc =0.005, rf =0.008, p=0.360; wm, rc =0.002, rf =0.000, p=0.364). (Bottom panel) Difference between the fine-grained and coarse representational similarity in f, top panel (r). Difference is significantly higher in OFC than all areas (all areas, p=0.0000). For all panels, error bars depict 95% C.I. (perc. bootstrap) and comparisons are based on two tailed bootstrap comparison., n=3 subjects, 12720 odor pairs/subject.
Extended Data Figure 5:
Extended Data Figure 5:. Statistical control analyses for RSA.
a, To account for potential statistical biases in the bootstrap procedure, we performed additional permutation tests for perceptual and molecular RSA effects (Figure 2b). For this, we generated null distributions by randomly shuffling perceptual and molecular ratings across odors. Plots show the means and 95% C.I. for the null distributions of perceptual and molecular RSA effects, which were (as expected) not significantly different from zero in any area for any subject (p>0.2, all areas, all subjects). Solid lines indicate 95% C.I. for perceptual RSA and dashed lines indicate 95% C.I. (two tailed percentile bootstrap) for molecular RSA. Importantly, we used these null distributions to compute p-values for the perceptual and molecular RSA shown in Figure 2b, confirming that rp is significant in PirT (p=0.0000), AMY (p=0.0000), OFC (p=0.0000), A1 (p=0.008) but not PirF (p=0.308) or wm (p = 0.733). Moreover, rp significantly exceeds rm in OFC (p=0.0000) but not in PirF (p=0.288), PirT (p=0.102), AMY (p=0.173), A1 (p = 0.99) or wm (0.741, two tailed permutation test). To further test for biases in the bootstrap approach, we tested whether the number of odor pairs selected in each bootstrap affects the results. That is, we computed the correlation between the number of unique odor pairs in each bootstrap and rp and rm which was not significant in most areas and subjects (all areas, p>0.05, one sample t-test) except AMY in S1 (p = 0.035, one sample t-test). b, To account for potential statistical biases in the bootstrap procedure, we performed additional permutation tests for coarse and fine-grained perceptual RSA effects (Figure 3b). Similar to the analysis described in panel a, we generated null distributions by randomly shuffling perceptual ratings across odors. Plots show the means and 95% C.I. (two tailed percentile bootstrap) for the null distributions of coarse and fine-grained perceptual RSA effects, which were (as expected) not significantly different from zero in any area for any subject (p>0.2, all areas, all subjects). Solid lines indicate 95% C.I. for fine-grained RSA and dashed lines indicate 95% C.I. for coarse RSA. Importantly, we used these null distributions to compute p-values for the coarse and fine-grained perceptual RSA effects shown in Figure 3b, confirming that rc is significant in PirT (p=0.006), AMY (p=0.0000), OFC (p=0.0000), but not PirF (p=0.401), A1 (p=0.280) or wm (p = 0.589), whereas rf is significant PirT (p=0.0003), AMY (p=0.0000), OFC (p=0.0000), but not PirF (p=0.98), A1 (p=0.182) or wm (p = 0.660). Moreover, rf > rc is significant in AMY (p=0.0232), OFC (p=0.0000) and trending in PirT (p = 0.051), but not significant in PirF (p=0.198), A1 (p = 0.651) or wm (0.147, two tailed permutation test). c, To further validate our RSA results, we compared rc and rf in olfactory areas to rc and rf in our control area A1. All olfactory areas (except PirF) had significantly larger representational similarities for fine-grained (rf) odor percepts than A1 (difference between representational similarities in the ROI and A1 denoted by ROI-A1, (rc: PirF-A1, p = 0.794; PirT-A1, p = 0.058; AMY-A1, p =0.0000; OFC-A1, p =0.0000; wm-A1, p = 0.601; rf : PirF-A1 , p = 0.161; PirT-A1 , p = 0.002; AMY-A1, p = 0.0000; OFC-A1, p = 0.0000; wm-A1, p = 0.086, two tailed bootstrap comparison). For all panels, bars indicate mean effects and error bars depict 95% C.I. (perc. bootstrap), n=3 subjects, 12720 odor pairs/subject.
Extended Data Figure 6:
Extended Data Figure 6:. RSA control analyses for intensity, pleasantness and sniff evoked activity.
a, We examined representational similarities based exclusively on intensity or pleasantness. The intensity RSA is significant in all areas (PirF, PirT, AMY, OFC, A1, p=0.0000; wm, p = 0.033), while the pleasantness RSA is significant only in the olfactory areas: PirF, PirT, AMY and OFC but not A1 or wm (PirF, p = 0.002; PirT, AMY, OFC, p=0.0000; A1, p = 0.105; wm, p = 0.42, two tailed bootstrap comparison, n=3 subjects, 12720 odor pairs/subject). b, RSA results when intensity or pleasantness is regressed out of the perceptual descriptor ratings. Two RSA models were constructed: one without intensity and one without pleasantness. The RSA without intensity is significant in PirT, AMY and OFC but not PirF, A1 or wm (PirF, p = 0.345; PirT, p = 0.006; AMY, p=0.0000; OFC, p=0.0000; A1, p = 0.903; wm, p = 0.125). The RSA without pleasantness is significant in PirF, PirT, AMY, OFC, A1 but not wm (PirF, p = 0.039; PirT, AMY, OFC, A1, p =0.0000; wm, p = 0.778, two tailed bootstrap comparison). This suggests that perceptual encoding does not exclusively rely on intensity and/or pleasantness in olfactory areas (PirT, AMY or OFC) and that RSA results in the A1 control area are exclusively driven by odor intensity. For all tests, n=3 subjects, 12720 odor pairs/subject. c, Pearson’s correlation of intensity ratings and sniff volumes (averaged across all trials) across 160 odors for each subject. d, Pearson’s correlation of intensity ratings and sniff durations (averaged across all trials) across 160 odors for each subject. e, Regressing odor similarity based on sniff volume from intensity and pleasantness similarity and computing the residual RSA for intensity and pleasantness (similar to a). The intensity RSA is significant in all areas (PirF, PirT, AMY, OFC, A1, p=0.0000, two-tailed boostrap comparison) except wm, p = 0.128, while the pleasantness RSA is significant only in the olfactory areas: PirF, PirT, AMY and OFC but not A1 or wm (PirF, p = 0.001; PirT, p = 0.002; AMY, OFC, p=0.0000; A1, p = 0.639; wm, p = 0.543, n=3 subjects, 12720 odor pairs/subject). f, Regressing odor similarity based on sniff duration from intensity and pleasantness similarity and computing the residual RSA for intensity and pleasantness (similar to a). The intensity RSA is significant in all areas (PirF, PirT, AMY, OFC, p=0.0000; A1,p = 0.001, two tailed boostrap comparison) except wm, p = 0.392, while the pleasantness RSA is significant only in the olfactory areas: PirF, PirT, AMY and OFC but not A1 or wm (PirF, p = 0.005; PirT, p = 0.044; AMY, p=0.004; OFC, p=0.0000; A1, p = 0.616; wm, p = 0.792, n=3 subjects, 12720 odor pairs/subject). g, We regressed odor similarity based on sniff volume from coarse and fine-grained perceptual similarity and computed the residual RSA. Results are similar to Figure 3b. rf>rc in all areas except PirF, A1 and wm (PirF, rc=0.002, rf=−0.001, p=0.150; PirT, rc=0.012, rf=0.018, p=0.019; AMY, rc=0.021, rf=0.029, p=0.004; OFC, rc=0.059, rf=0.098, p=0.0000; A1, rc =0.003, rf =0.004, p=0.638; wm, rc =0.002, rf =−0.003, p=0.055). h, We regressed odor similarity based on sniff duration from coarse and fine-grained perceptual similarity and computed the residual RSA. Results are similar to Figure 3b. rf>rc in all areas except PirF, A1 and wm (PirF, rc=0.003, rf=−0.001, p=0.090; PirT, rc=0.012, rf=0.018, p=0.006; AMY, rc=0.020, rf=0.027, p=0.003; OFC, rc=0.057, rf=0.077, p=0.0000; A1, rc =0.003, rf =0.004, p=0.680; wm, rc =0.002, rf =−0.003, p=0.063). In all panels, error bars indicate 95% C.I.
Extended Data Figure 7:
Extended Data Figure 7:. RSA for increasing numbers of perceptual descriptors.
a Perceptual representational similarity as a function of the number of perceptual descriptors used in estimating perceptual similarity. The case when only 1 descriptor is used corresponds to coarse representational similarity while the case when 16 descriptors are used corresponds to fine-grained representational similarity (Figure 3b). b, Slope of perceptual representational similarity as a function of number of perceptual descriptors used. Error bars are s.e.m. across subjects. Slopes are maximal for OFC in all subjects (F3,8=6.99, p=0.013, one way ANOVA, n = 3 subjects). This indicates that fine-grained representational similarity in the OFC increases as additional descriptors are added in the model.
Extended Data Figure 8:
Extended Data Figure 8:. Control analyses for encoding models.
a, Mean prediction accuracy of the encoding model using 14 orthogonal principal components (explaining at least 90% of the variance) of the perceptual descriptors as basis functions. B, Percentage of odor-responsive gray matter voxels with significant prediction accuracy (threshold p=0.05, one-tailed one-sample t-test, FDR corrected) with PCA basis. c, Dimensionality of encoding for the encoding model with PCA basis. Dimensionality of encoding increases from PirF to OFC (p=0.000, FWE against the null hypothesis κ(PirF)= κ(PirT)= κ(AMY)= κ(OFC), two-tailed bootstrap comparison). d, Mean prediction accuracy of the encoding model with 4-fold cross-validation where training and test odors came from independent scanning sessions. e, Percentage of odor-responsive gray matter voxels with significant prediction accuracy (threshold p=0.05, one-tailed one-sample t-test, FDR corrected) for encoding model with 4-fold cross-validation. f, Dimensionality of encoding for the encoding model with 4-fold cross-validation. Dimensionality of encoding increases from PirF to OFC (p=0.000, FWE against the null hypothesis κ(PirF)= κ(PirT)= κ(AMY)= κ(OFC), two-tailed bootstrap comparison). g, Prediction accuracy of encoding model with shuffled perceptual ratings is not significant for any area in any subject (p > 0.1, all areas, all subjects, two tailed shuffle test). h, Mean prediction accuracy of the encoding model without odors with low detectability is significantly greater than zero in all ROIs and subjects (except PirF in subject S1, p=0.65, PirF S3, p=0.03, remaining areas/subjects p=0.0000, two sided Wilcoxon signed rank test). These results are qualitatively similar to those obtained when odors with low detectability are included (Figure 4c). i, Mean prediction accuracy of encoding model in primary auditory cortex (A1) and white matter (wm) (A1, mean r= 0.027; wm mean r = 0.045) are much lower than those observed in olfactory areas (Figure. 4c). j, Percentage of voxels in A1 and wm that show significant prediction accuracy (threshold p=0.05, one-tailed one-sample t-test, FDR corrected). For all panels, bars indicate mean effects and error bars indicate 95% C.I.. All tests were based on n=3 subjects, 160 odors/subject.
Extended Data Figure 9:
Extended Data Figure 9:. Dimensionality of encoded perceptual spaces for individual subjects.
a, Cumulative percentage of explained variance in the voxel-wise encoding weights as a function of the number of principal components, for individual subjects. b, Dimensionality parameter (κ) is proportional to area under the curve in a and reflects the number of principal components required to explain a given percentage of variance explained in each subject. Bars depict mean effect and error bars depict 95% C.I. (perc. bootstrap) across n=3 subjects. The dimensionality of perceptual encoding is maximum in OFC in each subject and significantly different across areas (p=0.000 (FWE corrected) against the null hypothesis κ(PirF)= κ(PirT)= κ(AMY)= κ(OFC), two-tailed bootstrap comparison, n=3 subjects, 160 odors/subject). c, Dimensionality estimation adjusted for differences in ROI size. 25 voxels were chosen with replacement from each ROI to estimate the principal components in each bootstrap. d, Adjusted dimensionality increases from PirF to PirT to AMY and to OFC. Adjusted dimensionality is maximum in OFC and significantly different across areas (p=0.002 (FWE corrected) against the null hypothesis κ(PirF)= κ(PirT)= κ(AMY)= κ(OFC), two-tailed bootstrap comparison, n=3 subjects, 160 odors/subject). Error bars indicate 95% C.I. e Average PCA coefficients of perceptual feature weights for different principal components in PirF, PirT and AMY. PC1 is primarily driven by intensity, whereas subsequent components are more heterogeneous in all ROIs.
Extended Data Figure 10:
Extended Data Figure 10:. Subject-specific and cross-subject encoding model.
a, Mean prediction accuracy of encoding models based on fMRI data and perceptual ratings provided by the same subject (subject-specific encoding model [EM], dark) and fMRI data and ratings provided by different subjects (cross-subject EM, light bars). Subject-specific encoding models have a significantly higher prediction accuracy compared to cross-subject encoding models (F1,15=12.58, p=0.016, repeated measures 2-way ANOVA with subjective-specific vs. cross-subject and ROI as factors). There was no significant main effect of ROI (F3,15=0.62, p=0.615), and no significant interaction (F3,15=0.84, p=0.494). b, Differences between the prediction accuracy of subject-specific and cross-subject encoding models. All encoding models were based on 14 principal components of perceptual ratings that explained at least 90% of variance. Lines depict individual subject pairs. Error bars are s.e.m. across all six subject pairs.
Figure 1.
Figure 1.. Neural activity patterns in olfactory brain areas represent odor stimuli.
a, Trial structure. During fMRI scanning, subjects were cued to sniff on each trial. If they reported detecting an odor (Extended Data Figure 2), they rated the odor on one of the perceptual descriptors listed in panel 1b. Odors were presented 27–30 times in pseudorandomized order across multiple sessions, and only one descriptor rating was obtained on each trial (see Methods). b, Perceptual ratings for two example odors (methyl tributyrate and 2-methyl-1-butanol). Subjects rated odors on 18 perceptual descriptors (note that these were drawn from a total of 21 descriptors, see Methods section for details). S1 rated 2-methyl-1-butanol as sweaty and decayed, but S2 found the same odor to be pleasant and floral, highlighting the substantial variability in odor perception across individuals. c, Anatomical regions of interest (ROIs) shown for subject S1 (PirF: frontal piriform cortex, PirT: temporal piriform cortex, AMY: amygdala, OFC: orbitofrontal cortex, A1: Auditory Cortex, wm: White Matter). In each of the olfactory ROIs, significant odor-evoked activity was observed with similar temporal signal-to-noise ratio in the voxel time series (Extended Data Figure 2). Shaded area shows field of view for scanning. d, Difference between pattern correlation (Δr) among activity patterns evoked by the same minus different odors in different fMRI sessions. Multi-voxel patterns were more similar (across sessions) when comparing responses evoked by the same odor vs. different odors in all four ROIs (Δr>0, p=0.0000 in all areas, n = 3 subjects, 12720 odor pairs/subject, two-tailed percentile bootstrap; p=0.0000 in all areas, n=3 subjects, 12720 odor pairs/subject, two sample t-test). Bars depict mean correlation difference and error bars depict 95% confidence intervals. S1, S2, and S3 indicate subjects 1, 2, and 3.
Figure 2.
Figure 2.. Neural activity patterns represent perceptual odor percepts.
a, Representational similarity analysis (RSA) schematic. For each subject, we computed similarity matrices comparing each odor pair in neural and perceptual spaces. The representational similarity for a given ROI is measured as the Spearman rank-correlation (r) between the off-diagonal entries of these matrices. b, RSA results (PirF: frontal piriform cortex, PirT: temporal piriform cortex, AMY: amygdala, OFC: orbitofrontal cortex; control areas: A1: auditory cortex, wm: white matter). Bars depict the correlation between neural and perceptual similarity (rp, dark bars), or neural and molecular similarity (rm, light bars). rp is significant in all areas except PirF and wm (PirF, rp=0.005, p=0.184; PirT, rp=0.035, p=0.0000; AMY, rp=0.059, p=0.0000; OFC, rp=0.120, p=0.0000; A1, rp=0.015, p=0.0003; wm, rp=0.001, p=0.696; two-tailed bootstrap comparison). rm is significant in all areas except wm (PirF, rm=0.012, p=0.001; PirT, rm=0.024, p=0.0000; AMY, rm=0.050, p=0.0000; OFC, rm=0.077, p=0.0000; A1, rm=0.015, p=0.0004; wm, rm=0.004, p=0.334; two-tailed bootstrap comparison). rp exceeds rm in PirT and OFC but not in other areas (rp>rm: PirF, p=0.172; PirT, p=0.031; AMY, p=0.074; OFC, p=0.0000; A1, p=0.972; wm, p=0.671; two-tailed bootstrap comparison). For all tests, n=3 subjects, 12720 odor pairs/subject. Bars indicate mean correlation and error bars depict 95% confidence intervals. S1, S2, and S3 indicate subjects 1, 2, and 3. We did not observe significant effects when perceptual or molecular descriptors were randomly shuffled (Extended data Figure 5a).
Figure 3.
Figure 3.. Neural activity patterns represent fine-grained odor percepts
a, Perceptual ratings (excluding intensity and pleasantness) for two odors (ethyl propionate and ethyl butanoate), and the element-wise product of their ratings (green), which is maximal for the fruity dimension. Coarse similarity between two odors was defined as the element-wise product of their most dominant perceptual descriptor rating. b, Coarse vs. fine-grained RSA. Neural representation of coarse perceptual similarity (rc, hatched bars) and fine-grained perceptual similarity (rf, solid bars) is significant in PirT, AMY and OFC but not in PirF, A1 or wm (PirF, rc=0.004, p=0.290; PirT, rc=0.015, p=0.0012; AMY, rc=0.024, p=0.0000; OFC, rc=0.063, p=0.0000; A1, rc=0.005, p=0.162; wm, rc=0.002, p=0.510; PirF, rf=−0.0003, p=0.965; PirT, rf=0.021, p=0.0000; AMY, rf=0.032, p=0.0000; OFC, rf=0.083, p=0.0000; A1, rf=0.007, p=0.085; wm, rf=−0.002, p=0.572, two-tailed percentile bootstrap). Further rf is significantly higher than rc in PirT, AMY and OFC, but not in PirF, A1 or wm (PirF, p=0.104; PirT, p=0.012; AMY, p=0.002; OFC, p=0.0000; A1, p=0.556; wm, p=0.060; two-tailed percentile bootstrap). rf is also significantly higher than rc in PirT (p=0.040), AMY (p=0.020) and OFC (p=0.0000) when corrected for multiple comparisons across areas (FDR correction). For subject-wise data, see Extended Data Figure 3 and Supplementary Table 2. c, Difference between the neural representation of fine-grained and coarse perceptual similarity is significantly larger in OFC than in PirF, PirT, and AMY (p=0.0000, two-tailed bootstrap comparison). d, The t-value of the difference between the neural representation of fine-grained and coarse perceptual similarity depicted in c for OFC, computed for odor sets of different sizes. The difference is significant when at least 90 odors are included (threshold p=0.05, two-tailed bootstrap comparison, solid line). In all panels, bars depict mean effects and error bars depict 95% confidence intervals (n=3 subjects, 12720 odor pairs/subject). S1, S2, and S3 indicate subjects 1, 2, and 3. We obtained identical results from additional shuffle tests for representational similarities (Extended data Figure 5b). Coarse and fine-grained representational similarities in A1 are significantly smaller than the effects found in PirT, AMY and OFC (Extended data Figure 5c), and rp in A1 are driven exclusively by odor intensity (Extended data Figure 6b).
Figure 4:
Figure 4:. Modeling odor-evoked activity using individual perceptual spaces.
a, Schematic of the voxel-wise encoding model. The model predicts voxel-wise fMRI activity based on olfactory perceptual features (e.g., garlic [white], mint [green], fish [blue], etc. for both training odor on the left and test odor on the right). In the model training step (left), voxel-wise encoding weights for perceptual features are estimated to optimally fit fMRI activity (fMRI response: black bars, model fits: magenta bars, individual odors are denoted by shapes). In model testing (right), estimated encoding weights are used to predict fMRI responses to an out-of-sample set of test odors using olfactory perpetual ratings as input. Prediction accuracy is defined as the Pearson correlation between the predicted and observed fMRI responses. b, Voxels in olfactory cortices with significant out-of-sample prediction accuracy for individual subjects (threshold p=0.05, one-tailed one-sample t-test, FDR corrected). c, Average prediction accuracy in odor-responsive gray matter voxels by ROI. d, Percentage of odor-responsive gray matter voxels with significant prediction accuracy (threshold p=0.05, one-tailed one-sample t-test, FDR corrected). e, Magnitude of absolute encoding weights averaged across significant voxels by ROI. Dark lines illustrate significant encoding weights (threshold p=0.05, FWE corrected, two-tailed perc. bootstrap). f, Cumulative percentage of explained variance in the voxel-wise encoding weights as a function of the number of principal components, averaged across subjects by ROI. g, Dimensionality (κ) is proportional to the area under the curves depicted in f and reflects the number of principal components required to explain a given percentage of variance. The dimensionality of perceptual encoding increases from PirF and PirT to AMY, and AMY to OFC (p=0.0000, for all pairs except PirF-PirT, p=0.102, two tailed bootstrap comparison). This increase in dimensionality was consistently observed in all subjects individually and was robust when accounting for differences in ROI size (Extended Data Figure 9). Encoding models in the control areas revealed only low prediction accuracies (A1, mean r=0.027; wm, mean r=0.045, Extended Data Figure 8i–j). In all panels, bars denote mean effects and error bars depict 95% C.I. (perc. bootstrap) based on n = 3 subjects, 160 odors/subject.
Figure 5:
Figure 5:. Encoding of idiosyncratic perceptual spaces in the orbitofrontal cortex.
a, Box plots of correlation coefficients between voxel-wise encoding weights across subjects in each ROI. Encoding weights in PirF, PirT, and AMY are significantly more similar across subjects than encoding weights in OFC [r2 (OFC) < r2 (PirF), p=0.0000; r2 (OFC) < r2 (PirT), p=0.0002; r2 (OFC) < r2 (AMY), p=0.030, two-tailed bootstrap comparison)]. The same number of voxel pairs were selected in all areas. Center lines correspond to the median; box limits are upper and lower quartiles; whiskers denote 1.5x interquartile range and points are outliers. b, Inter-subject correlation matrix for the first four principal components of encoding weights in OFC. The correlations of PCA coefficients across subjects for matching principal components (matched using the “stable marriage” algorithm) are highlighted in magenta triads. c, Average inter-subject correlation of different principal components in OFC. Bars denote mean effects and error bars depict 95% C.I. Principal Component 1 (PC1) is significantly more consistent across subjects than PC2-PC4 (F3,8=13.41, p=0.002, one way ANOVA). Lines show cross-subject correlation for individual subject pairs. d, Average PCA coefficients of perceptual feature weights for different principal components. PC1 is primarily driven by intensity, whereas subsequent components are more heterogeneous. S1, S2, and S3 indicate subjects 1, 2, and 3. PCA coefficients for PirF, PirT, and AMY are shown in Extended Data Figure 9e. In all panels, effects are based on n=3 subjects, 160 odors/subject.

Similar articles

Cited by

References

    1. Leopold DA, Wilke M, Maier A & Logothetis NK Stable perception of visually ambiguous patterns. Nature neuroscience 5, 605–609 (2002). - PubMed
    1. Walsh V & Kulikowski J Perceptual constancy: Why things look as they do. (Cambridge University Press, 1998).
    1. Hudson R From molecule to mind: the role of experience in shaping olfactory function. Journal of Comparative Physiology A 185, 297–304 (1999). - PubMed
    1. Sell CS On the unpredictability of odor. Angewandte Chemie International Edition 45, 6254–6261 (2006). - PubMed
    1. Mainland JD et al. The missense of smell: functional variability in the human odorant receptor repertoire. Nat Neurosci 17, 114–120, doi: 10.1038/nn.3598 (2014). - DOI - PMC - PubMed

METHOD REFERENCES

    1. Keller A & Vosshall LB Olfactory perception of chemically diverse molecules. BMC neuroscience 17, 1–17 (2016). - PMC - PubMed
    1. Cai MB, Schuck NW, Pillow JW & Niv Y Representational structure or task structure? Bias in neural representational similarity analysis and a Bayesian method for reducing bias. PLoS computational biology 15, e1006299 (2019). - PMC - PubMed
    1. Zhou G, Lane G, Cooper SL, Kahnt T & Zelano C Characterizing functional pathways of the human olfactory system. Elife 8, e47177 (2019). - PMC - PubMed
    1. Echevarria-Cooper SL et al. Mapping the Microstructure and Striae of the Human Olfactory Tract with Diffusion MRI. Journal of Neuroscience (2021). - PMC - PubMed
    1. Zald DH & Pardo JV Emotion, olfaction, and the human amygdala: amygdala activation during aversive olfactory stimulation. Proceedings of the National Academy of Sciences 94, 4119–4124 (1997). - PMC - PubMed

Publication types

LinkOut - more resources