

Quantifying the spatial clustering characteristics of radiographic emphysema explains variability in pulmonary function
- PMID: 37620507
- PMCID: PMC10449810
- DOI: 10.1038/s41598-023-40950-8
Quantifying the spatial clustering characteristics of radiographic emphysema explains variability in pulmonary function
Abstract
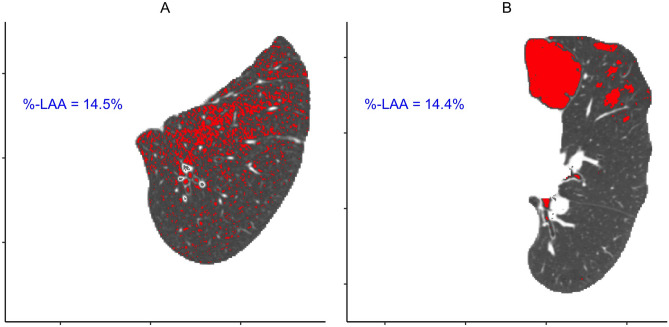
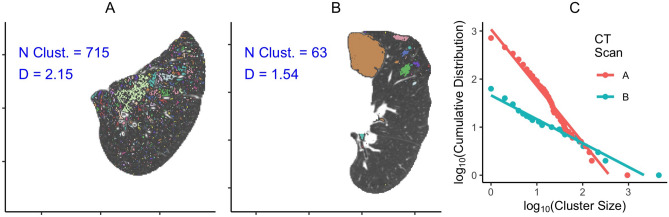
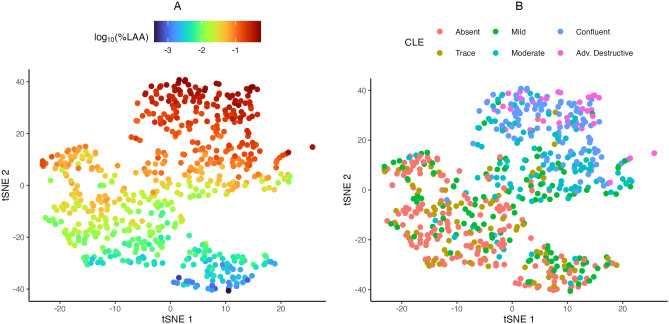
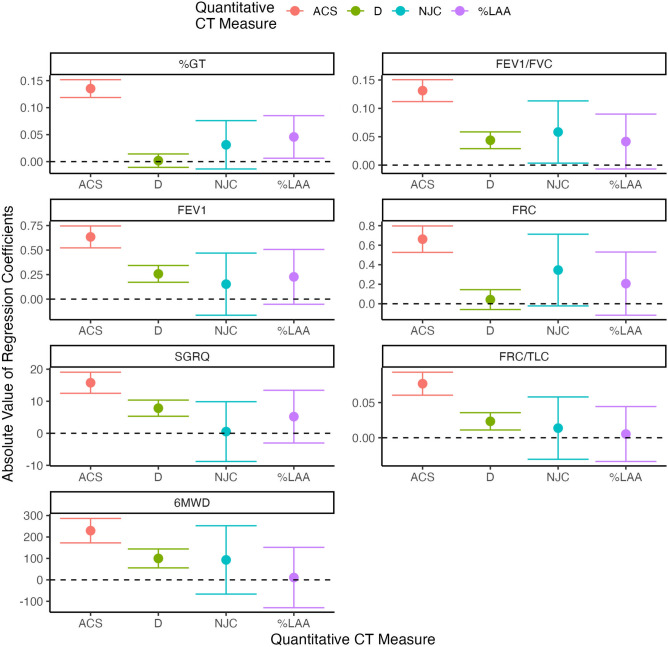
Quantitative assessment of emphysema in CT scans has mostly focused on calculating the percentage of lung tissue that is deemed abnormal based on a density thresholding strategy. However, this overall measure of disease burden discards virtually all the spatial information encoded in the scan that is implicitly utilized in a visual assessment. This simplification is likely grouping heterogenous disease patterns and is potentially obscuring clinical phenotypes and variable disease outcomes. To overcome this, several methods that attempt to quantify heterogeneity in emphysema distribution have been proposed. Here, we compare three of those: one based on estimating a power law for the size distribution of contiguous emphysema clusters, a second that looks at the number of emphysema-to-emphysema voxel adjacencies, and a third that applies a parametric spatial point process model to the emphysema voxel locations. This was done using data from 587 individuals from Phase 1 of COPDGene that had an inspiratory CT scan and plasma protein abundance measurements. The associations between these imaging metrics and visual assessment with clinical measures (FEV[Formula: see text], FEV[Formula: see text]-FVC ratio, etc.) and plasma protein biomarker levels were evaluated using a variety of regression models. Our results showed that a selection of spatial measures had the ability to discern heterogeneous patterns among CTs that had similar emphysema burdens. The most informative quantitative measure, average cluster size from the point process model, showed much stronger associations with nearly every clinical outcome examined than existing CT-derived emphysema metrics and visual assessment. Moreover, approximately 75% more plasma biomarkers were found to be associated with an emphysema heterogeneity phenotype when accounting for spatial clustering measures than when they were excluded.
Trial registration: ClinicalTrials.gov NCT00608764.
© 2023. Springer Nature Limited.
Conflict of interest statement
The authors declare no competing interests.
Figures


Similar articles
-
Spatial Dependence of CT Emphysema in Chronic Obstructive Pulmonary Disease Quantified by Using Join-Count Statistics.Radiology. 2021 Dec;301(3):702-709. doi: 10.1148/radiol.2021210198. Epub 2021 Sep 14. Radiology. 2021. PMID: 34519575
-
Topologic Parametric Response Mapping Identifies Tissue Subtypes Associated with Emphysema Progression.Acad Radiol. 2024 Mar;31(3):1148-1159. doi: 10.1016/j.acra.2023.08.003. Epub 2023 Sep 2. Acad Radiol. 2024. PMID: 37661554 Free PMC article.
-
Slope of emphysema index: an objective descriptor of regional heterogeneity of emphysema and an independent determinant of pulmonary function.AJR Am J Roentgenol. 2010 Mar;194(3):W248-55. doi: 10.2214/AJR.09.2672. AJR Am J Roentgenol. 2010. PMID: 20173123
-
Quantitative computed tomography measurements to evaluate airway disease in chronic obstructive pulmonary disease: Relationship to physiological measurements, clinical index and visual assessment of airway disease.Eur J Radiol. 2016 Nov;85(11):2144-2151. doi: 10.1016/j.ejrad.2016.09.010. Epub 2016 Sep 13. Eur J Radiol. 2016. PMID: 27776670 Free PMC article. Review.
-
CT quantification of pulmonary emphysema: assessment of lung structure and function.Crit Rev Comput Tomogr. 2002;43(6):399-417. Crit Rev Comput Tomogr. 2002. PMID: 12521149 Review.
References
Publication types
MeSH terms
Associated data
Grants and funding
LinkOut - more resources
Full Text Sources
Medical
Research Materials
