Review
. 2024 Jan;25(1):8-25.
doi: 10.1038/s41576-023-00637-2. Epub 2023 Aug 24.

Principles and methods for transferring polygenic risk scores across global populations

Collaborators, Affiliations
Review

Principles and methods for transferring polygenic risk scores across global populations

Linda Kachuri et al. Nat Rev Genet. 2024 Jan.

Abstract

Polygenic risk scores (PRSs) summarize the genetic predisposition of a complex human trait or disease and may become a valuable tool for advancing precision medicine. However, PRSs that are developed in populations of predominantly European genetic ancestries can increase health disparities due to poor predictive performance in individuals of diverse and complex genetic ancestries. We describe genetic and modifiable risk factors that limit the transferability of PRSs across populations and review the strengths and weaknesses of existing PRS construction methods for diverse ancestries. Developing PRSs that benefit global populations in research and clinical settings provides an opportunity for innovation and is essential for health equity.


Figures

Fig. 1 ∣
Fig. 1 ∣. Complex genetic ancestries and admixture using data from UCLA-ATLAS.
a, Comparison between genetically inferred ancestry and self-identified race and ethnicity (SIRE): Hispanic/Latino (HL), non-Hispanic/Latino (NH), Pacific Islander (PI), Native American (NatAm) and African/African American (Afr). Genetically inferred ancestry labels are assigned based on proximity to 1000 Genomes reference populations in principal component (PC) space using the k-nearest neighbour algorithm. SIRE is a composite label based on separate entries in the ‘Race’ and ‘Ethnicity’ fields extracted from medical records. b, First two PCs of the genetic data. Each dot represents an individual, with colours corresponding to their assigned genetically inferred ancestry cluster. A non-trivial percentage of individuals could not be categorized into a ‘homogeneous’ or ‘continental’ population. c, Unsupervised clustering of the genetic data. Each column represents the proportion of the global genetic ancestry of an individual with respect to 1000 Genomes reference populations.
Fig. 2 ∣
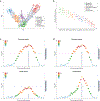
Fig. 2 ∣. Genetic factors that can influence PRS performance.
a, First two principal components (PCs) of the genetic data. Each dot represents an individual. Individuals are assigned discrete population labels by applying arbitrary cut-offs to the genetic ancestry continuum. Different colours represent different population labels. Grey dots represent individuals who are unclassified. A genetic distance (d) can be calculated between each individual and the centre of the discovery genome-wide association study (GWAS) samples in the PC space. b, Prediction accuracy of the polygenic risk score (PRS) shows individual to individual variation and decreases along the genetic ancestry continuum when the genetic distance between the training and target samples increases. c, Differences in causal allelic effect size between the discovery (upper graph) and target (lower graph) samples can influence the accuracy of PRS across populations. d, Differences in linkage disequilibrium (LD) patterns between the discovery (upper graph) and target (lower graph) samples can influence the accuracy of PRS across populations. In panels c and d, each dot represents the marginal association strength of a genetic variant. The lead (most associated) variant in yellow represents the causal variant and the grey bar represents its effect size. Other variants are coloured by descending degrees of LD with the causal variant (ordered red, orange, green and blue dots). Diamond represents the variant (which may be a tagging variant) used in PRS construction. Dashed line represents genome-wide significance.
Fig. 3 ∣
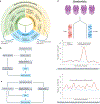
Fig. 3 ∣. Interplay between social, environmental and genetic determinants of health.
a, Complex interrelationship among different risk factors for ill health and poor disease outcomes. These include living and working conditions (such as environmental exposures and social determinants of health (SDOH)) and genomic factors. b, Race and/or ethnicity can confound polygenic risk score (PRS) associations with health outcomes if a correlation exists with genetic ancestry (dotted line). In this case, correction for population structure using methods such as principal component analysis (PCA) that captures similarity in allele frequencies and linkage disequilibrium (LD) structure that arises due to shared demographic histories between populations can mitigate the confounding effect. c, Residual confounding may bias PRS associations when genetic ancestry is correlated with environmental and/or social factors due to shared demographic histories. For instance, when asthma is the health outcome and exposure to air pollution is the non-genetic risk factor, standard methods such as PCA may under-correct for population structure. d, Admixture mapping detects disease-associated loci and patterns of excess local ancestry that help disentangle the contribution of genetic factors to observed disparities in risk.
Fig. 4 ∣
Fig. 4 ∣. Considerations for the assessment of PRS clinical utility.
a, Visual representation of the difference between risk prediction and risk stratification. b, An example of model calibration, that is, the agreement between observed and estimated disease risk. Accurate estimation of absolute risks requires well-calibrated models. For instance, risks are systematically overestimated for Population B compared with Population A. c, Cross-population calibration of the polygenic risk score (PRS) distributions, which can have different mean and spread. Differences in calibration between populations arise due to a combination of the genetic and clinical risk factors. Cross-population calibration is important when selecting a single cut-off to identify individuals as high risk across samples with diverse ancestral and sociocultural backgrounds.

Similar articles

Cited by

  • Machine Learning to Advance Human Genome-Wide Association Studies.
    Sigala RE, Lagou V, Shmeliov A, Atito S, Kouchaki S, Awais M, Prokopenko I, Mahdi A, Demirkan A. Sigala RE, et al. Genes (Basel). 2023 Dec 25;15(1):34. doi: 10.3390/genes15010034. Genes (Basel). 2023. PMID: 38254924 Free PMC article. Review.
  • Biological Insights from Schizophrenia-associated Loci in Ancestral Populations.
    Bigdeli TB, Chatzinakos C, Bendl J, Barr PB, Venkatesh S, Gorman BR, Clarence T, Genovese G, Iyegbe CO, Peterson RE, Kolokotronis SO, Burstein D, Meyers JL, Li Y, Rajeevan N, Sayward F, Cheung KH; Project Among African-Americans to Explore Risks for Schizophrenia (PAARTNERS); Consortium on the Genomics of Schizophrenia (COGS); Genomic Psychiatry Cohort (GPC) Investigators; DeLisi LE, Kosten TR, Zhao H, Achtyes E, Buckley P, Malaspina D, Lehrer D, Rapaport MH, Braff DL, Pato MT, Fanous AH, Pato CN; PsychAD Consortium; Cooperative Studies Program (CSP) #572; Million Veteran Program (MVP); Huang GD, Muralidhar S, Michael Gaziano J, Pyarajan S, Girdhar K, Lee D, Hoffman GE, Aslan M, Fullard JF, Voloudakis G, Harvey PD, Roussos P. Bigdeli TB, et al. medRxiv [Preprint]. 2024 Aug 28:2024.08.27.24312631. doi: 10.1101/2024.08.27.24312631. medRxiv. 2024. PMID: 39252912 Free PMC article. Preprint.
  • Global genomic diversity for All of Us.
    Koch L. Koch L. Nat Rev Genet. 2024 May;25(5):303. doi: 10.1038/s41576-024-00727-9. Nat Rev Genet. 2024. PMID: 38509161 No abstract available.
  • Massively parallel variant-to-function mapping determines functional regulatory variants of non-small cell lung cancer.
    Chen C, Li Y, Gu Y, Zhai Q, Guo S, Xiang J, Xie Y, An M, Li C, Qin N, Shi Y, Yang L, Zhou J, Xu X, Xu Z, Wang K, Zhu M, Jiang Y, He Y, Xu J, Yin R, Chen L, Xu L, Dai J, Jin G, Hu Z, Wang C, Ma H, Shen H. Chen C, et al. Nat Commun. 2025 Feb 6;16(1):1391. doi: 10.1038/s41467-025-56725-w. Nat Commun. 2025. PMID: 39910069 Free PMC article.
  • Development and Validation of a Type 1 Diabetes Multi-Ancestry Polygenic Score.
    Deutsch AJ, Bell AS, Michalek DA, Burkholder AB, Nam S, Kreienkamp RJ, Sharp SA, Huerta-Chagoya A, Mandla R, Nanjala R, Luo Y, Oram RA, Florez JC, Onengut-Gumuscu S, Rich SS, Motsinger-Reif AA, Manning AK, Mercader JM, Udler MS. Deutsch AJ, et al. medRxiv [Preprint]. 2025 Jun 22:2025.06.20.25329522. doi: 10.1101/2025.06.20.25329522. medRxiv. 2025. PMID: 40585163 Free PMC article. Preprint.

References

    1. Kullo IJ et al. Polygenic scores in biomedical research. Nat. Rev. Genet 23, 524–532 (2022). - PMC - PubMed
    1. Abdellaoui A, Yengo L, Verweij KJH & Visscher PM 15 years of GWAS discovery: realizing the promise. Am. J. Hum. Genet 110, 179–194 (2023). - PMC - PubMed
    1. Martin AR et al. Clinical use of current polygenic risk scores may exacerbate health disparities. Nat. Genet 51, 584–591 (2019).

      This paper demonstrates that PRSs have limited generalizability across populations and emphasizes the importance of diversity to realize the full and equitable potential of PRSs.

    1. Fatumo S. et al. A roadmap to increase diversity in genomic studies. Nat. Med 28, 243–250 (2022).

      This paper presents an updated ancestry tabulation for participants in GWAS catalogue and discusses strategies for increasing diversity in genomic studies.

    1. Zhou W. et al. Global Biobank Meta-analysis Initiative: powering genetic discovery across human disease. Cell Genom. 2, 100192 (2022). - PMC - PubMed