Clinical Trial
. 2023 Dec;29(12):3077-3089.
doi: 10.1038/s41591-023-02518-x. Epub 2023 Aug 24.

Nivolumab plus ipilimumab in advanced salivary gland cancer: a phase 2 trial

Affiliations
Clinical Trial

Nivolumab plus ipilimumab in advanced salivary gland cancer: a phase 2 trial

Joris L Vos et al. Nat Med. 2023 Dec.

Abstract

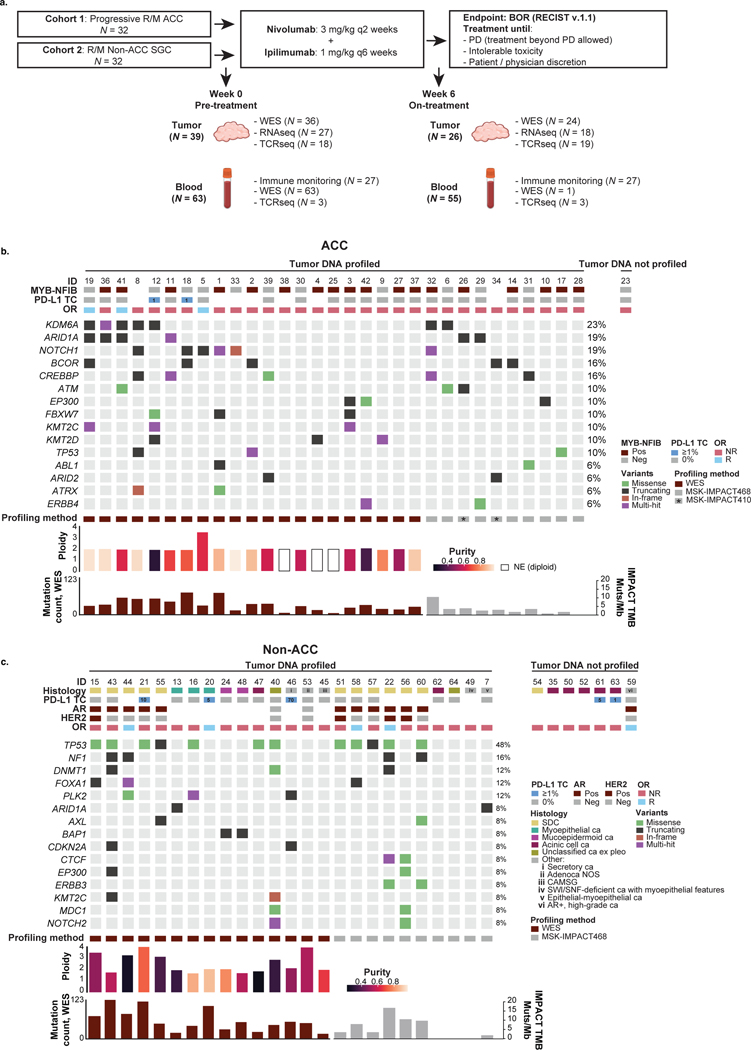
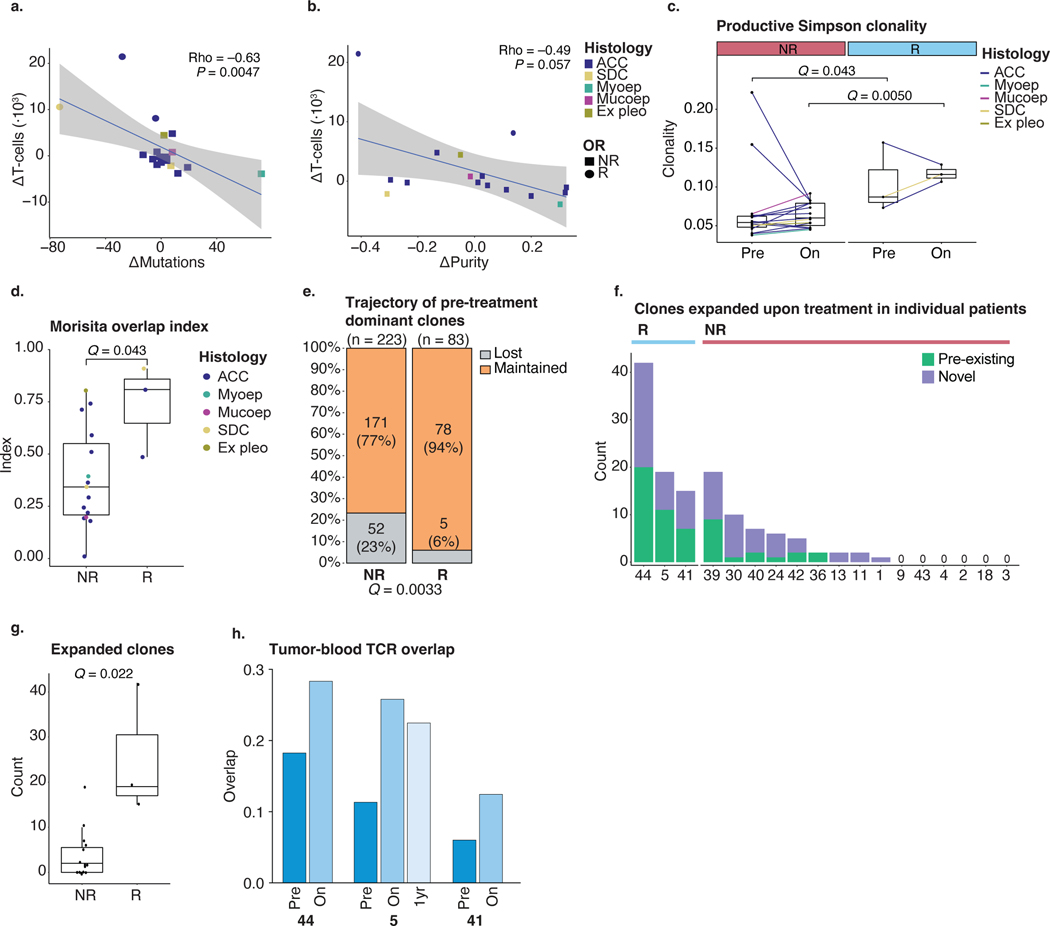
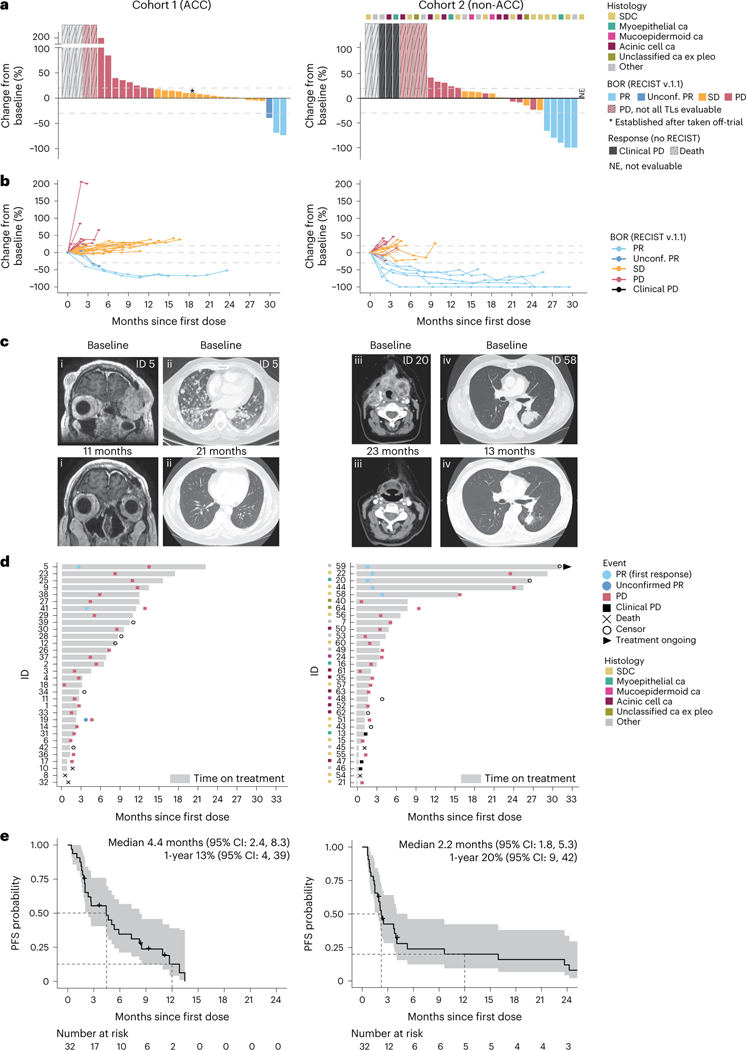
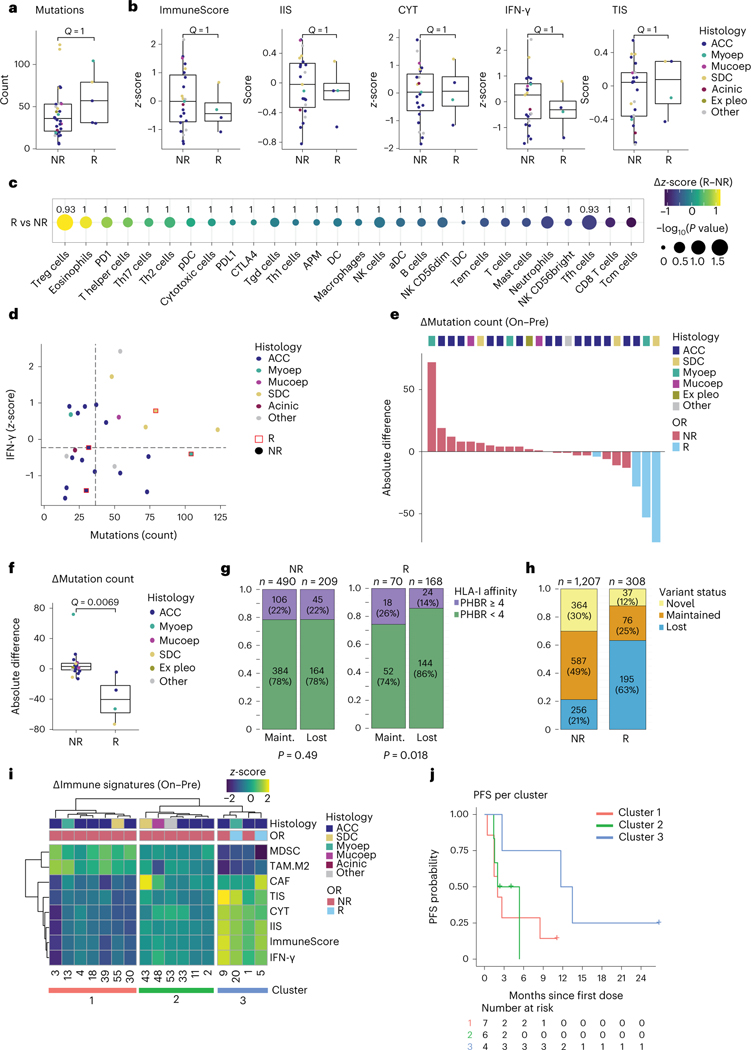
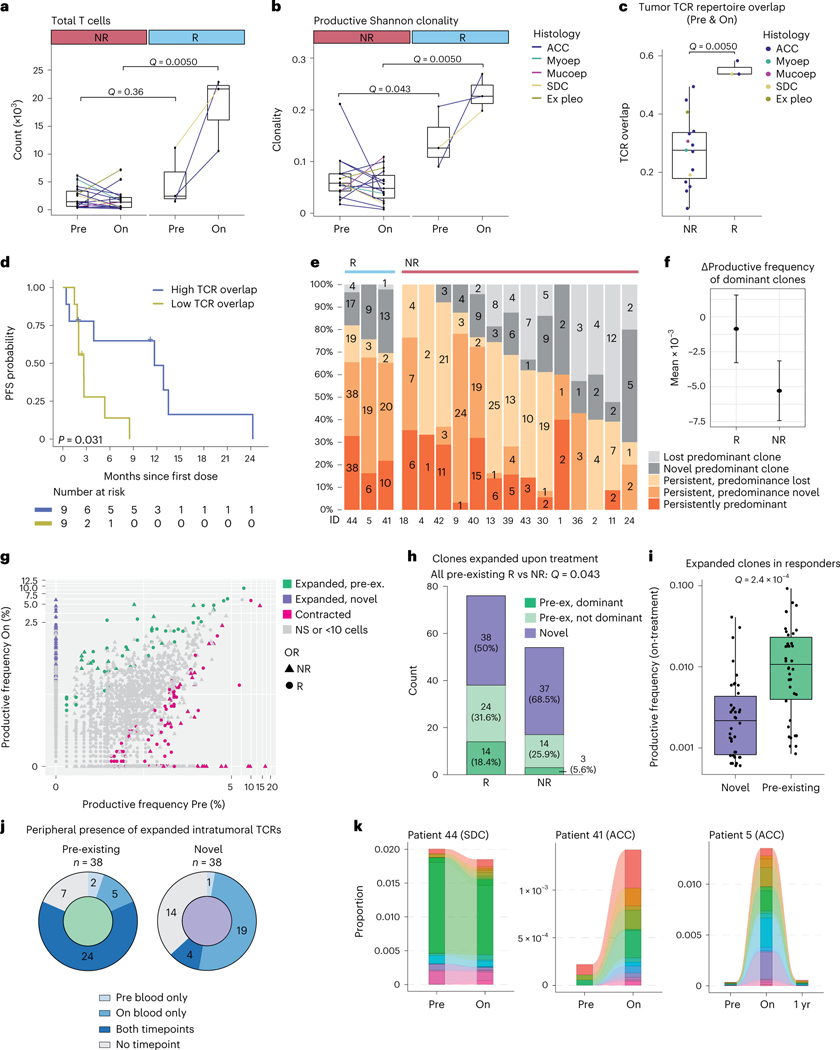
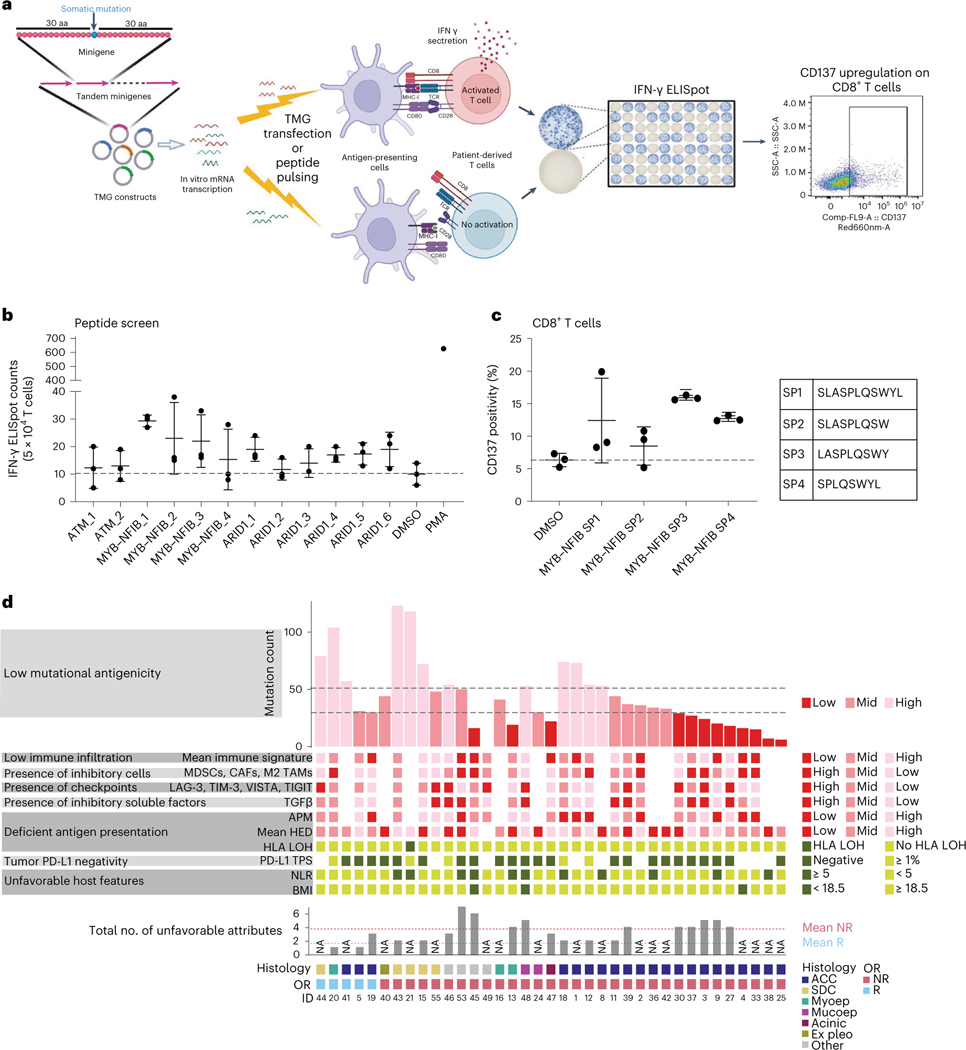
Salivary gland cancers (SGCs) are rare, aggressive cancers without effective treatments when metastasized. We conducted a phase 2 trial evaluating nivolumab (nivo, anti-PD-1) and ipilimumab (ipi, anti-CTLA-4) in 64 patients with metastatic SGC enrolled in two histology-based cohorts (32 patients each): adenoid cystic carcinoma (ACC; cohort 1) and other SGCs (cohort 2). The primary efficacy endpoint (≥4 objective responses) was met in cohort 2 (5/32, 16%) but not in cohort 1 (2/32, 6%). Treatment safety/tolerability and progression-free survival (PFS) were secondary endpoints. Treatment-related adverse events grade ≥3 occurred in 24 of 64 (38%) patients across both cohorts, and median PFS was 4.4 months (95% confidence interval (CI): 2.4, 8.3) and 2.2 months (95% CI: 1.8, 5.3) for cohorts 1 and 2, respectively. We present whole-exome, RNA and T cell receptor (TCR) sequencing data from pre-treatment and on-treatment tumors and immune cell flow cytometry and TCR sequencing from peripheral blood at serial timepoints. Responding tumors universally demonstrated clonal expansion of pre-existing T cells and mutational contraction. Responding ACCs harbored neoantigens, including fusion-derived neoepitopes, that induced T cell responses ex vivo. This study shows that nivo+ipi has limited efficacy in ACC, albeit with infrequent, exceptional responses, and that it could be promising for non-ACC SGCs, particularly salivary duct carcinomas. ClinicalTrials.gov identifier: NCT03172624 .


Conflict of interest statement

A.L.H. reports research funding for clinical trials from Allos Therapeutics, Astellas Pharma, AstraZeneca, Bayer, Ayala Pharmaceuticals, Bristol Myers Squibb, Genentech, Celldex Therapeutics, Daiichi Sankyo, Eisai., Elevar Therapeutics, Eli Lilly & Company, Genentech/Roche, Hoikpia, Kolltan Pharmaceuticals, Kura Oncology, Merck, Novartis, Pfizer, Poseida and Verastem; service in consulting/advisory roles for AffyImmune Therapeutics, AstraZeneca, Ayala Pharmaceuticals, Bristol Myers Squibb, Cellestia Biotech, Coherus, CureVac, Eisai, Elevar Therapeutics, Exelixis, Expert Conncet, Genzyme, InxMed, Kura Oncology, McGivney Global Advisors, Merck, Novartis, CureVac, Prelude Therapeutics, Regeneron, Rgenta, Remix Therapeutics, Sanofi, Sun Pharma, the Chemotherapy Foundation and TRM Oncology; service on speakers’ bureaus for Medscape, Omniprex America, Novartis and Physician Education Resource; and receipt of travel/accommodations expenses from Janssen Oncology, Merck, Kura Oncology, Ignyta, Ayala Pharmaceuticals and KLUS Pharma, outside the submitted work. A.L.H. is also inventor on a patent for the use of lesional dosimetry methods for tailoring targeted radiotherapy in cancer. L.G.T.M. is listed as an inventor on intellectual property held by MSK on using tumor mutation burden to predict immunotherapy response, with pending patent, which has been licensed to Personal Genome Diagnostics. T.A.C. reports, all outside the submitted work, being a co-founder of Gritstone Oncology and holding equity; holding equity in An2H and acknowledging grant funding from Bristol Myers Squibb, AstraZeneca, Illumina, Pfizer, An2H and Eisai; having served as an advisor for Bristol Myers, MedImmune, Squibb, Illumina, Eisai, AstraZeneca and An2H; andd being an inventor on intellectual property held by MSK on using tumor mutation burden to predict immunotherapy response, with pending patent, which has been licensed to Personal Genome Diagnostics. C.A.K. is a scientific co-founder and equity holder of Affini-T Therapeutics; is a compensated member of the scientific and/or clinical advisory boards for Achilles Therapeutics, Affini-T Therapeutics, Aleta BioTherapeutics, Bellicum Pharmaceuticals, Catamaran Bio, Obsidian Therapeutics and T-knife; has consulted for Bristol Myers Squibb, Decheng Capital, PACT Pharma and Roche/Genentech; and has patents broadly related to cell and gene therapy outside the scope of this work. N.R. reports research funding from ArcherDx and Repare Therapeutics and personal fees from Illumina, PaigeAI and Pfizer Canada, outside the submitted work. E.J.S. reports institutional research funding from Merck, outside the submitted work, and personal fees from Eli Lilly & Company, Blueprint Medicines Corporation, Regeneron Pharmaceuticals, Loxo Oncology and Eisai, outside the submitted work. L.A.D. reports research funding and personal fees from CUE-101, Eisai, CUE-101, Replimune Group and Regeneron Pharmaceuticals and service on an advisory board at Merck, outside the submitted work. V.T. reports holding stock in Infinity Pharmaceuticals, Bluebird Bio and Mersana Therapeutics. C.L.Z. is linked to investigator-initiated clinical trials in collaboration with Bristol Myers Squibb, outside the submitted work. D.G.P. reports grants from the National Institutes of Health (NIH) and the Philanthropy-Serra Fund; research support from Hookipa Pharma; and personal fees from Nykode and Hookipa Pharma, outside the submitted work. B.B. is an employee of AstraZeneca. Z.N. is an employee of PPD, part of Thermo Fisher Scientific. W.Y. is an employee of Eli Lilly & Company. V.M. is listed as an inventor on a patent assigned to MSK broadly related to determinants of cancer response to immunotherapy. J.L.V., S.J., C.W.R.F., F.K., C.Y.H., M.P., N.K., R.M.S., I.O., A.K., L.S.M., J.V.F., K.K.N., J.E. and S.H. declare no competing interests.

Figures

Extended Data Fig. 1 |
Extended Data Fig. 1 |. Schematic trial overview and the genomic landscapes of ACC and non-ACC SGCs.
In b and c, all 64 patients are shown. Patients are grouped per cohort and according to the molecular profile method used (WES or targeted next-generation sequencing (tNGS) with the MSK-IMPACT panel); non-ACC patients are further grouped by histologic subtype. Tracks for genes were limited to show only the genes included in the MSK-IMPACT468 panel (Supplementary Table 4). a. Trial overview flowchart. The numbers for WES, RNAseq, and TCRseq refer to the samples that were subject to these investigations and passed quality control. Cartoons representing tumor and blood samples were created using BioRender.com. b. From top to bottom: patient trial ID, MYB-NFIB fusion gene presence, percentage of tumor cells (TC) staining positive for PD-L1, objective response (OR), mutation status for the top 15 most frequently mutated genes, the molecular profiling method used for each sample, the WES-based (FACETS) ploidy and purity estimate, and number of mutations per exome (WES-based) or TMB score (tNGS-based). c. From top to bottom: patient trial ID, the histologic subtype per the WHO classification, PD-L1 %TC staining, androgen and HER2-receptor status (performed as part of routine clinical care; only on suspected salivary duct carcinomas), OR, status for the top 15 most frequently mutated genes, the molecular profiling method used for that sample, the FACETS-based ploidy and purity estimate, and number of mutations per exome (WES-based) or TMB score (tNGS-based). Pos, positive; Neg, negative; OR, objective response; R, response; NR, no response; NE, not evaluable; SDC, salivary duct carcinoma; ca, carcinoma; NOS, not otherwise specified; CAMSG, cribriform adenocarcinoma of the minor salivary gland; SWI/SNF, SWItch/Sucrose Non-Fermentable; ex pleo, ex pleomorphic adenoma; AR, androgen receptor; WES, whole-exome sequencing; tNGS, targeted next-generation sequencing.
Extended Data Fig. 2 |
Extended Data Fig. 2 |. Pre-treatment immunogenomic features of ACCs and non-ACC SGCs in the context of treatment (non-)response.
Box plots defined in Methods. Individual dot colors in a, b, df indicate SGC histology. A Kruskal-Wallis (a, b) or two-sided Wilcoxon rank-sum test (df) was used to calculate exact P-values. P-values in a, b, d were adjusted for multiplicity (Methods), yielding q-values. a. Non-synonymous mutation count per exome in ACC (n = 21), SDC (n = 5), and SGCs of other histologies (n = 10). b. Z-scores for the ESTIMATE T cell and immune infiltration score (TIS and IIS), ImmuneScore, Reactome interferon gamma (IFN-γ), and cytolytic activity (CYT) RNA signatures in ACC (n = 15), SDC (n = 4), and SGCs of other histologies (n = 8). c. Heatmap of the signatures shown in b. Top tracks represent sample histology and objective response of n = 27 samples. d. Values for the MDSC, M2 TAM, and CAF RNA signatures in NR (n = 23) and R tumor samples (n = 4). e. Mean evolutionary divergence of germline HLA (HED), obtained from healthy control WES data, in NR (n = 31) and R patients (n = 5). f. Peripheral blood neutrophil-to-lymphocyte ratio (NLR) in NR (n = 56) and R patients (n = 8).
Extended Data Fig. 3 |
Extended Data Fig. 3 |. On-treatment trajectories of the mutational and microenvironmental profiles of SGCs, in the context of treatment (non-) response.
Box plots defined in Methods. Dot colors in b, e indicate histology and two-sided Wilcoxon rank-sum tests were used to calculate exact P-values. Panel f shows linear models with regression lines flanked by 95% CIs. Spearman’s rho and two-tailed P-values are printed in f. P-values in b, e were multiplicity-adjusted (Methods), yielding q-values. a. Waterfall plot of the log2-fold change in mutation count from pre-treatment to on-treatment. Bar colors represent response. Top track shows histology. b. Log2-fold change in mutation count from pre-treatment to on-treatment in sample pairs for in R (n = 4) and NR patients (n = 20). c. Proportion of lost mutations with a variant allele frequency of ≥0.10, 0.08–0.09, 0.05–0.07, and <0.05. The denominator is the sum of variants that were lost upon treatment, in NR and R patients. Comparisons of proportions between NR and R patients are printed to the right of the plot; P-values were calculated using a χ2 test. d. Waterfall plot showing the absolute change in tumor purity from pre-treatment to on-treatment. Color indicates if the WES-based FACETS or RNAseq-based ESTIMATE tool was used. The order of samples in the plot is identical to the waterfall plot in a. Two samples are marked NA (no RNAseq and a diploid copy number precluding purity estimation from FACETS). e. Absolute change in tumor purity for sample pairs from pre- to on-treatment (see d) in R (n = 3) and NR patients (n = 19). f. Linear regression of the TCR-enumerated T cell count versus the ImmuneScore, IIS, CYT, IFN-γ, and TIS RNA signatures (n = 13 pre-treatment and n = 13 on-treatment combined). g. Heatmap of the change (on-treatment minus pre-treatment) in immune cell populations, checkpoints, and antigen presentation machinery (APM) RNA signatures. h. Correlation matrix of the change in immune-related RNA signatures. Circle color represents Spearman’s rho (also printed). All correlations were statistically significant (P < 0.05).
Extended Data Fig. 4 |
Extended Data Fig. 4 |. Additional T cell receptor sequencing data from pre-treatment and on-treatment tumors and peripheral blood.
Boxes are defined in Methods. Panels a and b show linear models with regression lines flanked by 95% CIs; Spearman’s rho and exact, two-tailed P-values are printed. In a and b, squares and circles represent NR and R samples, respectively. Dot colors in a, b, d, and line colors in c indicate SGC histology. P-values in c, d, and g were calculated using two-sided Wilcoxon rank-sum tests and adjusted for multiplicity (Methods), yielding q-values. a. Absolute change in mutation count per exome versus the absolute change in TCR-enumerated T cell count (n = 18). b. Absolute change in WES-based sample purity estimates versus the absolute change in TCR-enumerated T cell count (n = 16). c. Productive Simpson TCR repertoire clonality of pre-treatment and on-treatment R (n = 3) and NR (n = 15) samples. Lines connect a sample pair. d. Morisita-Horn similarity index between the pre-treatment and on-treatment TCR repertoires in R (n = 3) and NR (n = 15) patients. e. On-treatment trajectories of T-cell clonotypes considered predominant (top 1% of the productive frequency distribution in that sample) in pre-treatment tumors, for R (n = 3) and NR (n = 15) samples. Clones maintained upon treatment are shown in orange, lost clones in gray. P-value was calculated using a χ2-test and adjusted for multiplicity (Methods). f. Total number of TCR clones considered significantly expanded (see Fig. 3g,h) in individual patients. The fraction that is pre-existing or novel is indicated. Patients’ trial IDs are printed. g. Total number of expanded TCR clonotypes in responders (n = 3) and non-responders (n = 15). h. TCR repertoire overlap between the tumor and peripheral blood for three responding patients (44, 5, and 41) at pre-treatment and on-treatment. For patient 5 with an additional, 336 d blood sample available (‘1 yr’), the TCR overlap between the 336 d sample and the early on-treatment (week 6) tumor was calculated.
Extended Data Fig. 5 |
Extended Data Fig. 5 |. Peripheral blood immune monitoring using flow cytometry.
Gating strategy available in the Supplementary Information. Boxes are defined in the Methods. Line and dot colors indicate response. Two-tailed, exact P-values were calculated using a Wilcoxon signed rank (a, c) or rank sum test (b). Nominal P-values were adjusted for multiplicity (Methods). a. The percentage of peripheral CD8+ T cells expressing Ki-67 (left plot) or ICOS (right plot) at the pre-treatment and week 6 on-treatment time point for 27 ACC patients. b. Log2-fold change in Ki-67 (left plot) and ICOS (right plot) surface expression in peripheral CD8+PD1 and CD8+PD1+ T cells for 27 ACC patients. c. Box plots showing the percentage of peripheral CD8+Ki67+ T cells expressing immune checkpoints CTLA-4, LAG-3, PD-1, or TIM-3 at the pre-treatment and on-treatment time points for 27 ACC patients.
Extended Data Fig. 6 |
Extended Data Fig. 6 |. Extended data from the neoantigen identification experiments for patients 41 and 5.
Data in a and ce are representative of two independent experiments with either n = 3 (a, d) or n = 2 (c, e) technical replicates. In a and ce, the black horizontal bars indicate the mean of replicate experiments, and the dotted gray lines represent the mean of the negative control experiment. In a and d, the whiskers represent the standard deviation. a. Autologous T cells from patient 41 were co-cultured with a pool of HLA and individual TMG co-transfected COS-7 cells. T cell responses were measured by IFN-γ ELISpot assay. Untransfected COS-7 cells (no TMG) were co-cultured with T cells for background response determination. b. Representative flow cytometry plots showing CD137 upregulation on CD8+ T cells as an activation marker after restimulation with MYB-NFIB fusion breakpoint-derived short peptides (SP1–4). The DMSO-stimulated T cell response was used to estimate the background activity. Fluorescence minus one (FMO) control was used to set the gate for CD137 expression. c. Interferon-γ production from T cells in ELISpot assay after co-culture with autologous DCs electroporated with TMGs in patient 5. The negative control consisted of co-culture with DCs only. d. Repeat IFN-γ ELISpot from peripheral blood effector memory T cells (CD3+CD45RACCR7) in patient 5, after co-culture with autologous DCs electroporated with TMG constructs. The negative control consisted of co-culture with DCs only. e. IFN-γ ELISpot from patient 5’s peripheral blood T cells upon co-culture with autologous DCs pulsed with peptides translated from the variants from two SNV TMGs and one in-frame INDEL TMG. The negative control consisted of co-culture with DCs only.
Fig. 1 |
Fig. 1 |. Clinical outcomes for patients with advanced ACC (cohort 1, left) and patients with non-ACC SGC (cohort 2, right) treated with concurrent nivo+ipi.
a, Waterfall plots demonstrating the maximum change from baseline TL sum diameter (%ΔTL) for cohort 1 patients (n = 32) and cohort 2 patients (n = 31; one unevaluable patient was marked ‘NE’ but counted as a non-responder for primary endpoint). Thresholds for PD (+20%) and PR (–30%) are indicated. Bar colors represent BOR (RECIST version 1.1) (ref. 21). Five patients (light gray bars; three in cohort 1, two in cohort 2) who died before RECIST evaluation; three patients (all cohort 2, dark gray bars) with clinically evident PD but no evaluable imaging; and six patients (two in cohort 1, four in cohort 2) with RECIST-PD but undeterminable %ΔTL are visualized with a fictitious high value and diagonal stripes. One cohort 1 patient’s imaging was obtained off-trial but before the start of subsequent treatment (asterisk). Note the interruption of the y axis. Top row of squares marks tumor histology in cohort 2. b, Spaghetti plot visualizing the longitudinal %ΔTL for patients with one or more evaluable follow-up scan (27 in cohort 1, 22 in cohort 2). The thresholds for RECIST-PD (+20%), RECIST-PR (–30%) and the 0% horizontal are indicated. Line color represents BOR. c, Scans of one responding patient with ACC in cohort 1 (panels i and ii) and two unique responders in cohort 2 (iii (myoepithelial carcinoma) and iv (SDC)) obtained at baseline (top) and on-treatment (bottom). Depicted tumors show marked regressions upon treatment. Patient trial IDs are printed. The on-treatment image in panel ii was obtained while the patient was on study treatment beyond disease progression. d, Swimmer plot overview showing time on study treatment, first PR and PD events, censors (only in the absence of a PD event) and whether treatment is ongoing at data cutoff. Colors mark the histological subtype in cohort 2. e, PFS estimates for cohort 1 and cohort 2, calculated from start of study treatment. Dotted lines intersect curves at median and 1-year PFS (also printed). Shaded areas show 95% CI; crosses mark a censor. ca, carcinoma.
Fig. 2 |
Fig. 2 |. Pre-treatment and on-treatment immunogenomic profiles of SGCs in the context of treatment response.
a,b, Box plots are defined in Methods. Dot colors in a,b,d,f indicate tumor histology. Exact, nominal P values in a,b,f were calculated using two-sided Wilcoxon rank-sum tests. P values in a,b,c,f were adjusted for multiplicity (Methods), yielding q values. a, Pre-treatment mutations per exome in non-responding (NR, n = 31) and responding (R, n = 5) patients. b, Pre-treatment values of the ImmuneScore,, IIS, CYT, IFN-γ pathway and TIS RNA signatures in NR (n = 23) and R (n = 4) patients. c, Absolute difference in z-score (R minus NR, visualized by color gradient) between R (n = 4) and NR (n = 23) patients for 24 immune cell subsets, APM signature and individual PD-1, PD-L1 and CTLA-4 checkpoint gene expression,. Dot size represents the −log10 of the nominal P value, obtained through a two-sided Wilcoxon rank-sum test comparing R with NR. q values are printed. d, Expression of IFN-γ pathway genes plotted against mutation count (n = 26). Responding samples (squares; red outline) and non-responders (dots) are indicated. Median values (dotted lines) distinguish quarters. e, Waterfall plot representing samples’ absolute change in WES-based mutation count from pre-treatment to on-treatment. Bar color represents objective response. Top track shows tumor histology. f, Absolute change in mutation count for NR (n = 20) and R (n = 4) tumors. g, Fraction of pre-treatment mutations with a PHBR considered lower (<4, green) or higher (≥4, purple) among mutations lost or maintained upon treatment, in NR and R tumors. Non-productive variants were excluded. Proportions were compared using a χ2 test. P values are one-sided. h, Proportion of variants lost, maintained or novel (present on-treatment only) upon treatment, for NR and R samples. Denominator is the sum of unique variants in a sample pair, per patient, in each response group; maintained variants were counted once. i, Heat map visualizing change in MDSC, M2 TAM, CAF, TIS, CYT, IIS, ImmuneScore and IFN-γ immune RNA signatures (on-treatment minus pre-treatment). Top tracks represent tumor histology and objective response. j, PFS estimates for the three clusters obtained from the heat map in h. Acinic, acinic cell carcinoma; Ex pleo, carcinoma ex pleomorphic adenoma; OR, objective response; Maint., maintained; Mucoep, mucoepidermoid carcinoma; Myoep, myoepithelial carcinoma.
Fig. 3 |
Fig. 3 |. Pre-treatment and on-treatment tumor and peripheral blood TCR repertoire analyses.
ac, Box plots are defined in Methods. Lines connect paired pre-treatment and on-treatment samples in a,b. Line (a,b) and dot colors (c) indicate histology. Exact P values in ac,i were calculated using a two-sided Wilcoxon rank-sum test. Nominal P values in ac,gi were multiplicity adjusted (Methods), yielding q values. TCR-seq data were available for 18 patients (15 non-responders and three responders). a, Change in the TCR-seq-based T cell count upon treatment, per objective response. b, Change in the TCR repertoire Shannon clonality upon treatment, per objective response. c, Longitudinal TCR overlap, per objective response. d, PFS of patients with high/low TCR repertoire overlap (c), using the cohort median (0.30) as threshold. The P value was calculated using a log-rank test. e, Proportion of predominant T cell clones (Methods) considered persistent or novel upon treatment, per patient. Denominator is the sum of unique clones in a patient’s longitudinal samples—persistent clones were counted once. Colors represent persistence/replacement. Numbers refer to clonotype counts per bar section. f, Mean absolute change in productive frequency upon treatment for pre-treatment dominant clones, per objective response. Error bars represent 95% CI. g, Overlay plot of patients showing TCR clones’ productive frequency at pre-treatment versus on-treatment. Statistical testing was performed per patients’ sample pair. Colors highlight significantly contracting or expanding clones (Methods). Expanding clones are further colored based on their pre-treatment detection. Shapes indicate (non-)response. h, Proportion of clones considered significantly expanded (g), per objective response. Novel clonotypes are indicated in purple, pre-existing clones in green. Pre-existing clonotypes are separated based on dominance in pre-treatment tumors. Proportions of expanding clones that were pre-existing in responding and non-responding tumors were compared using a χ2 test. i, Productive frequencies of novel (n = 38) and pre-existing (n = 38) clonotypes from responsive tumors. j, Fraction of expanding clonotypes considered novel or pre-existing in responding tumors’ TME, identified in the blood at pre-treatment and/or on-treatment. k, Longitudinal productive frequencies of intratumorally expanding clones (g) in the blood of responders. Sample ‘1 yr’ was obtained 336 d after treatment start. Color legends are provided in Supplementary Fig. 4. Ex pleo, carcinoma ex pleomorphic adenoma; OR, objective response; Maint., maintained; Mucoep, mucoepidermoid carcinoma; Myoep, myoepithelial carcinoma; NS, not significant; pre-ex., pre-existing.
Fig. 4 |
Fig. 4 |. Neoantigen identification in responding patients with ACC and potential immune-evasion mechanisms in SGC.
a, Neoantigen identification workflow. Based on WES-called mutations, TMGs were constructed and electroporated into autologous DCs (patient 5) or co-transfected with the patient’s HLA (patient 41) into COS-7 cells as APCs. Autologous T cells from PBMCs were co-cultured with the TMG-electroporated APCs for primary screening and subsequently with APCs pulsed with peptides for exact neoantigen identification. T cell activation was measured by IFN-γ production in an ELISpot assay and CD137 upregulation by flow cytometry. This cartoon was created using BioRender. b,c, Data in b and c are representative of two independent experiments with n = 3 technical replicates. Horizontal bars and whiskers represent the mean and s.d., respectively, of triplicate experiments, and the gray dotted lines indicate the mean value in the negative control (DMSO). b, Autologous T cells expanded from PBMCs (patient 41) were co-cultured with autologous HLA-electroporated T2 cells, pulsed with 8-mer or 9-mer short peptides corresponding to the mutations in the listed genes. IFN-γ production (ELISpot) is shown. T2 pulsed with DMSO (no peptide) was the negative control. PMA-stimulated T cell response was the positive control. c, CD137 expression assessed by flow-cytometry at the end of MYBNFIB fusion peptide-specific T cell expansion, in patient 41. After two rounds of stimulation, T cells were restimulated with fusion breakpoint-derived short peptides (MYB–NFIB SP1–4). DMSO stimulation was the negative control. The percentage of CD137+CD8+ T cells is plotted per peptide. Peptide sequences are shown on the right. d, Exploratory overview of eight immune-evasion mechanisms in 37 patients (Methods). Bottom tracks show response and tumor histology. Dotted lines in the mutation count chart (top) represent the 1st and 2nd tertile thresholds. Darker color shades for the boxes or bars indicate a phenotype expected to be unfavorable for nivo+ipi response. Bottom bar chart shows the number of unfavorable attributes—if not all parameters were available, a sample is labeled ‘NA’. Dotted horizontal lines show the mean number of unfavorable attributes in R (blue) and NR (red) patients. aa, amino acids; Acinic, acinic cell carcinoma; Ex pleo, carcinoma ex pleomorphic adenoma; OR, objective response; Mucoep, mucoepidermoid carcinoma; Myoep, myoepithelial carcinoma.

References

    1. Speight PM & Barrett AW Salivary gland tumours. Oral. Dis 8, 229–240 (2002). - PubMed
    1. Bennett AK, Mills SE & Wick MR Salivary-type neoplasms of the breast and lung. Semin. Diagn. Pathol 20, 279–304 (2003). - PubMed
    1. WHO Classification of Head and Neck Tumours 4th edn (eds EI-Naggar AK, Chan JK, Grandis JR, Takata T. & Slootweg P) (IARC, 2017).
    1. Laurie SA, Ho AL, Fury MG, Sherman E. & Pfister DG Systemic therapy in the management of metastatic or locally recurrent adenoid cystic carcinoma of the salivary glands: a systematic review. Lancet Oncol. 12, 815–824 (2010). - PubMed
    1. Laurie SA & Licitra L. Systemic therapy in the palliative management of advanced salivary gland cancers. J. Clin. Oncol 24, 2673–2678 (2006). - PubMed

Publication types

MeSH terms

Associated data