. 2023 Aug 24;42(1):218.
doi: 10.1186/s13046-023-02799-7.

The circadian clock circuitry modulates leukemia initiating cell activity in T-cell acute lymphoblastic leukemia

Affiliations

The circadian clock circuitry modulates leukemia initiating cell activity in T-cell acute lymphoblastic leukemia

Emanuele Murgo et al. J Exp Clin Cancer Res. .

Abstract

Background: T-cell acute lymphoblastic leukemia (T-ALL) is an aggressive hematological malignancy, characterized by restricted cellular subsets with asymmetrically enriched leukemia initiating cell (LIC) activity. Nonetheless, it is still unclear which signaling programs promote LIC maintenance and progression.

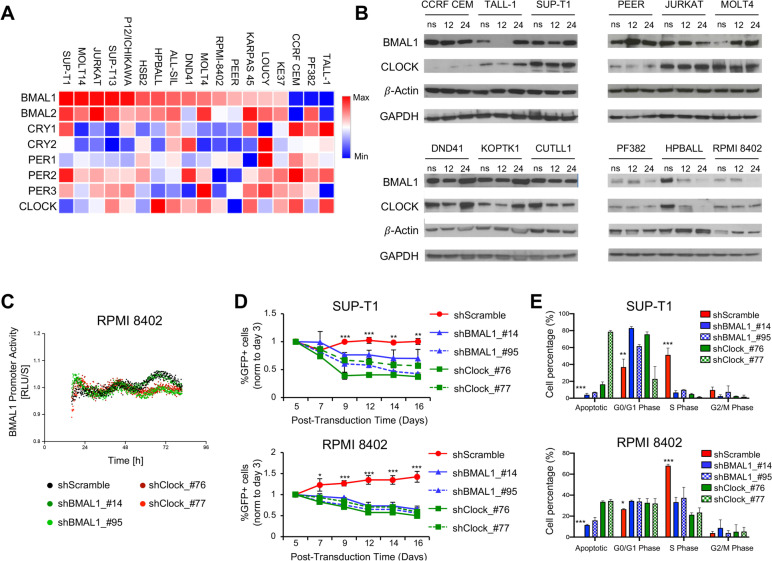
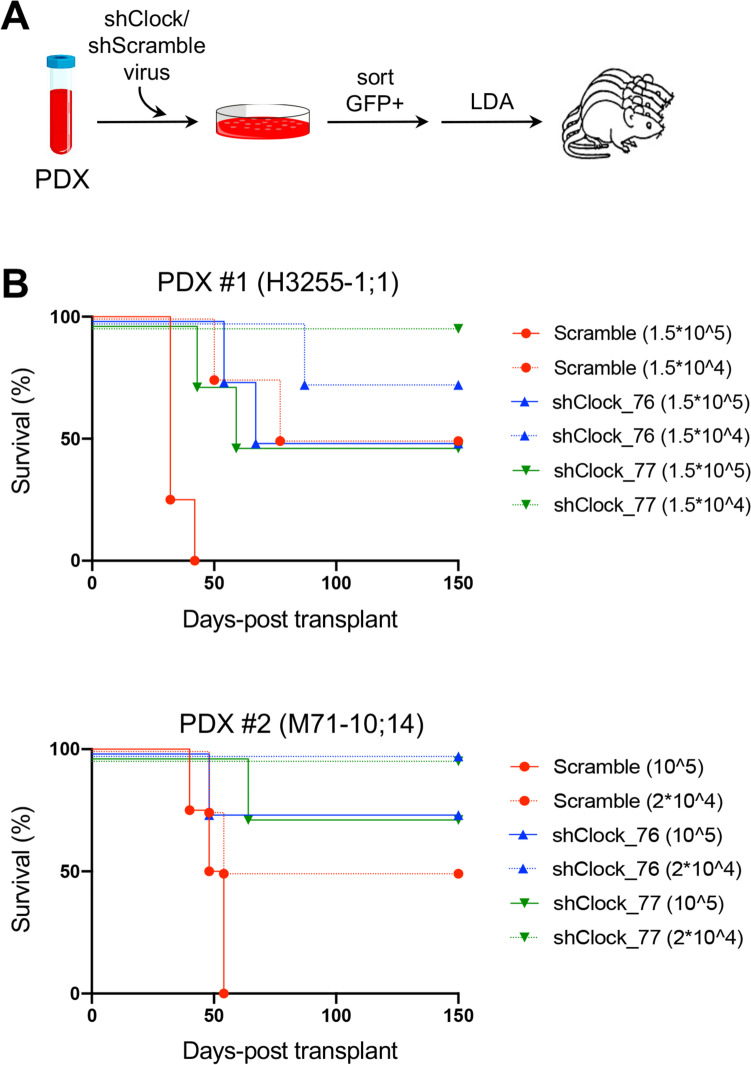
Methods: Here, we evaluated the role of the biological clock in the regulation of the molecular mechanisms and signaling pathways impacting the cellular dynamics in T-ALL through an integrated experimental approach including gene expression profiling of shRNA-modified T-ALL cell lines and Chromatin Immunoprecipitation Sequencing (ChIP-Seq) of leukemic cells. Patient-derived xenograft (PDXs) cell subsets were also genetically manipulated in order to assess the LIC activity modulated by the loss of biological clock in human T-ALL.

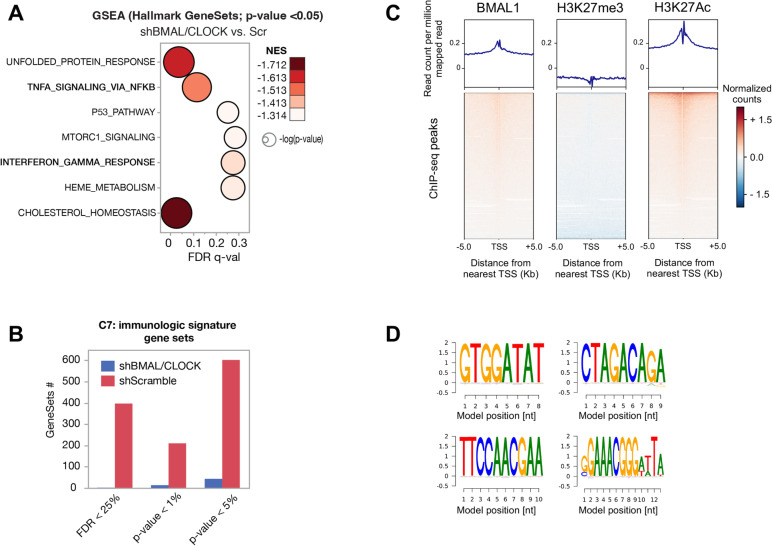
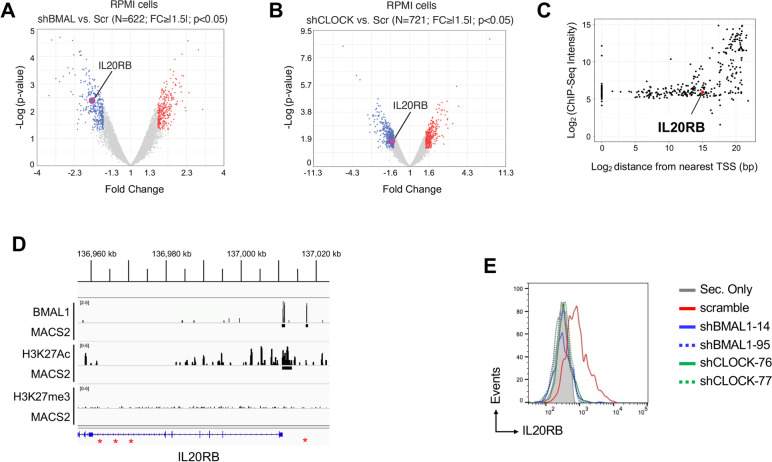
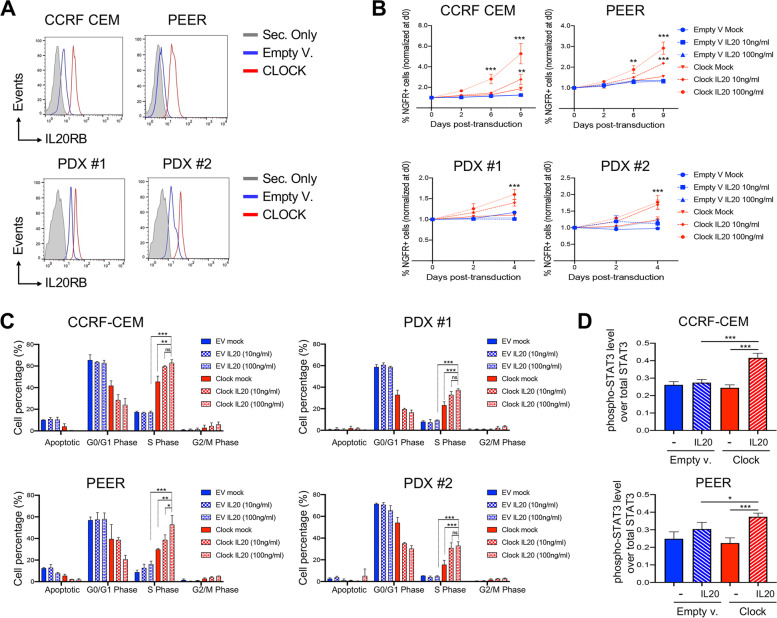
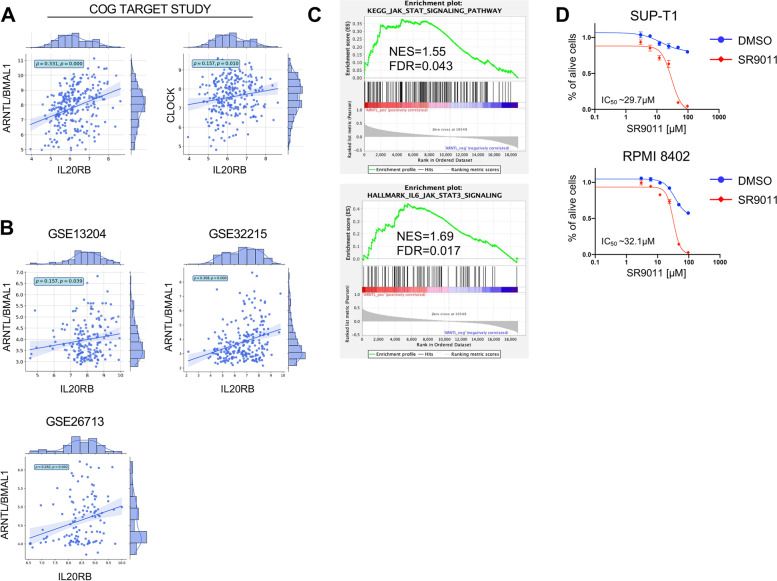
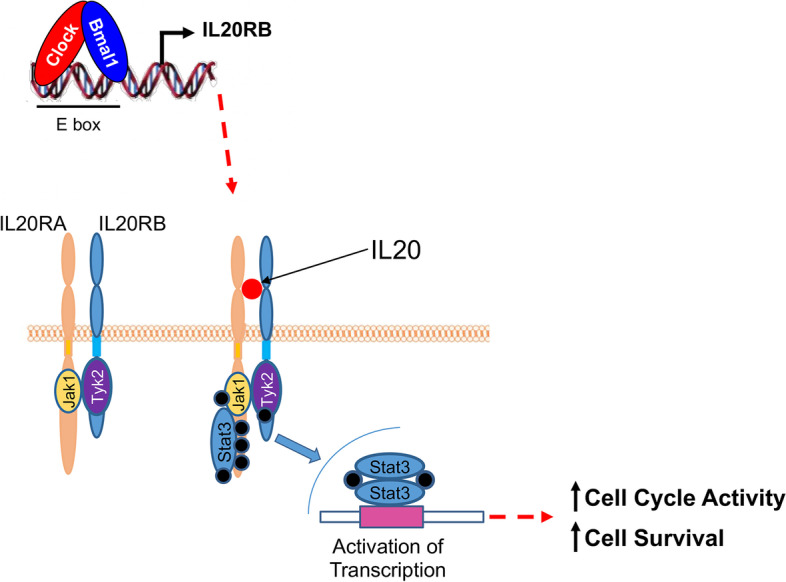
Results: We report that the disruption of the circadian clock circuitry obtained through shRNA-mediated knockdown of CLOCK and BMAL1 genes negatively impacted the growth in vitro as well as the activity in vivo of LIC derived from PDXs after transplantation into immunodeficient recipient mice. Additionally, gene expression data integrated with ChIP-Seq profiles of leukemic cells revealed that the circadian clock directly promotes the expression of genes, such as IL20RB, crucially involved in JAK/STAT signaling, making the T-ALL cells more responsive to Interleukin 20 (IL20).

Conclusion: Taken together, our data support the concept that the biological clock drives the expression of IL20R prompting JAK/STAT signaling and promoting LIC activity in T-ALL and suggest that the selective targeting of circadian components could be therapeutically relevant for the treatment of T-ALL patients.

Keywords: Biological clock; Circadian; Flow cytometry; IL20R; STAT3; T-ALL.


Conflict of interest statement

The authors declare no competing financial interests.

Figures

Fig. 1
Fig. 1
shRNA-mediated reduction of BMAL1 and CLOCK gene expression inhibits growth and cell proliferation in human T-ALL cell lines. A mRNA expression heatmap of eight core circadian clock genes in 18 T-ALL cell lines. Rlog values were calculated from RNA-seq data using DESeq2. Heatmap is scaled by gene (= row) with mean = 0 and SD = 1. Data are reanalyzed from the European Genome-phenome Archive (EGA) database under the accession code EGAS00001000536. B Western blot analysis of total BMAL1 and CLOCK in 12 human T-ALL cell lines. Whole cell lysates were generated from not synchronized (ns) cells and at 12 and 24 h after cell synchronization by culturing them in RPMI 1640 medium supplemented with 50% fetal bovine serum (FBS), sodium pyruvate (1 mM), L-Glutamine (2 mM) and antibiotics for two hours and then transferring them in the completed cell medium supplemented with 10% FBS. C Bioluminescence recordings of BMAL1 promoter activity in synchronized RPMI 8402 control and shRNA modified cell lines. D Abundance of shRNA-transduced GFP + cell fraction, tracked over time in culture by flow cytometry. SUP-T1 and RPMI-8402 cell lines were independently transduced with two different clones of shRNA/GFP lentiviral constructs against BMAL1 or CLOCK genes or scramble control as indicated, FACS sorted and in vitro cultured. GFP + alive cells were measured at the indicated time points by flow cytometry for DAPI exclusion. The graphs report the result of three independent experiments performed in triplicate. *, p < 0.05; **, p < 0.01; ***, p < 0.001 (Two-way ANOVA with Dunnett's test, comparing the sh-scramble control mean with the other values). E Proliferation of SUP-T1 and RPMI-8402 cell lines following transduction with shBMAL1 or shCLOCK constructs or scrambled shRNA control as measured after 7 days of in vitro growth by BrdU incorporation. Apoptotic cells and populations in G1/G0, S and G2/M phases are gated as shown. The results depicted are representative of two independent experiments. *, p < 0.05; **, p < 0.01; ***, p < 0.001 (Two-way ANOVA with Dunnett's test, comparing the sh-scramble control mean with the other values)
Fig. 2
Fig. 2
Patient-derived xenografts (PDXs) of T-ALL with reduced CLOCK expression have lower leukemia-initiating cell (LIC) frequency. A Schematic of transplantation experiments for limiting dilution analysis (LDA). PDX, Patient-derived xenograft. B Survival of recipient immunocompromised (NSG) mice after transplantation with FACS-sorted shCLOCK-transduced (GFP +) subsets from xenograft-expanded human leukemias. The cell doses injected in each of 4 recipient animals are indicated in parentheses. Two separate experiments are depicted using two independent PDX clones as indicated. The numbers of animals in each cohort and the raw data are available in Table S1
Fig. 3
Fig. 3
CLOCK and BMAL1 transcription factors promote the expression of genes involved in inflammatory pathways in T-ALL. A Bubble plot of the Hallmark GeneSets found negatively enriched in shBMAL1/CLOCK condition by Gene Set Enrichment Analysis (GSEA). Colors of the bubbles represent the magnitude of enrichment (NES, normalized enrichment score) and are as per the legend. Size of the bubbles represents the statistical significance of the enrichment (FDR, false-discovery-rate based on 1000 random permutation), i.e., the bigger the most significant and are as per the legend. Y-axes, Gene Sets. X-axes, FDR of enrichment significance. B Bar plots represent the number of immunological Gene Sets (C7) enriched in T-ALL cells in the different conditions as per the legend. X-axes, indicate the different statistical significance of the enriched Gene Sets. C Average plot (top) and heatmap (bottom) of ChIP-Seq reads for BMAL1, H3K27me3 and H3K27Ac around the transcriptional starting site (TSS) in RPMI-8402 cell line. Upper panels show the average profile ± 5 kb around the centered TSS. Lower panels show read density heatmaps around the detected peak centers. Scales indicate normalized counts in the ChIP-Seq signal. D Position Weighted Matrix (PWM) logo identified by the BAMM suite platform (https://bammmotif.soedinglab.org/seed_results/423b6b96-fc2c-4ae3-a248-c2ea4a8eed7c/). The DNA motifs in the analyzed ChIP-seq data include the most frequent sites for BMAL1 in RPMI-8402 cell line
Fig. 4
Fig. 4
Interleukin 20 receptor, beta subunit (IL20RB) is a direct target gene of the circadian clock machinery in T-ALL. A-B Volcano plot of differentially expressed genes in shBMAL1 or shCLOCK (D) vs. shScramble T-ALL cells. Red (up-)/Blue(down-regulated) dots represent statistically significant genes (q-value < 0.05). N, number of significantly differentially expressed genes. FC, fold change (cutoff, |1.5|). C Location of predicted BMAL1 sites relative to transcription start sites (TSS) and ChIP-seq signal intensity (ChIP-seq score in Log2). In the plot, each dot represents BMAL1 peaks within 1 Kb around the TSS. The ChIP-seq signal over IL20RB gene in the RPMI-8402 cells is highlighted in red. D ChIPseq tracks for BMAL1, H3K27me3 and H3K27Ac over the human IL20RB 5’ region in the RPMI-8402 cells. Peaks of aligned reads over the IL20RB locus are shown along with MACS2 peak calls (p-value ≤ 0.05). The active genomic regions are identified by the H3K27Ac histone mark. The canonical “E-box” binding site for CLOCK-BMAL1 in the IL20RB locus are highlighted in red. E Protein expression level of Interleukin 20 receptor (IL20R) by flow cytometric analysis in the SUP-T1 cells transduced with two different clones of shRNA/GFP lentiviral constructs against BMAL1 or CLOCK genes or scramble control as indicated and in vitro cultured for 7 days. GFP + alive cells were measured after seven days from the transduction and identified for DAPI exclusion by flow cytometry
Fig. 5
Fig. 5
CLOCK promotes cell proliferation in T-ALL cells through IL20R signaling. A Protein expression level of IL20RB by flow cytometry in CCRF-CEM and PEER cell lines and PDX models transduced with CLOCK or empty (EV) lentivectors with truncated human NGFR (tNGFR) selection marker. NGFR + alive cells were measured after three days from the transduction and identified for DAPI exclusion by flow cytometry. B Flow cytometry analysis of abundance of NGFR + alive cell fraction after transduction with CLOCK or empty (EV) lentivectors as reported in (A) and following treatments with IL20 at the indicated concentration (10 ng/ml and 100 ng/ml) or phosphate-buffered saline (PBS) as mock control. Transduced subsets of CCRF-CEM and PEER cell lines and PDX models were tracked over time at the indicated time points by flow cytometry. Alive NGRF + cells were discriminated for DAPI exclusion. Means ± SD fraction of the initial transduction value are plotted for experiments performed in triplicate. **, p < 0.01; ***, p < 0.001 (Two-way ANOVA with Dunnett's test, comparing the mean of CLOCK-transduced IL20-treated cells, with the other values). C Flow cytometric analysis of cell proliferation by BrdU incorporation in human CCRF-CEM and PEER cell lines and PDXs, following transduction with CLOCK or empty lentivectors as indicated. Transduced cells were treated with IL20 or mock control as reported in (B) and measured after three days of in vitro IL20 stimulation by flow cytometry. The graphs report the result of two independent experiments performed in triplicate. ns, not significant; **, p < 0.05; **, p < 0.01; ***, p < 0.001 (Student's t-test). D Protein expression level of total and phosphorylated proteins of STAT3 in CCRF-CEM and PEER cell lines transduced with CLOCK or empty lentivectors and following 72 h incubation with or without IL20 as indicated Each graph reports the ratio of mean fluorescence intensity (MFI) of phosphorylated protein over the MFI of total protein in two independent experiments. *, p < 0.05; **, p < 0.01; ***, p < 0.001 (Student's t-test)
Fig. 6
Fig. 6
Primary patient T-ALL samples with high ARNTL mRNA level have high gene expression of L20RB transcript ad well as genes related to JAK/STAT signaling pathway. A Correlation analysis for ARNTL/BMAL1 vs. IL20RB and CLOCK vs. IL20RB mRNA expression level (normalized rLog) among 264 T-ALL patients from the COG TARGET study [4]. Pearson correlation coefficient (ρ) and pValue (p) are also reported in the plot. B Correlation analysis for ARNTL/BMAL1 and IL20RB expression level (normalized with RMA (Robust Multiarray Averaging) Affymetrix microarray (HG-U133 Plus 2.0) data was downloaded from Gene Expression Omnibus (accessions GEO: GSE13204 (n = 174), GSE32215 (n = 228) and GSE26713 (n = 117)). Probe sets for ARNTL/BMAL1 and IL20RB were identified using a custom CDF file. Pearson correlation coefficient (ρ) and pValue (p) are also reported in the plot. C Gene set enrichment analysis (GSEA). The gene signature was derived from the differential expression analysis of RNA-seq data sets from the COG TARGET study [4]. All genes were ranked for the differential expression of ARNTL/BMAL1 gene in high vs. low T-ALL patients. NES, normalized enrichment score; FDR, false discovery rate. D Dose–response curve showing relative viability (y axis) of human SUP-T1 and RPMI-8402 cell lines treated in vitro with variable concentrations of SR9011 agonist of the nuclear hormone receptors Rev-Erbα and Rev-Erbβ and inhibitor of BMAL1 transcription (x axis) (n = 3). Viable cells were measured after 72 h of treatment with DMSO (mock) or SR9011 at the indicated concentrations by flow cytometry analysis for DRAQ7 exclusion. The graphs report the result of two independent experiments performed in duplicates (mean ± SD are plotted)
Fig. 7
Fig. 7
Schematic of the molecular mechanism involving the circadian clock machinery and the IL20R signaling pathways through the STAT mediators in the maintenance of leukemia initiating cell activity in T-ALL

Similar articles

Cited by

References

    1. Pui CH, Robison LL, Look AT. Acute lymphoblastic leukaemia. Lancet. 2008;371(9617):1030–1043. - PubMed
    1. Pui CH, Pei D, Campana D, Bowman WP, Sandlund JT, Kaste SC, et al. Improved prognosis for older adolescents with acute lymphoblastic leukemia. J Clin Oncol. 2011;29(4):386–391. - PMC - PubMed
    1. Brady SW, Roberts KG, Gu Z, Shi L, Pounds S, Pei D, et al. The genomic landscape of pediatric acute lymphoblastic leukemia. Nat Genet. 2022;54(9):1376–1389. - PMC - PubMed
    1. Liu Y, Easton J, Shao Y, Maciaszek J, Wang Z, Wilkinson MR, et al. The genomic landscape of pediatric and young adult T-lineage acute lymphoblastic leukemia. Nat Genet. 2017;49(8):1211–1218. - PMC - PubMed
    1. Cordo V, van der Zwet JCG, Cante-Barrett K, Pieters R, Meijerink JPP. T-cell acute lymphoblastic leukemia: a roadmap to targeted therapies. Blood Cancer Discov. 2021;2(1):19–31. - PMC - PubMed

Substances