

KRT18 regulates trophoblast cell migration and invasion which are essential for embryo implantation
- PMID: 37620903
- PMCID: PMC10464462
- DOI: 10.1186/s12958-023-01129-y
KRT18 regulates trophoblast cell migration and invasion which are essential for embryo implantation
Abstract
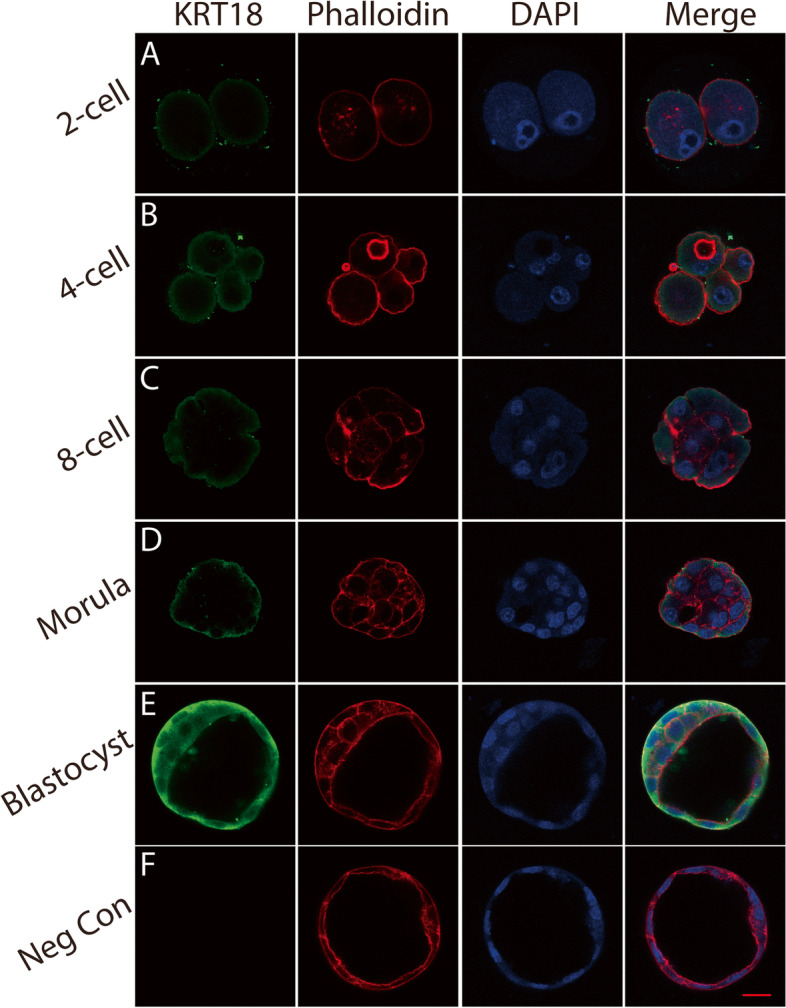
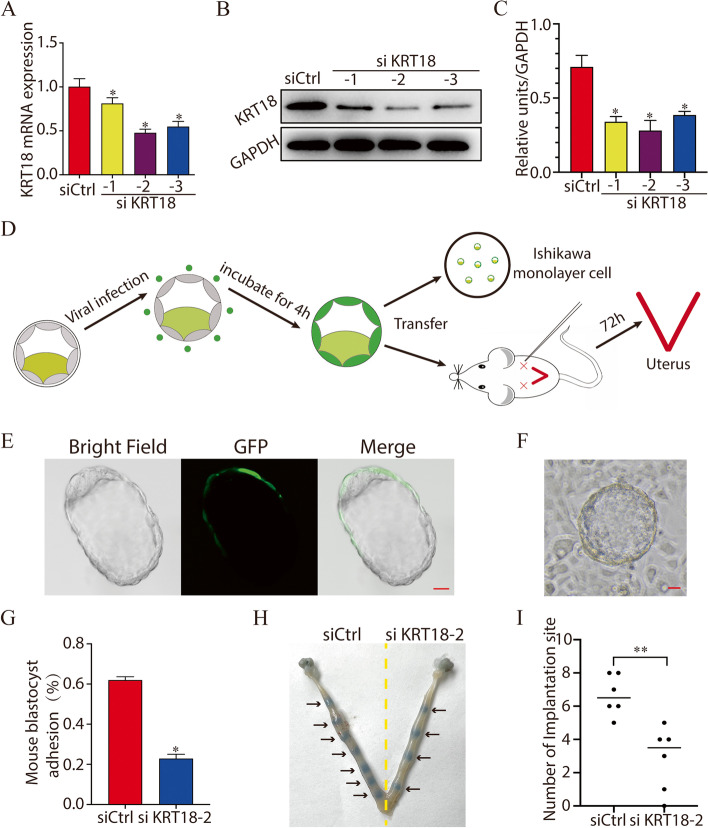
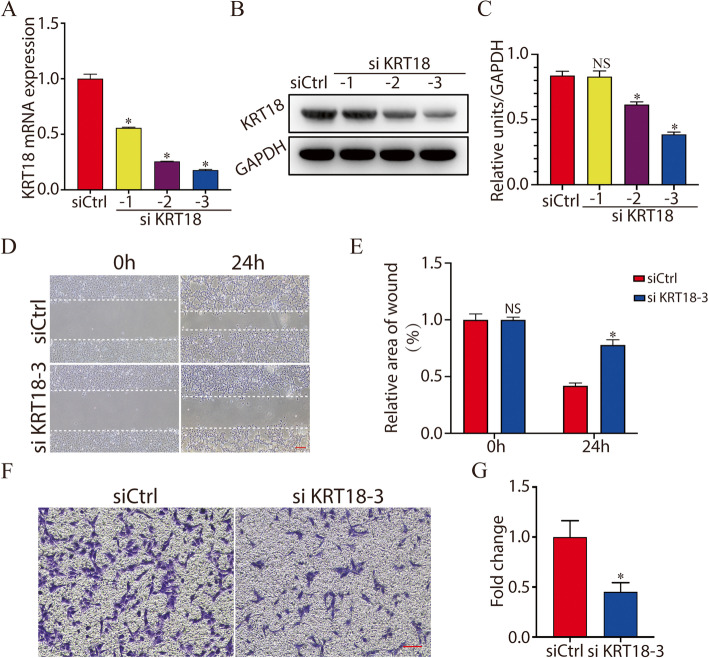
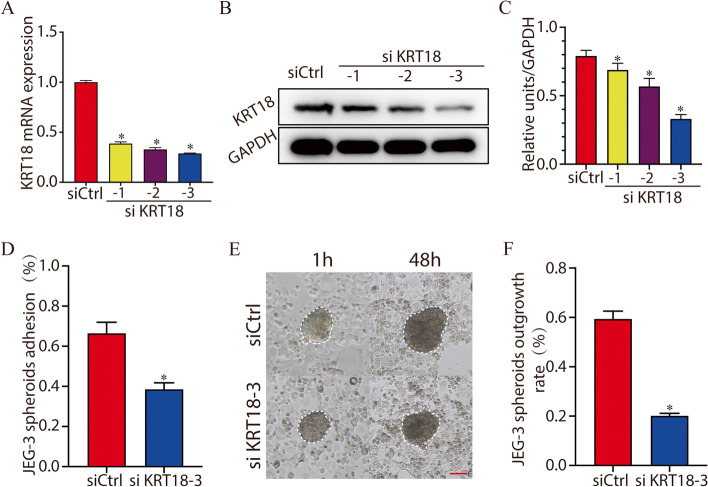
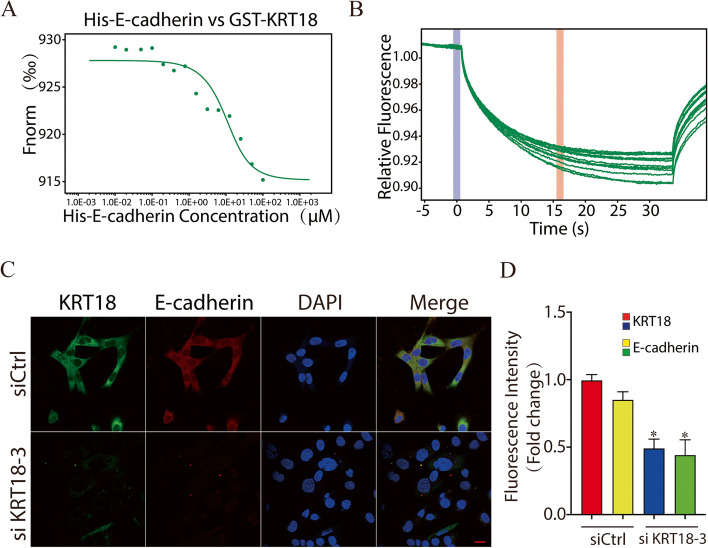
Female infertility is a worldwide concern that impacts the quality of life and well-being of affected couples. Failure of embryo implantation is a major cause of early pregnancy loss and is precisely regulated by a programmed molecular mechanism. Recent studies have shown that proper trophoblast adhesion and invasion are essential for embryo implantation. However, the potential regulatory mechanism involved in trophoblast adhesion and invasion has yet to be fully elucidated. KRT18 has been reported to play a critical role in early embryonic development, but its physiological function in embryo implantation remains unclear. In the present study, we revealed that KRT18 was highly expressed in trophoblast cells and that knockdown of KRT18 in mouse embryos inhibited embryo adhesion and implantation. In vitro experiments further showed that silencing KRT18 disturbed trophoblast migration and invasion. More importantly, we provide evidence that KRT18 directly binds to and stabilizes cell surface E-cadherin in trophoblast cells through microscale thermophoresis (MST) analysis and molecular biology experiments. In brief, our data reveal that KRT18, which is highly expressed in trophoblast cells, plays an important role in the regulation of trophoblast invasion and adhesion during embryo implantation by directly binding to E-cadherin.
Keywords: Cell invasion; Cell migration; E-cadherin; Embryo adhesion; Embryo implantation; KRT18.
© 2023. BioMed Central Ltd., part of Springer Nature.
Conflict of interest statement
The authors declare no competing interests.
Figures
Similar articles
-
Transgelin 2 is required for embryo implantation by promoting actin polymerization.FASEB J. 2019 Apr;33(4):5667-5675. doi: 10.1096/fj.201802158RRR. Epub 2019 Jan 31. FASEB J. 2019. PMID: 30702937
-
Up-regulation of alpha5-integrin by E-cadherin loss in hypoxia and its key role in the migration of extravillous trophoblast cells during early implantation.Endocrinology. 2009 Sep;150(9):4306-15. doi: 10.1210/en.2008-1662. Epub 2009 Jun 4. Endocrinology. 2009. PMID: 19497979
-
CX3CL1 and CCL14 regulate extracellular matrix and adhesion molecules in the trophoblast: potential roles in human embryo implantation.Biol Reprod. 2008 Jul;79(1):58-65. doi: 10.1095/biolreprod.107.066480. Epub 2008 Mar 26. Biol Reprod. 2008. PMID: 18367676
-
Expression pattern of different gap junction connexins is related to embryo implantation.Int J Dev Biol. 1996 Feb;40(1):361-7. Int J Dev Biol. 1996. PMID: 8735949 Review.
-
Evolutionary divergence of embryo implantation in primates.Philos Trans R Soc Lond B Biol Sci. 2022 Dec 5;377(1865):20210256. doi: 10.1098/rstb.2021.0256. Epub 2022 Oct 17. Philos Trans R Soc Lond B Biol Sci. 2022. PMID: 36252209 Free PMC article. Review.
Cited by
-
Effects of the gut microbiota on placental angiogenesis and intrauterine growth in gnotobiotic mice.Proc Natl Acad Sci U S A. 2025 Jul 29;122(30):e2426341122. doi: 10.1073/pnas.2426341122. Epub 2025 Jul 25. Proc Natl Acad Sci U S A. 2025. PMID: 40711921 Free PMC article.
-
Identification of functional non-coding variants associated with orofacial cleft.Nat Commun. 2025 Jul 16;16(1):6545. doi: 10.1038/s41467-025-61734-w. Nat Commun. 2025. PMID: 40670354 Free PMC article.
-
Modeling Early Stages of Trophectoderm-Endometrium Interactions Using Trophoblastic and Endometrial Organoids and the Generation of Lacunoids/Cystoids.Cells. 2025 Jul 9;14(14):1051. doi: 10.3390/cells14141051. Cells. 2025. PMID: 40710304 Free PMC article.
References
MeSH terms
Substances
Grants and funding
LinkOut - more resources
Full Text Sources
Molecular Biology Databases
Miscellaneous
