. 2023 Aug 24;21(1):569.
doi: 10.1186/s12967-023-04459-y.

Hyperoside protects against oxidative stress-mediated photoreceptor degeneration: therapeutic potentials for photoreceptor degenerative diseases

Affiliations

Hyperoside protects against oxidative stress-mediated photoreceptor degeneration: therapeutic potentials for photoreceptor degenerative diseases

Daijin Li et al. J Transl Med. .

Abstract

Background: Photoreceptor degeneration underpinned by oxidative stress-mediated mitochondrial dysfunction and cell death leads to progressive and irreversible vision impairment. Drug treatments that protect against photoreceptor degeneration are currently available in the clinical settings. It has been shown that hyperoside, a flavonol glycoside, protects against neuronal loss in part by suppressing oxidative stress and maintaining the functional integrity of mitochondria. However, whether hyperoside protects against photoreceptor degeneration remains unknown.

Methods: To address the pharmacological potentials of hyperoside against oxidative stress-mediated photoreceptor degeneration on molecular, cellular, structural and functional levels, multiple in vitro and in vivo methodologies were employed in the current study, including live-cell imaging, optical coherence tomography, electroretinography, histological/immunohistochemical examinations, transmission electron microscopy, RNA-sequencing and real-time qPCR.

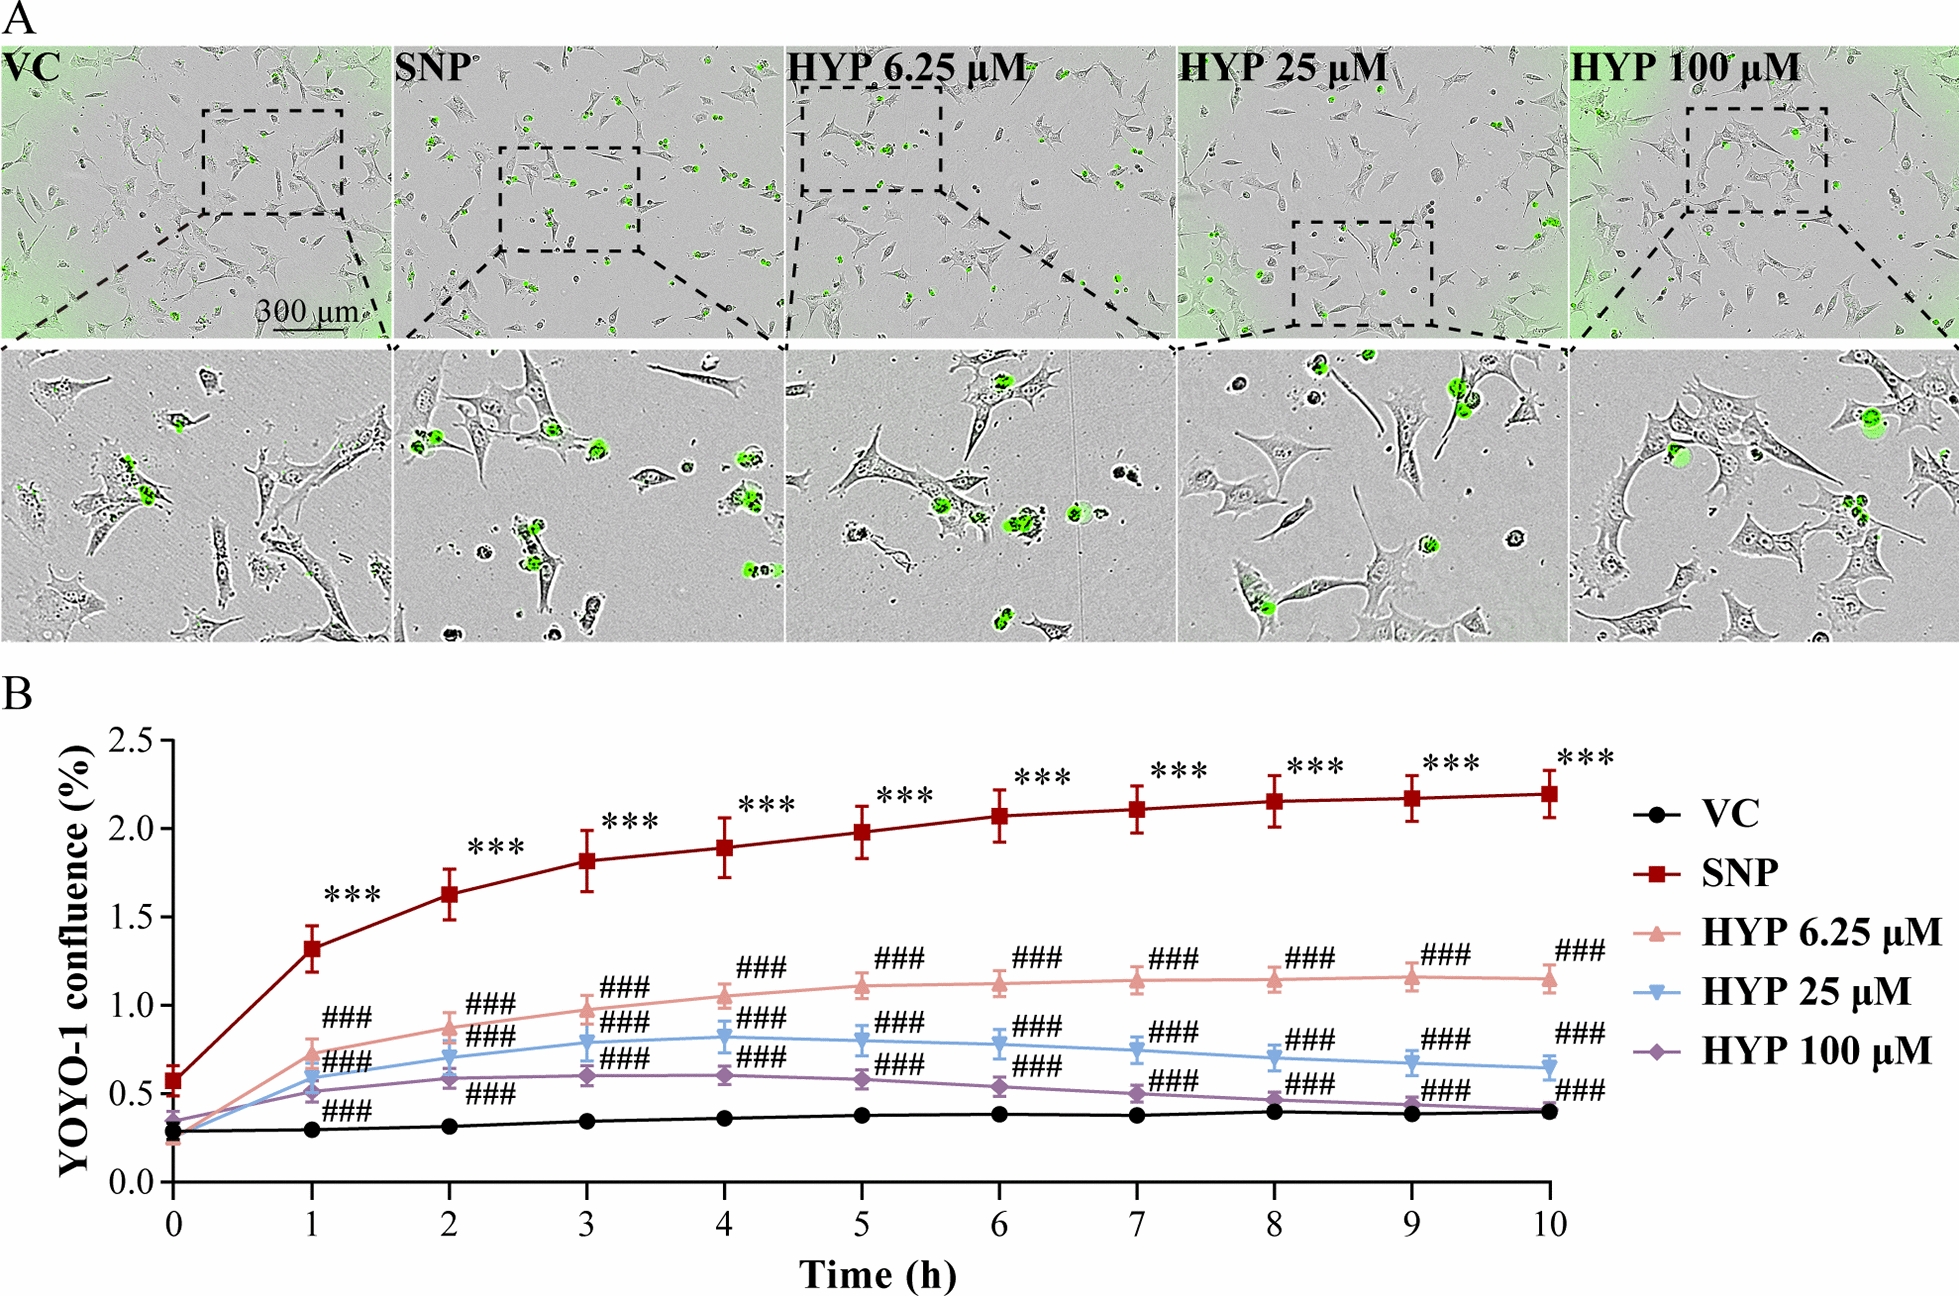
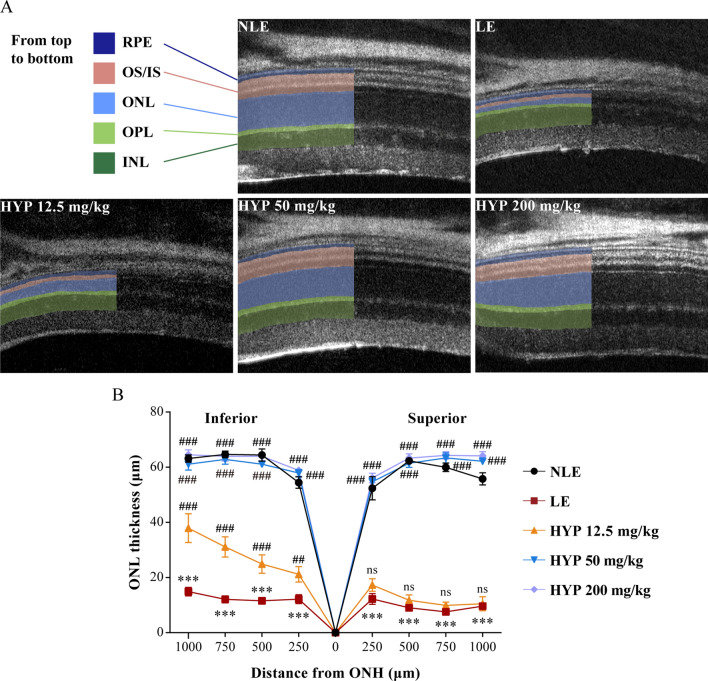
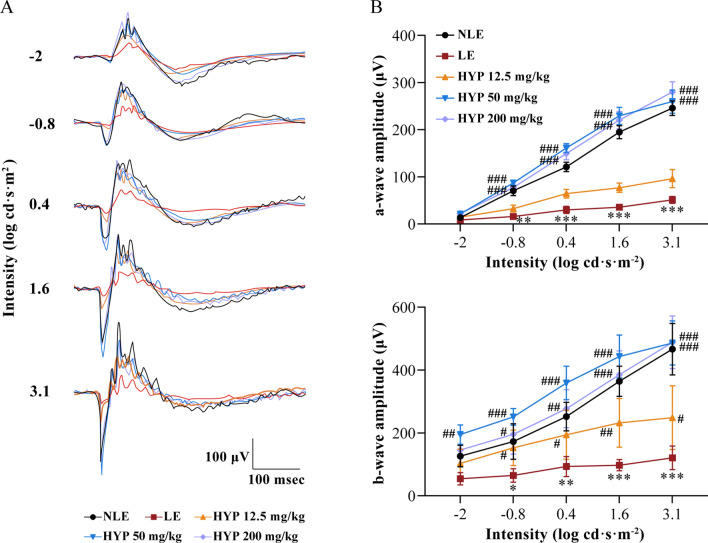
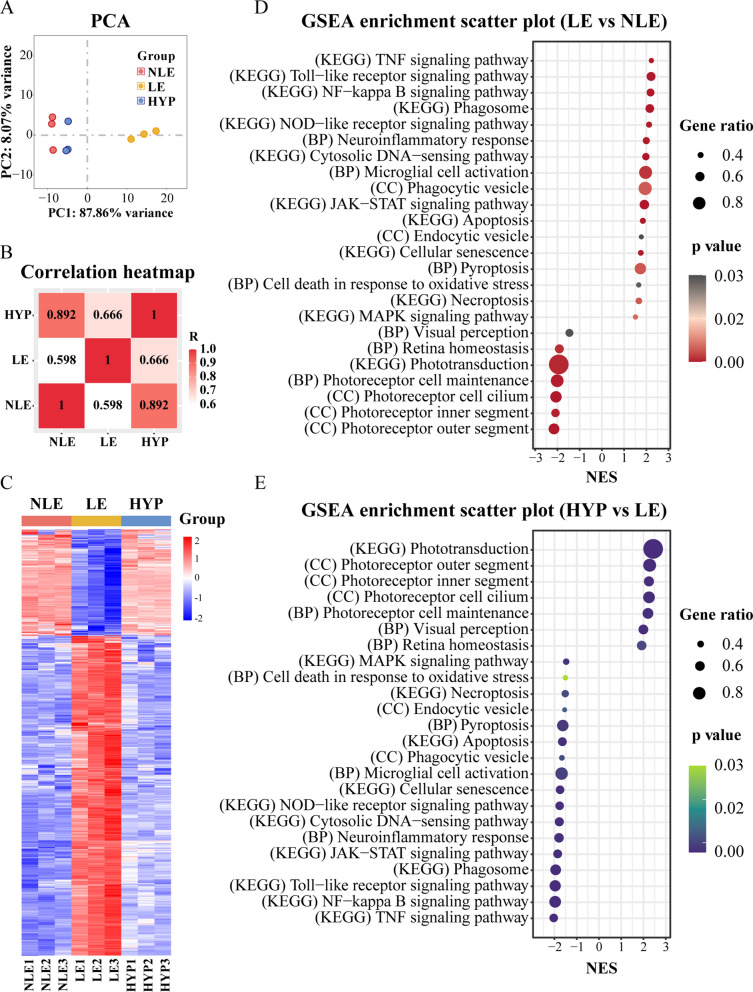
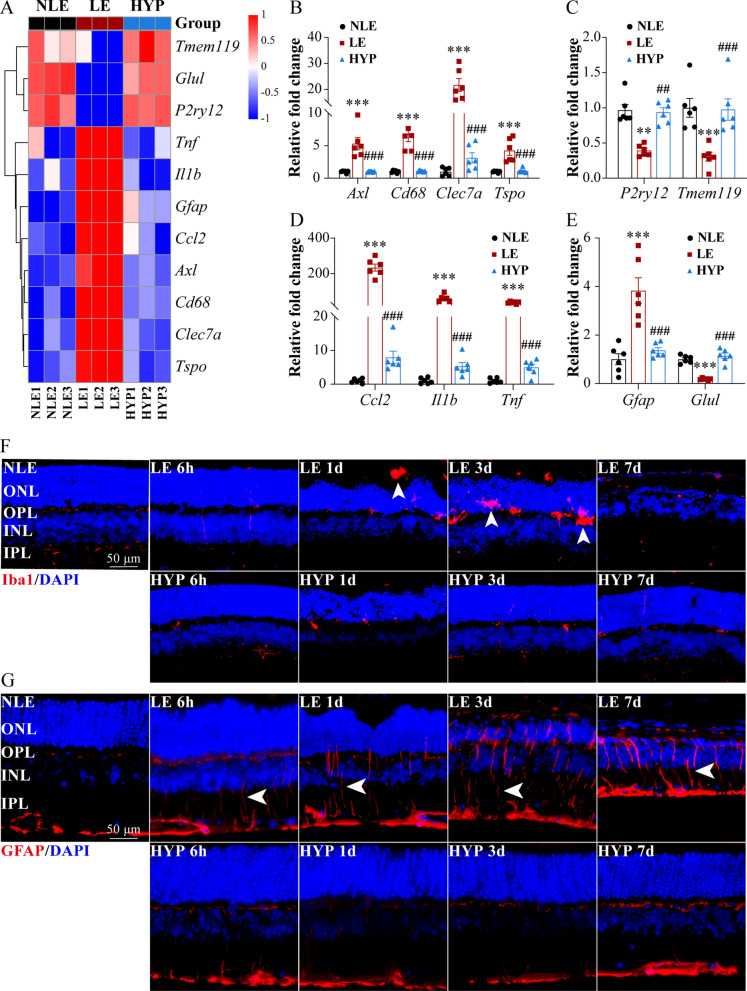
Results: The in vitro results demonstrate that hyperoside suppresses oxidative stress-mediated photoreceptor cell death in part by mitigating mitochondrial dysfunction. The in vivo results reveal that hyperoside protects against photooxidative stress-induced photoreceptor morphological, functional and ultrastructural degeneration. Meanwhile, hyperoside treatment offsets the deleterious impact of photooxidative stress on multiple molecular pathways implicated in the pathogenesis of photoreceptor degeneration. Lastly, hyperoside attenuates photoreceptor degeneration-associated microglial inflammatory activation and reactive Müller cell gliosis.

Conclusions: All things considered, the present study demonstrates for the first time that hyperoside attenuates oxidative stress-induced photoreceptor mitochondrial dysfunction and cell death. The photoreceptor-intrinsic protective effects of hyperoside are corroborated by hyperoside-conferred protection against photooxidative stress-mediated photoreceptor degeneration and perturbation in retinal homeostasis, warranting further evaluation of hyperoside as a photoreceptor protective agent for the treatment of related photoreceptor degenerative diseases.

Keywords: Cell death; Hyperoside; Oxidative stress; Photoreceptor degeneration; Retinal homeostasis.


Conflict of interest statement

The authors declare no competing interests.

Figures

Fig. 1
Fig. 1
Hyperoside inhibits SNP-induced photoreceptor cell death. 661W cells pretreated with vehicle or hyperoside at the indicated concentrations were incubated in the presence or absence of 300 μM SNP for 4 h. A YOYO-1 positivity (in green) recorded by Incucyte live cell analysis platform 10 h after the termination of SNP stimulation. Scale bar, 300 μm. B Quantification of YOYO-1 confluence at 1-h intervals using Incucyte Live-Cell Analysis System. Data were expressed as mean ± SEM. (n = 6 per group). ***Compared to VC, P < 0.001; ###compared to SNP, P < 0.001. VC, the vehicle-treated cells without SNP exposure; SNP, the SNP-stimulated vehicle-treated cells; HYP, the SNP-stimulated cells treated with hyperoside
Fig. 2
Fig. 2
Hyperoside protects against SNP-induced mitochondrial dysfunction in photoreceptor cells. 661W cells pretreated with vehicle or 100 μM hyperoside were incubated in the presence or absence of 300 μM SNP for 3 h. A The mitochondria probe JC-1 dye was applied, followed by microscopic imaging of J-aggregates (in red) and JC-1 monomers (in green) by fluorescence microscopy. DAPI (in blue) was counterstained to visualize the nuclei. Scale bar, 50 μm. B The relative fold change in the ratio of J-aggregates to JC-1 monomers was plotted against VC (n = 6 per group). C Representative microscopic image showing calcein positive fluorescent signals. Scale bar, 50 μm. D Relative fold change in the calcein positive fluorescence intensity was plotted against VC (n = 6 per group). E Representative microscopic images showing MitoSOX Red positive fluorescent signals. Scale bar, 50 μm. F Relative fold change in the MitoSOX Red positive fluorescence intensity was plotted against VC (n = 6 per group). Data were expressed as mean ± SEM. ***Compared to VC, P < 0.001; ##compared to SNP, P < 0.01; ###compared to SNP, P < 0.001. VC, the vehicle-treated cells without SNP exposure; SNP, the SNP-stimulated cells treated with vehicle; HYP, the SNP-stimulated cells treated with hyperoside
Fig. 3
Fig. 3
Hyperoside protects against light-induced photoreceptor morphological degeneration. A Representative OCT scans from the superior retinas. B The ONL thickness measured at 250, 500, 750 and 1000 μm from ONH in the inferior and superior retinas. Data were expressed as mean ± SEM (n = 6 per group). ***Compared to NLE, P < 0.001; ##compared to LE, P < 0.01, ###compared to LE, P < 0.001; ns, not significant. HYP-L the light-exposed mice treated with 12.5 mg/kg hyperoside, HYP-M the light-exposed mice treated with 50 mg/kg hyperoside, HYP-H the light-exposed mice treated with 200 mg/kg hyperoside, INL inner nuclear layer, IS inner segment, LE the light-exposed mice treated with vehicle, NLE the vehicle-treated mice without light exposure, ONH optic nerve head, ONL outer nuclear layer, OPL outer plexiform layer, OS outer segment, RPE retinal pigment epithelium
Fig. 4
Fig. 4
Hyperoside protects against light-induced decline of the retinal function. A Representative scotopic electroretinograms. B Amplitudes of a-wave and b-wave were plotted. Data were expressed as mean ± SD (n = 6 per group). *Compared to NLE, P < 0.05; **compared to NLE, P < 0.01; #compared to LE, P < 0.05; ##compared to LE, P < 0.01. HYP-L the light-exposed mice treated with 12.5 mg/kg hyperoside, HYP-M the light-exposed mice treated with 50 mg/kg hyperoside, HYP-H the light-exposed mice treated with 200 mg/kg hyperoside, LE the light-exposed mice treated with vehicle, NLE the vehicle-treated mice without light exposure
Fig. 5
Fig. 5
Hyperoside protects against light-induced impairment of photoreceptor morphological integrity. A Representative HE-stained microscopic images. Scale bar, 50 μm. B The number of photoreceptor nuclei was counted at 500 μm away from ONH in the superior retina. C Representative microscopic images showing the expression pattern of rhodopsin, M-opsin and S-opsin (in red) in the retina. DAPI (in blue) was counterstained to label the nuclei. White arrowheads indicated disordered, mislocalized or residual rhodopsin expression as well as mislocalized or absence of M-opsin and S-opsin expression. Scale bar, 50 μm. Data were expressed as mean ± SEM (n = 4 per group). ***Compared to NLE, P < 0.001; ###compared to LE, P < 0.001; ns, not significant. HYP the light-exposed mice treated with 50 mg/kg hyperoside, INL inner nuclear layer, IS inner segment, LE the light-exposed mice treated with vehicle, NLE the vehicle-treated mice without light exposure, ONL outer nuclear layer, OS outer segment
Fig. 6
Fig. 6
Hyperoside protects against light-induced photoreceptor ultrastructural impairment. A Representative TEM images of rod (pink) and cone (blue) photoreceptor OS, RPE and connecting cilium (green). Red arrowheads, disordered OS (first column); RPE phagosomes (second column); disrupted microvilli (third column); impaired connecting cilium (fourth column). Scale bars, 2 μm (first column); 1 μm (second, third and fourth column). B Representative TEM images of the IS and mitochondria in the IS (yellow). Red arrowhead, disrupted IS. Scale bars, 2 μm (first column) and 500 nm (second column). C Representative TEM images showing rod and cone photoreceptor nuclei. Red arrowheads, chromatin condensation (first column), damaged nuclear envelope (third column) and chromatin depolymerization (fifth column). Scale bars, 2 μm (first column), 1 μm (second and fourth column) and 200 nm (third column). D Representative TEM images highlighting photoreceptor synaptic terminals. Scale bar, 500 nm. Ad arciform density, Bc bipolar cell, Hc horizontal cell, HYP the light-exposed mice treated with 50 mg/kg hyperoside, IS inner segment, LE the light-exposed mice treated with vehicle, M mitochondria, N nucleus, NLE the vehicle-treated mice without light exposure, OS outer segment, Sr synapse ribbon, Sv synaptic vesicle
Fig. 7
Fig. 7
Hyperoside treatment counteracts light-induced alterations in the retinal gene expression. A PCA of RNA-seq data. B Correlation heatmap of DEGs. R, the Kendall correlation coefficient. C Heat map generated from hierarchical clustering analysis of the DEGs. D GSEA enrichment scatter plot (LE vs NLE). E GSEA enrichment scatter plot (HYP vs LE). NES normalized enrichment score, HYP the light-exposed mice treated with 50 mg/kg hyperoside, LE the light-exposed mice treated with vehicle, NLE the vehicle-treated mice without light exposure
Fig. 8
Fig. 8
Hyperoside attenuates light-induced dysregulation in the retinal expression of genes essential for photoreceptor morphological and functional integrity. A Heatmap visualization of the representative genes important for photoreceptor morphological and functional integrity revealed by RNA-seq analyses. BE Real-time qPCR validation of the expression of transcription factors essential for photoreceptor identity (B), the genes involved in photoreceptor homeostasis maintenance (C), the genes expressed in the photoreceptor IS, OS and synapses (D) and the genes important for phototransduction (E). Relative fold change was plotted against NLE. Data were expressed as mean ± SEM (n = 6 per group). **Compared to NLE, P < 0.01; ***compared to NLE, P < 0.001; #compared to LE, P < 0.05; ##compared to LE, P < 0.01; ###compared to LE, P < 0.001. HYP the light-exposed mice treated with 50 mg/kg hyperoside, LE the light-exposed mice treated with vehicle, NLE the vehicle-treated mice without light exposure
Fig. 9
Fig. 9
Hyperoside counteracts light-induced upregulation in the retinal expression of cell death regulators and mitigates photoreceptor cell death. A Heatmap visualization of the representative genes involved in programmed cell death revealed by RNA-seq analyses. B Real-time qPCR validation of the altered expression of the genes involved in apoptosis, necroptosis and pyroptosis. Relative fold change was plotted against NLE. Data were expressed as mean ± SEM (n = 6 per group). C TUNEL (in green) positivity in the retinas 3d post light exposure. DAPI (in blue) counterstaining marked the nuclei. Scale bar, 50 μm. D Relative fold change in the TUNEL positivity was plotted against LE. Data were expressed as mean ± SEM (n = 4 per group). **Compared to NLE, P < 0. 01; ***compared to NLE, P < 0.001; #compared to LE, P < 0.05; ##compared to LE, P < 0.01; ###compared to LE, P < 0.001. HYP the light-exposed mice treated with 50 mg/kg hyperoside, INL inner nuclear layer, LE the light-exposed mice treated with vehicle, NLE the vehicle-treated mice without light exposure, ONL outer nuclear layer
Fig. 10
Fig. 10
Hyperoside mitigates microglial inflammatory activation and Müller cell gliosis. A Heatmap visualization of the representative genes implicated in microglial inflammatory activation and Müller cell gliosis revealed by RNA-seq analyses. BE Real-time qPCR analysis validation of the genes associated with disease-associated microglial activation phenotypes (B) and microglial homeostasis (C), inflammatory responses (D) and Müller gliosis (E). Relative fold change was normalized against NLE. F Iba1 immunopositivity (in red) in the retina. DAPI (in blue) was counterstained to label the nuclei. White arrowheads indicated activated microglia in the outer retina. Scale bar, 50 μm. G GFAP immunopositivity (in red) in the retina. DAPI (in blue) was counterstained to label the nuclei. White arrowheads indicated aberrant GFAP expression indicative of reactive gliosis. Scale bar, 50 μm. Data were expressed as mean ± SEM (n = 6 per group). **Compared to NLE, P < 0.01; ***compared to NLE, P < 0.001; ##compared to LE, P < 0.01; ###compared to LE, P < 0.001. HYP the light-exposed mice treated with 50 mg/kg hyperoside, INL inner nuclear layer, IPL inner plexiform layer, LE the light-exposed mice treated with vehicle, NLE the vehicle-treated mice without light exposure, ONL outer nuclear layer, OPL outer plexiform layer

Similar articles

Cited by

References

    1. Hussey KA, Hadyniak SE, Johnston RJ., Jr Patterning and development of photoreceptors in the human retina. Front Cell Dev Biol. 2022;10:878350. doi: 10.3389/fcell.2022.878350. - DOI - PMC - PubMed
    1. Wright AF, Chakarova CF, Abd El-Aziz MM, Bhattacharya SS. Photoreceptor degeneration: genetic and mechanistic dissection of a complex trait. Nat Rev Genet. 2010;11:273–284. doi: 10.1038/nrg2717. - DOI - PubMed
    1. Pardue MT, Allen RS. Neuroprotective strategies for retinal disease. Prog Retin Eye Res. 2018;65:50–76. doi: 10.1016/j.preteyeres.2018.02.002. - DOI - PMC - PubMed
    1. Moos WH, Faller DV, Glavas IP, Harpp DN, Kamperi N, Kanara I, Kodukula K, Mavrakis AN, Pernokas J, Pernokas M, et al. Treatment and prevention of pathological mitochondrial dysfunction in retinal degeneration and in photoreceptor injury. Biochem Pharmacol. 2022;203:115168. doi: 10.1016/j.bcp.2022.115168. - DOI - PubMed
    1. Vlachantoni D, Bramall AN, Murphy MP, Taylor RW, Shu X, Tulloch B, Van Veen T, Turnbull DM, McInnes RR, Wright AF. Evidence of severe mitochondrial oxidative stress and a protective effect of low oxygen in mouse models of inherited photoreceptor degeneration. Hum Mol Genet. 2011;20:322–335. doi: 10.1093/hmg/ddq467. - DOI - PubMed

Publication types

LinkOut - more resources