. 2023 Aug 25;12(1):40.
doi: 10.1186/s40035-023-00372-y.

α-Synuclein-carrying astrocytic extracellular vesicles in Parkinson pathogenesis and diagnosis

Affiliations

α-Synuclein-carrying astrocytic extracellular vesicles in Parkinson pathogenesis and diagnosis

Pan Wang et al. Transl Neurodegener. .

Abstract

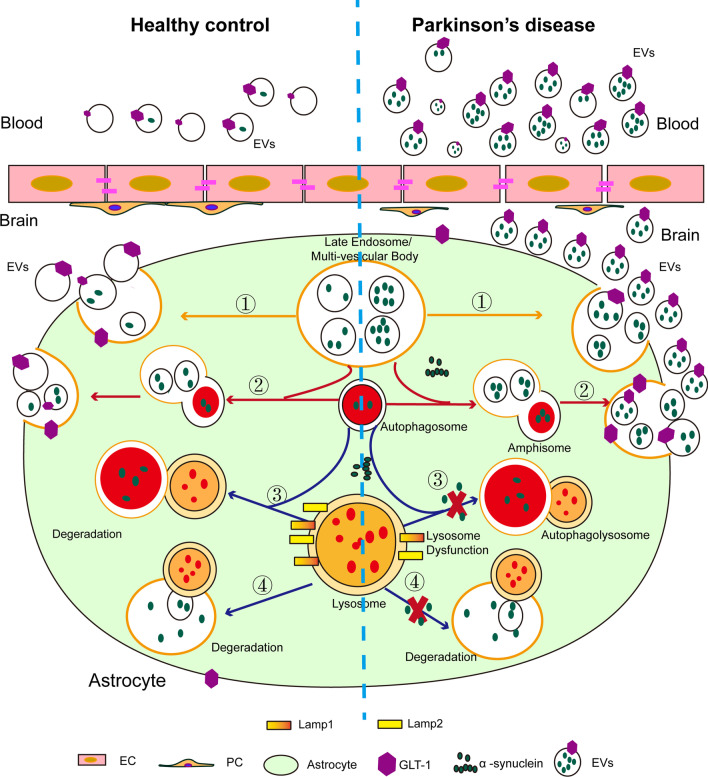
Background: The accumulation of α-synuclein (α-syn), an essential step in PD development and progression, is observed not only in neurons but also in glia, including astrocytes. The mechanisms regulating astrocytic α-syn level and aggregation remain unclear. More recently, it has been demonstrated that a part of α-syn spreading occurs through extracellular vesicles (EVs), although it is unknown whether this process is involved in astrocytes of PD. It is known, however, that EVs derived from the central nervous system exist in the blood and are extensively explored as biomarkers for PD and other neurodegenerative disorders.

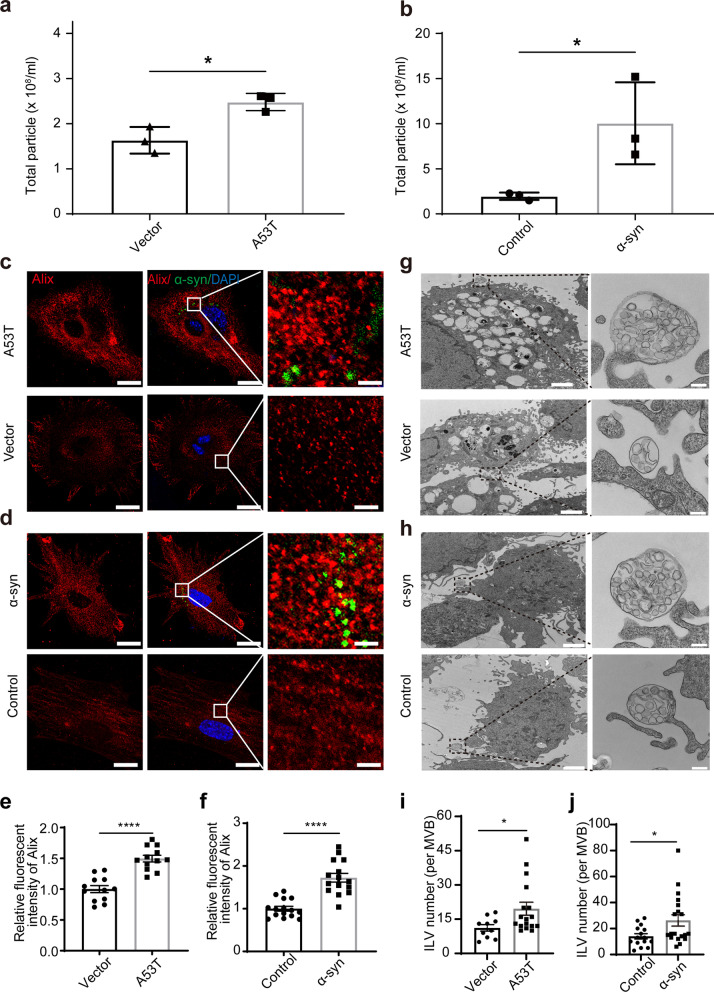
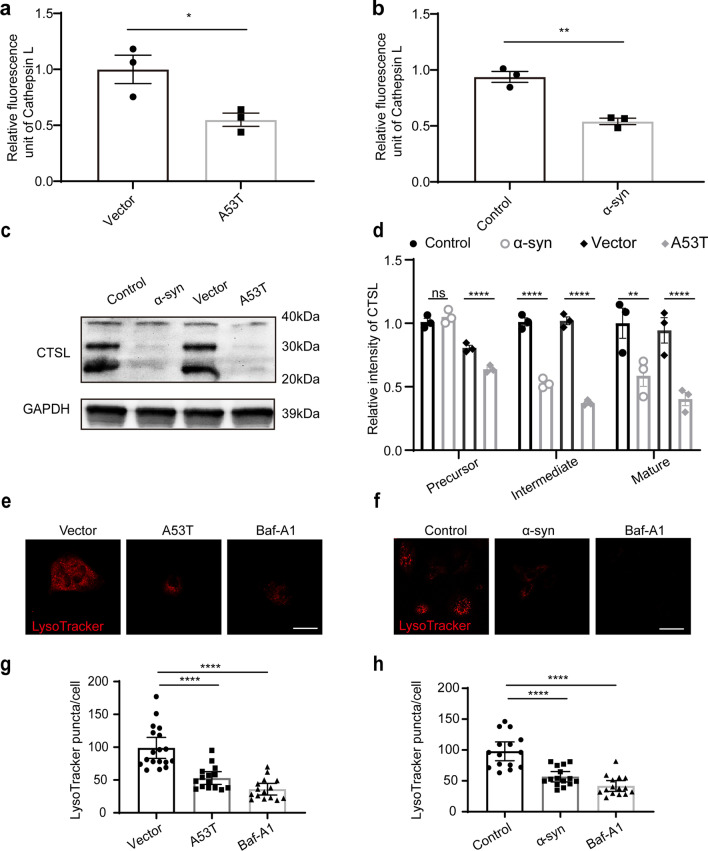
Methods: Primary astrocytes were transfected with A53T α-syn plasmid or exposed to α-syn aggregates. The level of astrocyte-derived EVs (AEVs) was assessed by nanoparticle tracking analysis and immunofluorescence. The lysosomal function was evaluated by Cathepsin assays, immunofluorescence for levels of Lamp1 and Lamp2, and LysoTracker Red staining. The Apogee assays were optimized to measure the GLT-1+ AEVs in clinical cohorts of 106 PD, 47 multiple system atrophy (MSA), and 103 healthy control (HC) to test the potential of plasma AEVs as a biomarker to differentiate PD from other forms of parkinsonism.

Results: The number of AEVs significantly increased in primary astrocytes with α-syn deposition. The mechanism of increased AEVs was partially attributed to lysosomal dysfunction. The number of α-syn-carrying AEVs was significantly higher in patients with PD than in HC and MSA. The integrative model combining AEVs with total and aggregated α-syn exhibited efficient diagnostic power in differentiating PD from HC with an AUC of 0.915, and from MSA with an AUC of 0.877.

Conclusions: Pathological α-syn deposition could increase the astrocytic secretion of EVs, possibly through α-syn-induced lysosomal dysfunction. The α-syn-containing AEVs in the peripheral blood may be an effective biomarker for clinical diagnosis or differential diagnosis of PD.

Keywords: Astrocyte; Extracellular vesicle; Lysosomal dysfunction; Parkinson’s disease; α-Synuclein.


Conflict of interest statement

The authors declare that they have no competing interests.

Figures

Fig. 1
Fig. 1
Increased release of astrocytic EVs induced by pathological α-syn in astrocytes. a, b The total number of EVs secreted from primary astrocytes overexpressing A53T α-syn or with exposure to aggregated α-syn for 24 h. N = 3 independent repeats. c, d Representative fluorescence images of primary astrocytes overexpressing A53T α-syn (c) or with exposure to aggregated α-syn (d) stained with Alix (red), α-syn (green) and nuclei (DAPI, blue). Scale bars, 20 μm for the left images and 2 μm for the right amplification images. e, f Quantification of the relative fluorescent intensity of Alix in primary astrocytes overexpressing A53T α-syn (e) or with exposure to aggregated α-syn (f). N = 10–15 astrocytes from 3 independent experimental repeats. g, h Representative TEM images of ILVs in MVBs of primary astrocytes overexpressing A53T α-syn (g) or with exposure to aggregated α-syn (h). Scale bars, 2 μm for the left images and 200 nm for the right amplification images. i, j Quantification of the number of ILVs in MVBs in primary astrocytes overexpressing A53T α-syn (i) or with exposure to aggregated α-syn (j). N = 10–15 astrocytes from 3 independent experimental repeats. Values are means ± S.E.M., unpaired t-test. *P < 0.05; ****P < 0.001
Fig. 2
Fig. 2
Altered astrocytic EV secretion can be partially attributed to lysosomal dysfunction. a, b Relative fluorescence unit of Cathepsin L (CTSL) in primary astrocytes overexpressing A53T α-syn or with exposure to α-syn aggregates. c The protein level of CTSL in astrocytes detected by western blotting. d Quantification of the protein levels of CTSL (including the precursor, intermediate, and mature forms) in astrocytes overexpressing A53T α-syn or with exposure to α-syn aggregates. N = 3 independent repeats. e, f Representative images of LysoTracker Red in astrocytes with overexpression of A53T α-syn (e) or α-syn aggregate exposure (f). g, h Quantification of the number of LysoTracker Red in astrocytes with overexpression of A53T α-syn (g) or α-syn aggregate exposure (h). N = 15–18 astrocytes from 3 independent experimental repeats. The astrocytes treated with 100 nM Baf-A1 were used as a positive control. Scale bars, 20 μm. Values are means ± S.E.M., unpaired t-test. *P < 0.05; **P < 0.01; ****P < 0.001
Fig. 3
Fig. 3
The levels of lysosome-associated membrane proteins decreased in astrocytes with pathological α-syn stimulation. ad Representative fluorescence images of Lamp1 (red), α-syn (green), and nuclei (DAPI, blue) in astrocytes with overexpression of A53T α-syn or α-syn aggregate exposure. Scale bars, 20 μm. eh Representative fluorescence images of Lamp2 (red), α-syn (green) and nuclei (DAPI, blue) in astrocytes with overexpression of A53T α-syn or α-syn aggregate exposure. Scale bars, 3 μm. i, j Quantification of the relative fluorescent intensity of Lamp1 in astrocytes with overexpression of A53T α-syn (i) or aggregated α-syn exposure (j). N = 10 astrocytes from 3 independent repeats. k, l Quantification of the relative fluorescent intensity of Lamp2 in astrocytes with overexpression of A53T α-syn (k) or aggregated α-syn exposure (l). N = 10 astrocytes from 3 independent repeats. Values are means ± S.E.M., unpaired t-test. *P < 0.05; **P < 0.01; ****P < 0.001
Fig. 4
Fig. 4
Increased autophagy in astrocytes with pathological α-syn stimulation. a Representative fluorescence images of LC3 (red) and nuclei (DAPI, blue) in astrocytes with overexpression of A53T α-syn. b Quantification of the LC3 particle number in astrocytes with overexpression of A53T α-syn. N = 12–16 astrocytes from 3 independent experimental repeats. c, d Western blots of LC3 in the astrocytes with overexpression of A53T α-syn and quantifications. N = 3 independent experimental repeats. e Representative fluorescence images of LC3 (red) and nuclei (DAPI, blue) in astrocytes treated with α-syn aggregates. f Quantification of the LC3 particle numbers in the astrocytes treated with α-syn aggregates. N = 12–16 astrocytes from 3 independent experimental repeats. g, h Western blots of LC3 in astrocytes treated with α-syn aggregates and quantifications. i, j Western blots of SQSTM1/p62 in the astrocytes with overexpression of A53T α-syn or treated with α-syn aggregates, and quantifications. N = 3 independent repeats. Values are means ± S.E.M., one-way ANOVA followed by a Tukey’s post-hoc test. *P < 0.05; **P < 0.01; ****P < 0.001
Fig. 5
Fig. 5
Characterization and quantification of GLT-1+ EVs in human plasma. a Representative western blot images showing the levels of Alix, CD9, GFAP and GLT-1 in the EVs immune-enriched by the normal mouse IgG or the anti-GLT-1 antibody from human plasma, in human raw plasma and mouse brain homogenates. b A representative TEM image showing GLT-1 protein on the surface of EVs immune-enriched by the anti-GLT-1 antibody from human plasma. Scale bar, 100 nm. c The number of EVs immune-enriched from human plasma by the anti-GLT-1 antibody, the GLAST antibody, or the normal mouse IgG antibody. N = 3 independent repeats. d The general size and distribution of isolated GLT-1+ EVs analyzed by NTA. e MSD analysis of the level of α-syn in the EVs immune-enriched from human plasma by the GLT-1 antibody, the GLAST antibody, or the normal mouse IgG antibody. N = 3 independent repeats. f MSD analysis of the level of α-syn in the EVs immune-enriched by the GLT-1 antibody from normal human plasma, EV-poor plasma, and plasma pre-captured by GLAST. N = 3 independent repeats. Values are means ± S.E.M., one-way ANOVA followed by a Tukey’s post-hoc test. ***P < 0.005
Fig. 6
Fig. 6
Development of a flow cytometry-based assay for astrocyte-derived EVs. a–c Representative histograms showing the populations of EVs positive for GLT-1, fluorophore-conjugated IgG isotype control, a blank (fluorophore only, no antibody) control experiment, and plasma with depletion of EVs positive for GLT-1 by ultracentrifugation. b Representative histograms showing the populations of EVs positive for SYN211, fluorophore-conjugated IgG isotype control, the blank control experiment, and plasma with depletion of EVs positive for SYN211 by ultracentrifugation. c Representative histograms showing the populations of EVs positive for MJFR14, fluorophore-conjugated IgG isotype control, the blank control experiment, and plasma with depletion of EVs positive for MJFR14 by ultracentrifugation. d–f Quantification data of positive EVs detected by the flow cytometry-based assay demonstrating the specificity of EV assays. gi Linearity in different dilutions of EV plasma samples. jl Stability of reference plasma (three replicates run each day on three separate days of the experiment for GLT-1, SYN211, and MJFR14)
Fig. 7
Fig. 7
Flow cytometric analysis of astrocyte-derived EVs in the clinical cohort. a The number of GLT-1+ EVs was significantly higher in PD than in MSA or HC. b The number of SYN211+ EVs was significantly higher in PD than in MSA or HC. c The number of MJFR14+ EVs was significantly higher in PD than in HC. d The number of GLT-1+/SYN211+ EVs was significantly higher in PD than in MSA or HC. e The number of GLT-1+/ MJFR14+ EVs was significantly higher in PD and MSA than in HC. N = 32 in MSA group and 34 in PD group. f ROC curves showing the separation of PD from HC using EVs carrying GLT-1, α-syn, and α-syn aggregates. g ROC curves showing separation of PD from MSA using EVs carrying GLT-1, α-syn, and α-syn aggregates. h An integrative model including all EV markers distinguishes PD from HC. i An integrative model including all EV markers distinguishes PD from MSA. N = 103 in the HC group, 106 in the PD group, and 47 in the MSA group. Values are means ± S.E.M., one-way ANOVA followed by a Tukey’s post-hoc test. *P < 0.05; **P < 0.01; ***P < 0.005
Fig. 8
Fig. 8
A schematic image showing α-syn-carrying astrocyte-derived EVs (AEVs) in Parkinson’s disease (PD) versus in healthy control. Pathological α-syn deposition could increase EV secretion by astrocytes, possibly through α-syn-induced lysosomal dysfunction. The α-syn-containing AEVs in peripheral blood may be an effective biomarker for clinical diagnosis or differential diagnosis of PD

References

    1. Balestrino R, Schapira AHV. Parkinson disease. Eur J Neurol. 2020;27(1):27–42. doi: 10.1111/ene.14108. - DOI - PubMed
    1. Niu X, Cheng Y, Hu W, Fan Z, Zhang W, Shao B, et al. Application of bulbocavernosus reflex combined with anal sphincter electromyography in the diagnosis of MSA and PD. Int J Neurosci. 2020:1–6. - PubMed
    1. Xia C, Postuma RB. Diagnosing multiple system atrophy at the prodromal stage. Clin Auton Res. 2020;30(3):197–205. doi: 10.1007/s10286-020-00682-5. - DOI - PubMed
    1. Palma JA, Norcliffe-Kaufmann L, Kaufmann H. Diagnosis of multiple system atrophy. Auton Neurosci. 2018;211:15–25. doi: 10.1016/j.autneu.2017.10.007. - DOI - PMC - PubMed
    1. Fanciulli A, Wenning GK. Multiple-system atrophy. N Engl J Med. 2015;372(3):249–263. doi: 10.1056/NEJMra1311488. - DOI - PubMed

Publication types

Substances