

Toward Automatic Inference of Glycan Linkages Using MSn and Machine Learning─Proof of Concept Using Sialic Acid Linkages
- PMID: 37621000
- PMCID: PMC10557947
- DOI: 10.1021/jasms.3c00132
Toward Automatic Inference of Glycan Linkages Using MSn and Machine Learning─Proof of Concept Using Sialic Acid Linkages
Abstract
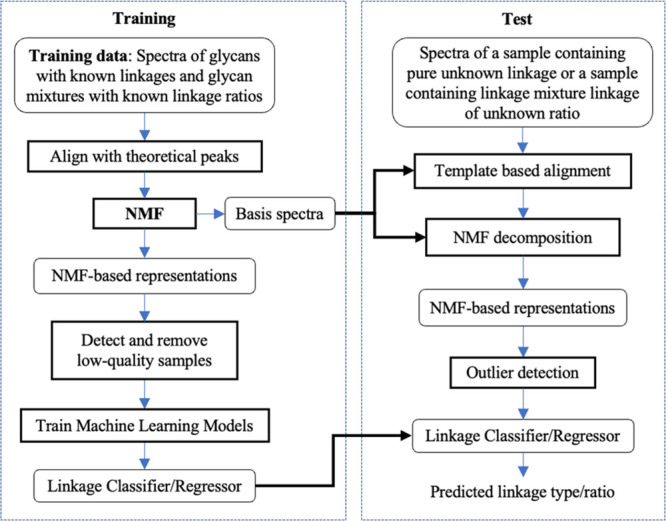
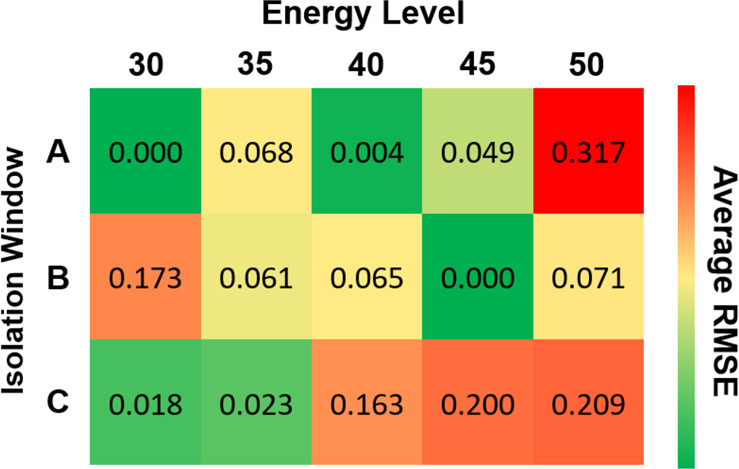
Glycosidic linkages in oligosaccharides play essential roles in determining their chemical properties and biological activities. MSn has been widely used to infer glycosidic linkages but requires a substantial amount of starting material, which limits its application. In addition, there is a lack of rigorous research on what MSn protocols are proper for characterizing glycosidic linkages. In this work, to deliver high-quality experimental data and analysis results, we propose a machine learning-based framework to establish appropriate MSn protocols and build effective data analysis methods. We demonstrate the proof-of-principle by applying our approach to elucidate sialic acid linkages (α2'-3' and α2'-6') in a set of sialyllactose standards and NIST sialic acid-containing N-glycans as well as identify several protocol configurations for producing high-quality experimental data. Our companion data analysis method achieves nearly 100% accuracy in classifying α2'-3' vs α2'-6' using MS5, MS4, MS3, or even MS2 spectra alone. The ability to determine glycosidic linkages using MS2 or MS3 is significant as it requires substantially less sample, enabling linkage analysis for quantity-limited natural glycans and synthesized materials, as well as shortens the overall experimental time. MS2 is also more amenable than MS3/4/5 to automation when coupled to direct infusion or LC-MS. Additionally, our method can predict the ratio of α2'-3' and α2'-6' in a mixture with 8.6% RMSE (root-mean-square error) across data sets using MS5 spectra. We anticipate that our framework will be generally applicable to analysis of other glycosidic linkages.
Keywords: machine learning; mass spectrometry; non-negative matrix factorization; support vector machine.
Conflict of interest statement
The authors declare no competing financial interest.
Figures


Similar articles
-
Identification and quantification of unreported sialylated N-glycan isomers with α2-3 and α2-6 linkages in the egg yolk protein phosvitin.Food Res Int. 2024 Dec;197(Pt 2):115293. doi: 10.1016/j.foodres.2024.115293. Epub 2024 Nov 3. Food Res Int. 2024. PMID: 39577941
-
Enhanced detection of sialylated and sulfated glycans with negative ion mode nanoliquid chromatography/mass spectrometry at high pH.Anal Chem. 2010 Feb 15;82(4):1470-7. doi: 10.1021/ac902602e. Anal Chem. 2010. PMID: 20092260
-
Cross-Ring Fragmentation Patterns in the Tandem Mass Spectra of Underivatized Sialylated Oligosaccharides and Their Special Suitability for Spectrum Library Searching.J Am Soc Mass Spectrom. 2019 Mar;30(3):426-438. doi: 10.1007/s13361-018-2106-8. Epub 2018 Dec 18. J Am Soc Mass Spectrom. 2019. PMID: 30565163 Free PMC article.
-
Sialic acid derivatization for glycan analysis by mass spectrometry.Proc Jpn Acad Ser B Phys Biol Sci. 2019;95(9):523-537. doi: 10.2183/pjab.95.036. Proc Jpn Acad Ser B Phys Biol Sci. 2019. PMID: 31708496 Free PMC article. Review.
-
Mass spectrometry for protein sialoglycosylation.Mass Spectrom Rev. 2018 Sep;37(5):652-680. doi: 10.1002/mas.21555. Epub 2017 Dec 11. Mass Spectrom Rev. 2018. PMID: 29228471 Review.
References
-
- Ma X.; Li Y.; Kondo Y.; Shi H.; Han J.; Jiang Y.; Bai X.; Archer-Hartmann S. A.; Azadi P.; Ruan C.; Fu J.; Xia L. Slc35a1 deficiency causes thrombocytopenia due to impaired megakaryocytopoiesis and excessive platelet clearance in the liver. Haematologica 2021, 106 (3), 759–769. 10.3324/haematol.2019.225987. - DOI - PMC - PubMed
-
- Shajahan A.; Supekar N. T.; Wu H.; Wands A. M.; Bhat G.; Kalimurthy A.; Matsubara M.; Ranzinger R.; Kohler J. J.; Azadi P. Mass Spectrometric Method for the Unambiguous Profiling of Cellular Dynamic Glycosylation. ACS Chem. Biol. 2020, 15 (10), 2692–2701. 10.1021/acschembio.0c00453. - DOI - PMC - PubMed
MeSH terms
Substances
LinkOut - more resources
Full Text Sources
Research Materials
Miscellaneous
