Smoothing Lexis diagrams using kernel functions: A contemporary approach
- PMID: 37621099
- PMCID: PMC11385548
- DOI: 10.1177/09622802231192950
Smoothing Lexis diagrams using kernel functions: A contemporary approach
Abstract
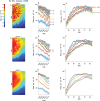
Lexis diagrams are rectangular arrays of event rates indexed by age and period. Analysis of Lexis diagrams is a cornerstone of cancer surveillance research. Typically, population-based descriptive studies analyze multiple Lexis diagrams defined by sex, tumor characteristics, race/ethnicity, geographic region, etc. Inevitably the amount of information per Lexis diminishes with increasing stratification. Several methods have been proposed to smooth observed Lexis diagrams up front to clarify salient patterns and improve summary estimates of averages, gradients, and trends. In this article, we develop a novel bivariate kernel-based smoother that incorporates two key innovations. First, for any given kernel, we calculate its singular values decomposition, and select an optimal truncation point-the number of leading singular vectors to retain-based on the bias-corrected Akaike information criterion. Second, we model-average over a panel of candidate kernels with diverse shapes and bandwidths. The truncated model averaging approach is fast, automatic, has excellent performance, and provides a variance-covariance matrix that takes model selection into account. We present an in-depth case study (invasive estrogen receptor-negative breast cancer incidence among non-Hispanic white women in the United States) and simulate operating characteristics for 20 representative cancers. The truncated model averaging approach consistently outperforms any fixed kernel. Our results support the routine use of the truncated model averaging approach in descriptive studies of cancer.
Keywords: Epidemiology; Lexis diagram; Surveillance; and End Results Program; cancer surveillance research; kernel methods; nonparametric smoothing.
Conflict of interest statement
The author(s) declared no potential conflicts of interest with respect to the research, authorship, and/or publication of this article.
Figures


References
-
- Keiding N. Statistical-inference in the Lexis diagram. Philos T Roy Soc A 1990; 332: 487–509.
-
- Carstensen B. Age-period-cohort models for the Lexis diagram. Stat Med 2007; 26: 3018–3045. - PubMed
-
- Breslow NE, Day NE. Statistical Methods in Cancer Research, Volume 2, The Design and Analysis of Cohort Studies. Oxford: International Agency for Research on Cancer, 1987. - PubMed
-
- Froelicher JH, Forjaz G, Rosenberg PS, et al. Geographic disparities of breast cancer incidence in Portugal at the district level: a spatial age-period-cohort analysis, 1998-2011. Cancer Epidemiol 2021; 74: 102009. - PubMed
MeSH terms
LinkOut - more resources
Full Text Sources
Medical

