Nix interacts with WIPI2 to induce mitophagy
- PMID: 37621214
- PMCID: PMC10646555
- DOI: 10.15252/embj.2023113491
Nix interacts with WIPI2 to induce mitophagy
Abstract
Nix is a membrane-anchored outer mitochondrial protein that induces mitophagy. While Nix has an LC3-interacting (LIR) motif that binds to ATG8 proteins, it also contains a minimal essential region (MER) that induces mitophagy through an unknown mechanism. We used chemically induced dimerization (CID) to probe the mechanism of Nix-mediated mitophagy and found that both the LIR and MER are required for robust mitophagy. We find that the Nix MER interacts with the autophagy effector WIPI2 and recruits WIPI2 to mitochondria. The Nix LIR motif is also required for robust mitophagy and converts a homogeneous WIPI2 distribution on the surface of the mitochondria into puncta, even in the absence of ATG8s. Together, this work reveals unanticipated mechanisms in Nix-induced mitophagy and the elusive role of the MER, while also describing an interesting example of autophagy induction that acts downstream of the canonical initiation complexes.
Keywords: Autophagy; BNIP3; FIP200; LIR; p62.
Published 2023. This article is a U.S. Government work and is in the public domain in the USA.
Conflict of interest statement
The authors declare that they have no conflicts of interest.
Figures
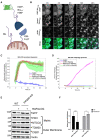
Schematic of full‐length Nix (left) compared to CID Nix (right) and their mitochondrial localization.
Representative images of EGFP‐Nix‐FKBP (green) Rapalog‐induced recruitment to mtKeima‐labeled mitochondria (Keima excitation 488, cyan) and subsequent mitophagy (Keima excitation 561, magenta). Scale bar: 10 μm.
Recruitment dynamics of CID Nix after different treatments measured by Pearson's correlation between EGFP and Keima Exc. 488.
Mitophagy as indicated by percent mtKeima pixels in EGFP‐positive cells over a threshold set from no treatment.
Confirmation of decreased mitochondrial proteins in WT but not in FIP200 ko cells expressing CID Nix, either untreated or treated for 24 h with Rapalog by immunoblotting.
Quantification of MTCO2 relative to actin over three independent experiments after treatment with Rapalog over 24 h by immunoblotting.
Cells in this figure express mtKeima‐P2A‐FRB‐Fis1tT and EGFP‐Nix1–188‐FKBP.
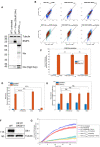
Western blot comparing endogenous Nix in HeLa cells, untreated or with 24 h phenanthroline (50 μM), to overexpressed EGFP‐Nix1–188‐FKBP.
FACS plots of untreated (top) and 24‐h Rapalog‐treated (bottom) mtKeima cells expressing EGFP‐Nix1–188‐FKBP (left), FKBP‐EGFP‐Nix1–188 (middle), or FKBPEGFP‐BNIP31‐163 (right).
FACS analysis of mtKeima of Nix with FKBP attached via the C‐terminus or N‐terminus and compared to BNIP3 with FKBP attached via the N‐terminus with either no treatment for 24 h or Rapalog, indicating percentage of cells above threshold line.
mtKeima analysis from microscopy images of CID‐Nix‐expressing cells after either no treatment or 24 h of Rapalog in different knockout backgrounds. 5KO cells lack NDP52, OPTN, TAX1BP1, p62, and NBR1. 6KO cells lack all six hATG8 (LC3 and GABARAP) proteins.
Recruitment of EGFP‐Nix1–188‐FKBP to FRB‐Fis1T by Pearson's correlation coefficient between KeimaEx488 and EGFP of the cells quantified in Panel D.
Confirmation of Ulk1 ko in Ulk1/2 dko cells, Ulk2 confirmed by sequencing but not by western blot.
Time course of mtKeima reported mitophagy in WT or Ulk1/2 dko cells either with or without a previously validated TBK1 inhibitor GSK8612.
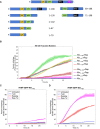
Schematic of truncation mutants compared to full length (top). C‐terminal truncations (left) and N‐terminal truncations (right).
Mitophagy time course by mtKeima of different Nix truncation mutants recruited with CID, measured by percentage of Keima‐positive pixels above threshold.
Mitophagy by mtKeima of Nix1–70 when treated with Torin, Rapalog, or both compared to control.
Mitophagy by mtKeima of Nix1–87 when treated with Torin, Rapalog, or both compared to control.
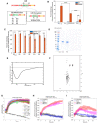
Schematic of different residues mutated to disrupt a possible FIR or the LIR of Nix.
Percent mtKeima cells by FACS over ratiometric threshold after 24 h of Rapalog treatment indicating relative mitophagy between WT and LIR mutants.
Percent mtKeima cells by FACS over ratiometric threshold after 24 h of Rapalog treatment indicating relative mitophagy between each FIR mutation with or without Rapalog.
Coomassie gel showing purity of Nix1–188 for circular dichroism and NMR.
The circular dichroism spectrum of Nix‐C1 displays a single minimum of around 200 nm. This is consistent with the random coil nature of Nix1–188.
The 1HN‐15N HSQC NMR spectrum of Nix shows very little dispersion with amide proton chemical shifts ranging from 6.6 to 8.8 ppm. In addition, the side‐chain indole signals for the three tryptophan are all overlapping around 10 ppm. These all indicate a random coil conformation of Nix1–188.
All truncation mutants in Fig 2B are recruited with the same dynamics and to the same magnitude as indicated by Pearson correlation coefficient between GFP and mtKeima Exc. 488.
Recruitment dynamics of Nix1–70 upon different treatments by Pearson's correlation coefficient between KeimaExc488 and EGFP of the cells quantified in Fig 2C.
Recruitment dynamics of Nix1–87 upon different treatments by Pearson's correlation coefficient between KeimaExc488 and EGFP of the cells quantified in Fig 2D.
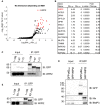
Volcano plot generated from one‐tailed t‐test of proteins that interact with Nix1–87 more so than Nix1–70 by IP‐mass spectrometry. Red dots indicate proteins over twofold enrichment and P‐value < 0.05
Table of top significant interactors from Fig 4A.
IP western blot of FKBP‐EGFP‐Nix1–188, Nix1–87, or Nix1–70, comparing 1% input to GFP‐pulldown and blotted against GFP or WIPI2 after 4 h of Rapalog.
HeLa cells expressing FKBP‐EGFP‐ p62327–348 or FKBP‐EGFP‐WIPI2b were treated for 16 h with phenanthroline to induce endogenous Nix and BNIP3 expression, then underwent a GFP pulldown and compared to 1% input by immunoblot.
IP western blot of FKBP‐EGFP‐Nix1–188 compared to Nix60–188, comparing 1% input to GFP pulldown and blotted against GFP or WIPI2 after 4 h of Rapalog.
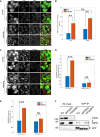
Representative images of WT or 6ko HeLa cells expressing EGFP‐Nix1–188‐FKBP (green), mtKeima, and FRB‐Fis1T with or without 4 h of Rapalog, immunostained for endogenous Tom20 (red) and WIPI2 (white). Scale bar: 50 μm.
Automated puncta counting of WIPI2 in WT or 6ko cells normalized to cell number in control conditions or after 4 h with Rapalog.
Representative images of WT or WIPI2 ko HeLa cells expressing EGFP‐Nix1–188‐FKBP (green), mtKeima, and FRB‐Fis1T with or without 4 h of Rapalog immunostained for endogenous Tom20 (red) and GABARAP (white). Scale bar: 50 μm.
Automated puncta counting of GABARAP in WT or WIPI2 ko cells normalized to cell number in control conditions or after 4 h with Rapalog.
Automated puncta counting of GABARAP in WT cells expressing FKBP‐EGFP‐Nix1–87 or Nix1–70 normalized to cell number in control conditions or after 4 h with Rapalog.
GFP pulldown of EGFP‐Nix1–188‐FKBP in WT, WIPI2 ko, or FIP200 ko cells after 4 h of Rapalog treatment. FIP200 cropped due to the appearance of non‐specific bands after IP.
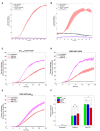
Time course of mitophagy reported by mtKeima in WT or WIPI2 ko HeLa cells untreated or treated with phenanthroline (50 μM).
Time course of pexophagy reported by Keima‐SKL in WT or WIPI2 ko HeLa cells untreated or treated with phenanthroline (50 μM).
Mitophagy dynamics of EGFP‐Nix‐FKBP treated with Rapalog or Rapalog and Torin compared to control.
Mitophagy dynamics of FKBP‐EGFP‐WIPI2b treated with Rapalog or Rapalog and Torin compared to control.
Mitophagy dynamics of FKBP‐EGFP‐p62FBD treated with Rapalog or Rapalog and Torin compared to control.
Slope of mitophagy from Panels C‐E between 6 and 12 h.

Representative images of endogenous Halo‐WIPI2 in U2OS cells stained with JF646 Halo dye (magenta)‐expressing mtKeima (cyan), FRB‐Fis1T, FKBP‐EGFP‐Nix1–87, and FKBP‐EGFP‐Nix60–188 or FKBP‐EGFP‐Nix1–70 (green) after 16 h of Rapalog treatment.
Automated puncta counting of endogenous Halo‐WIPI2 in U2OS cells expressing FKBP‐EGFP‐Nix1–87 (LIR and MER), Nix60–188 (MER), or Nix1–70 (LIR) after 16 h of Rapalog treatment then fixed.
Pearson's correlation coefficient between Halo‐WIPI2 and mtKeima pH7 signal in cells is described in Panel B.
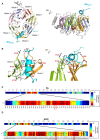
Left panel is a top view of the complex between Nix and WIPI2d. The WIPI2d regions consisting of the beta strands forming the blades are color coded based on their blade numbers. The helices between residues W273‐Y287 and S290‐N297 are colored in gray, as well as the flexible loops connecting the WIPI2d blades. The region of Nix predicted to bind WIPI2d as a helix is shown in cyan. For clarity, only residues I66 to S87 of Nix are displayed. Right panel is rotated 90° relative to the left panel.
A zoom‐in region of the interaction site between Nix and WIPI2d. Right panel is 90° rotated relative to the left panel. Only WIPI2d blades 2 and 3 are visible. Residues crucial for the interaction between the two proteins are shown as sticks. Residues in WIPI2d blade 2 are colored orange, whereas those in blade 3 are green. Nix residues are in cyan. Those belonging to WIPI2d are labeled in red, while Nix residues are in black. There is clear charge complementarity between D77 of Nix and K88 of WIPI2d, E81, and R108, as well as E72 and K128. In addition, Nix residues L75 and A78 form close hydrophobic contacts with WIPI2d residues L69, V83, I92, and I124. Finally, there is a potential hydrogen bond formation between the side chain of Q79 of Nix and backbone of I124 of WIPI2d.
A heatmap indicating the calculated distance between each of all Nix residues (top) and WIPI2 protein in the AlphaFold predicted model, where red indicates amino acids at the interface between both proteins. The bottom heatmap shows an annotated zoom of Nix residues 50–92 with a plot representing Ångstrom distance between each residue and WIPI2 overlaid on the heatmap. L75 is highlighted as a residue of interest.
A heatmap indicated the calculated distance between each of all WIPI2 residues (top) and Nix protein as in Panel C. The bottom heatmap shows an annotated zoom of residues 60–138 with a distance plot overlaid. Residues R108 and R125 are highlighted as residues of interest.

Full proteins modeled by AlphaFold2 shown as aquamarine cartoon for Nix except for residues 60–87 shown in red. WIPI2d shown in green cartoon format with transparent gray surface.
Closer view of the protein interface showing Nix L75 inserting into a groove of WIPI2d. WIPI2d hydrophobic residues L68, I92, and I124 colored are colored in yellow; WIPI2d‐positive residues K88, R108, and R125 are colored in blue; the rest of WIPI2d presented in gray.
Heatmap with overlapping plot showing pLDDT scored for Nix and WIPI2d in the model presented in Panels A and B and Fig 6.
Predicted aligned errors (PAE) for Nix and WIPI2d residues compared to other residues in multimer model.
Overlapping aligned structures for each of the five models generated by AlphaFold2, each showing the Nix MER in the same groove of WIPI2d.
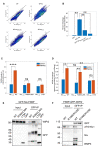
FACS plots measuring mtKeima in Nix/BNIP3 dko HeLa cells expressing EGFP or EGFP conjugated to full‐length Nix as WT, or with W36A/L39A, or L75A mutations 1 week after viral transduction.
Percent cells above threshold line shown in Panel A as indication of mitophagy measured by mtKeima after 1 week of stably expressing EGFP, or EGFP‐Nix as WT or with W36A/L39A or L75A mutations.
Automated puncta counting of endogenous Halo‐WIPI2 in U2OS cells expressing FKBP‐EGFP‐Nix1–188 as WT or with W36A/L39 (LIR) or L75A (MER) mutations after 16 h of Rapalog treatment then fixed.
Pearson's Correlation Coefficient between Halo‐WIPI2 and mtKeima pH7 signal in cells is described in panel D.
GFP pulldown of EGFP alone, EGFP‐Nix1–188‐FKBP as WT, W36A/L39A, or L75A mutants after 4 h of Rapalog treatment.
GFP pulldown of FKBP‐EGFP‐WIPI2 as WT or with R108E/R125E mutations after 24 h of phenanthroline treatment.
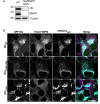
Confirmation of Nix/BNIP3 dko HeLa cells by immunoblot.
Representative images of endogenous Halo‐WIPI2 (magenta) in U2OS cells expressing mtKeima (cyan), FRB‐Fis1T, and EGFP‐Nix1–188‐FKBP as WT or with W36A/L39A or L75A mutations (green). Scale bar: 50 μm. Experiments are repeated at least three times.

References
-
- Bach M, Larance M, James DE, Ramm G (2011) The serine/threonine kinase ULK1 is a target of multiple phosphorylation events. Biochem J 440: 283–291 - PubMed
-
- Bayle JH, Grimley JS, Stankunas K, Gestwicki JE, Wandless TJ, Crabtree GR (2006) Rapamycin analogs with differential binding specificity permit orthogonal control of protein activity. Chem Biol 13: 99–107 - PubMed
Publication types
MeSH terms
Substances
Grants and funding
LinkOut - more resources
Full Text Sources
Miscellaneous

