. 2023 Aug 21:15:11795735231195778.
doi: 10.1177/11795735231195778. eCollection 2023.

Nerve ultrasound reference values in children and adolescents: Echogenicity and influence of anthropometric factors including hand volume

Affiliations

Nerve ultrasound reference values in children and adolescents: Echogenicity and influence of anthropometric factors including hand volume

Ifirae Yusuf et al. J Cent Nerv Syst Dis. .

Abstract

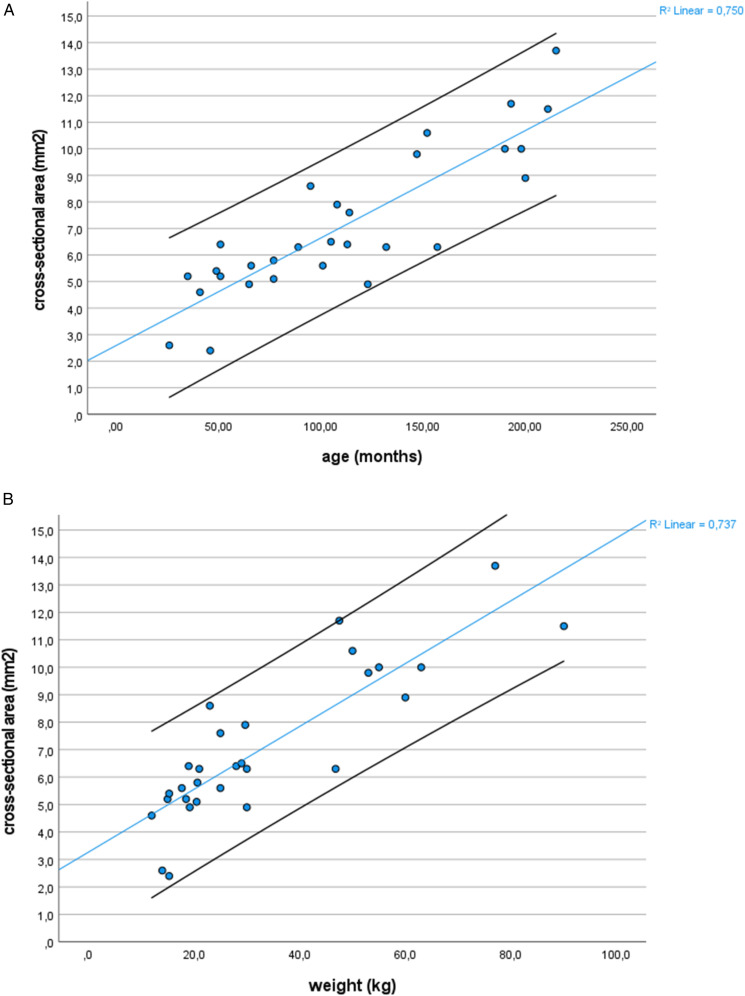
Background: Nerve cross-sectional area (CSA) reference values in high-resolution ultrasound for children and adolescents are influenced by demographic and anthropometric factors such as age, height and weight.

Objectives: The influence of hand volume as an additional morphometric factor was evaluated and nerve echogenicity was analyzed in a prospective cross-sectional study.

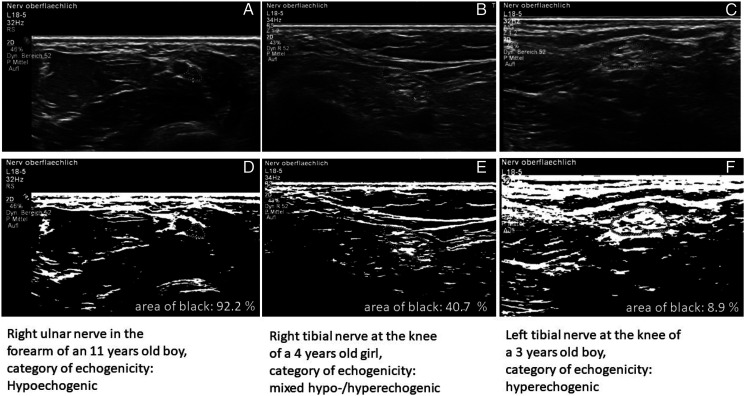
Methods: CSA were measured in 30 healthy children and adolescents from 2 to 17 years in the median, ulnar, radial, tibial, peroneal and sural nerves. Height, weight, age, handedness and gender were recorded, the volume of the hands was measured using the water displacement method. The intra-nerve CSA variability (INV), left/right ratios and absolute differences were calculated. Age groups were compared by the Kruskal-Wallis test. The influence of demographic factors was analyzed using Spearman correlation and multiple linear regression. Echogenicity and fraction of black were determined for each nerve segment.

Results: Nerve CSA values were consistently lower than those reported for adults and correlated in all measured nerve sites with age, height, weight and hand volume. Weight showed the highest correlation coefficient (R = .95) with the best fitting model predicting CSA. Correlation coefficients were higher in a linear than in a logarithmic model. Ratios were stable, the absolute differences increased with age and were significantly different between age groups. Most nerves showed a mixed or hypoechogenic pattern in echogenicity analysis, hyperechogenicity is less frequently observed.

Conclusions: Nerve CSA in children and adolescents is lower than in adults and increases proportionally during growth with a constant INV and left/right ratio in different age groups. Weight and age are predominant anthropometric factors predicting nerve size. Hand volume is correlated with nerve size, but does not predict CSA independently. Echogenicity can provide additional information on nerve structure.

Keywords: High-resolution nerve ultrasound; demographic factors; echogenicity; hand volume; pediatric reference values.


Conflict of interest statement

The author(s) declared no potential conflicts of interest with respect to the research, authorship, and/or publication of this article.

Figures

Figure 1.
Figure 1.
Examples of nerve ultrasound images with anatomical landmarks.
Figure 2.
Figure 2.
Mean cross-sectional area of the median nerve in age group 1-4. r, right; l, left; CT, carpal tunnel; FA, forearm; UA, upper arm. n = 30.
Figure 3.
Figure 3.
Mean total cross-sectional area in different weight groups. Total cross-sectional area represents the sum of all measured nerve sites’ cross-sectional area in an individual participant (n = 30). Means and 95% confidence intervals are displayed.
Figure 4.
Figure 4.
Absolute differences (delta) and ratio of right and left nerve cross-sectional area in different age groups. The means and 95% confidence intervals of the cross-sectional area ratios (blue line) and the absolute differences (green line) between all corresponding right and left side nerve sites are displayed for different age groups.
Figure 5.
Figure 5.
Linear regression curves of cross-sectional area and body weight or age. Linear regression curves with upper and lower 95% confidence intervals of cross-sectional area and age (A) or body weight (B) for the right median nerve in the upper arm (n = 29, one outlier excluded).
Figure 6.
Figure 6.
Examples of echogenicity measurements using ImageJ. Echogenicity analysis in ImageJ. (A-C): Original ultrasound images; (D-F): Images after conversion to 8 bit in black and white, determination of the area of black in the manually selected area.
Figure 7.
Figure 7.
Echogenicity measured as area of black at different nerve sites. CT, carpal tunnel; FA, forearm; UA, upper arm; LdG, loge de Guyon; EB, elbow; FH, fibular head; FP, popliteal fossa; T, tarsal. Results are displayed for the left side. (Upper extremity, n = 30; lower extremity, n = 29).

References

    1. Cartwright MS, Passmore LV, Yoon JS, Brown ME, Caress JB, Walker FO. Cross-sectional area reference values for nerve ultrasonography. Muscle Nerve. 2008;37:566-571. DOI: 10.1002/mus.21009 - DOI - PubMed
    1. Won SJ, Kim BJ, Park KS, Yoon JS, Choi H. Reference values for nerve ultrasonography in the upper extremity. Muscle Nerve. 2013;47:864-871. DOI: 10.1002/mus.23691 - DOI - PubMed
    1. Kerasnoudis A, Pitarokoili K, Behrendt V, Gold R, Yoon MS. Cross sectional area reference values for sonography of peripheral nerves and brachial plexus. Clin Neurophysiol. 2013;124:1881-1888. DOI: 10.1016/j.clinph.2013.03.007 - DOI - PubMed
    1. Tahmaz M, Yoon MS, Schellinger PD, Philipps J. Cross-sectional area in median and ulnar nerve ultrasound correlates with hand volume. Muscle Nerve. 2020;62:83-88. DOI: 10.1002/mus.26881 - DOI - PubMed
    1. Cartwright MS, Mayans DR, Gillson NA, Griffin LP, Walker FO. Nerve cross-sectional area in extremes of age. Muscle Nerve. 2013;47:890-893. DOI: 10.1002/mus.23718 - DOI - PubMed