. 2023 Aug 9:14:1083976.
doi: 10.3389/fgene.2023.1083976. eCollection 2023.

Indian Red Jungle fowl reveals a genetic relationship with South East Asian Red Jungle fowl and Indian native chicken breeds as evidenced through whole mitochondrial genome sequences

Affiliations

Indian Red Jungle fowl reveals a genetic relationship with South East Asian Red Jungle fowl and Indian native chicken breeds as evidenced through whole mitochondrial genome sequences

M Kanakachari et al. Front Genet. .

Abstract

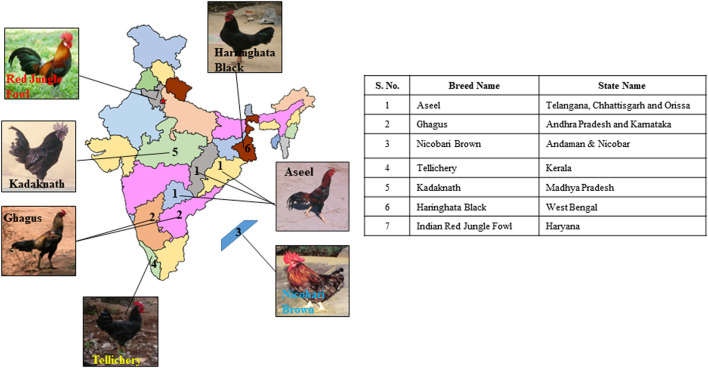
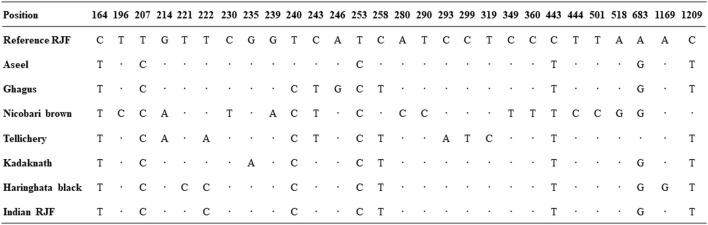
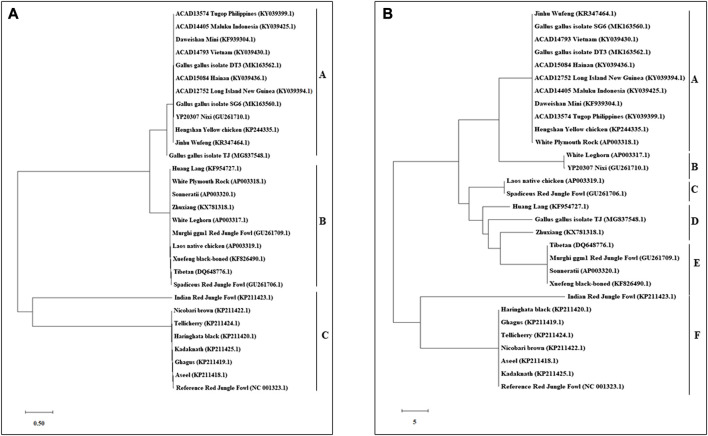
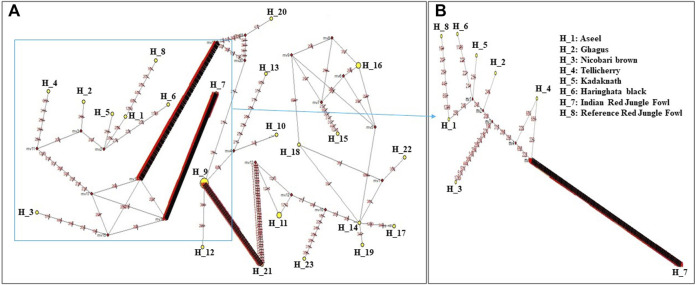
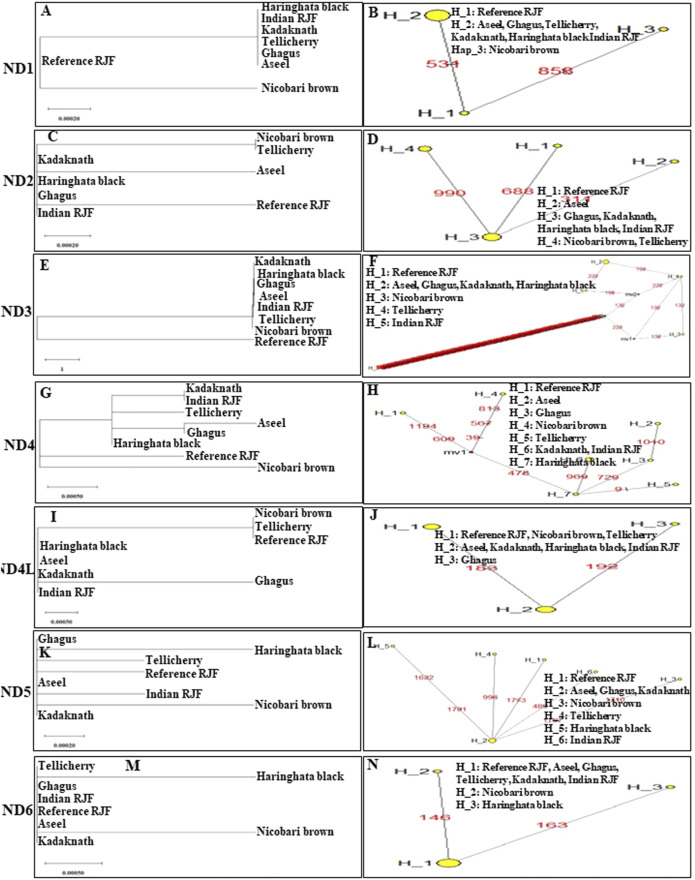
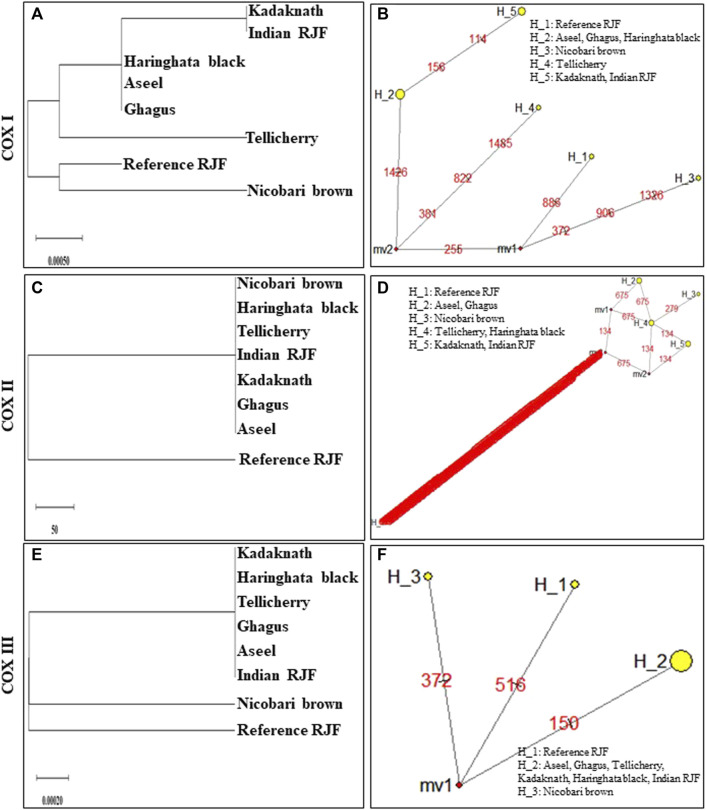
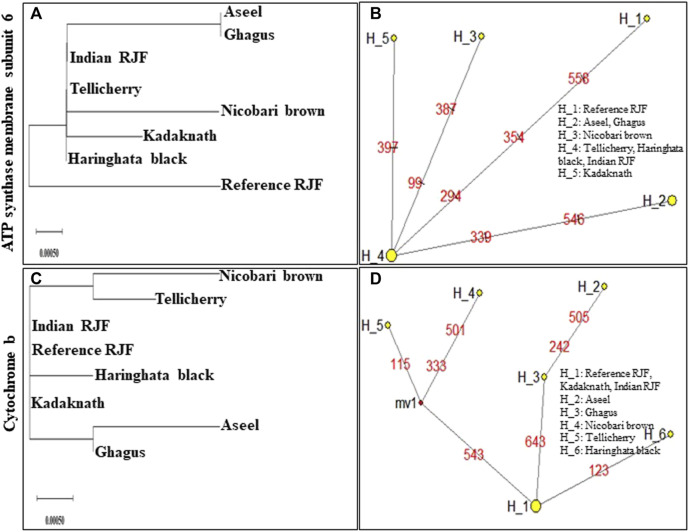
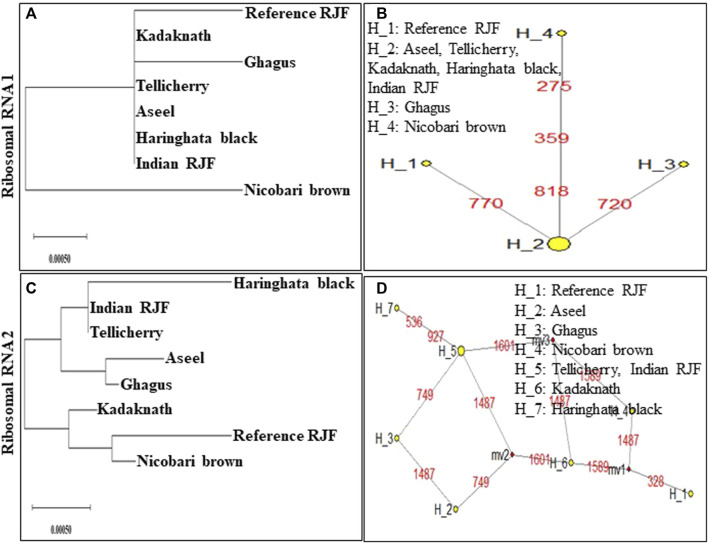
Background: Native chickens are dispersed in a wide geographical range and have hereditary assets that are kept by farmers for various purposes. Mitochondrial DNA (mtDNA) is a widely utilized marker in molecular studies because of its quick advancement, matrilineal legacy, and simple molecular structure. Method and Results: We performed NGS sequencing to investigate mitochondrial genomes and to evaluate the hereditary connections, diversity, and measure of gene stream estimation in Indian native chicken breeds and Red Jungle fowl. The chicken breeds were genotyped using the D-loop region and 23 haplotypes were identified. When compared to Indian native breeds, more haplotypes were identified in the NADH dehydrogenase subunits, Cytochrome c oxidase, Cytochrome b, ATP synthase subunit 6, and Ribosomal RNA genes. The phylogenetic examination indicated that the analyzed chicken breeds were divided into six significant clades, namely A, B, C, D, E, and F, of which the F clade indicated the domestication of chicken breeds in India. Additionally, our work affirmed that the Indian Red Jungle Fowl is the origin for both reference Red Jungle Fowl as well as all Indian breeds, which is reflected in the dendrogram as well as network analysis based on the whole mtDNA and D-loop region. Indian Red Jungle Fowl is distributed as an outgroup, suggesting that this ancestry was reciprocally monophyletic. Conclusion: The mtDNA sequences of Indian native chickens provided novel insights into adaptation mechanisms and the significance of important mtDNA variations in understanding the maternal lineages of native birds.

Keywords: SNPs; chicken; mitochondrial DNA; molecular phylogeny; mutations and variants; next-generation sequencing.


Conflict of interest statement

The authors declare that the research was conducted in the absence of any commercial or financial relationships that could be construed as a potential conflict of interest.

Figures

FIGURE 1
FIGURE 1
Geographic distribution of native Indian chicken breeds used in the current study.
FIGURE 2
FIGURE 2
Pattern of mtDNA D-loop variability. Nucleotide polymorphisms were observed in the D-loop region of seven native Indian chicken sequences. Vertically oriented numbers indicate the site position and the sequences shown are only the variable sites. Dots (.) indicate identity with the reference sequence and different base letters denote substitution.
FIGURE 3
FIGURE 3
An N-J tree was constructed using MEGA 10.1 software. Phylogenetic analysis based on mtDNA D-loop region (A) and complete mtDNA genome sequences (B) of seven Indian native breads along with reference RJF mtDNA and twenty-two native Asian breeds sequences. The mtDNA genome sequences were obtained from the NGS sequencing and submitted in NCBI (Accession numbers: Aseel-KP211418.1; Ghagus-KP211419.1; Haringhata Black-KP211420.1; Kadaknath-KP211425.1; Nicobari Brown-KP211422.1; Indian Red Jungle Fowl-KP211423.1; Tellichery-KP211424.1). The numbers at the nodes represent the percentage bootstrap values for interior branches after 1000 replications.
FIGURE 4
FIGURE 4
A median-joining network was produced by the network software 10.1 for eight haplotypes of native Indian chicken breeds along with reference mtDNA based on the polymorphic site of the mtDNA D-loop region (A) and complete mtDNA sequences (B). The area of each yellow circle is proportional to the frequency of the corresponding haplotype. The pink dots illustrate median vectors (mv) and the numbers on each link line represent mutated positions.
FIGURE 5
FIGURE 5
An N-J tree was constructed using MEGA 10.1 software. Phylogenetic analysis (A, C, E, G, I, K, and M) based on mtDNA NADH dehydrogenase subunit gene sequences of seven native Indian breeds along with reference RJF. The numbers at the nodes represent the percentage of bootstrap values for interior branches after 1,000 replications. A median-joining network was produced by the network software 10.1 for Indian native chicken breeds along with reference mtDNA based on polymorphic site of the mtDNA NADH dehydrogenase genes (B, D, F, H, J, L, and N). The area of each yellow circle is proportional to the frequency of the corresponding haplotype. The pink dots illustrate median vectors (mv) and the numbers on each link line represent mutated positions.
FIGURE 6
FIGURE 6
An N-J tree was constructed using MEGA 10.1 software. Phylogenetic analysis (A,C,E) based on mtDNA Cytochrome c oxidase subunit gene sequences of seven native Indian breeds along with reference RJF. The numbers at the nodes represent the percentage of bootstrap values for interior branches after 1000 replications. A median-joining network was produced by the network software 10.1 for native Indian chicken breeds along with reference mtDNA based on the polymorphic site of the mtDNA Cytochrome c oxidase subunit genes (B,D,F). The area of each yellow circle is proportional to the frequency of the corresponding haplotype. The pink dots illustrate median vectors (mv) and the numbers on each link line represent mutated positions.
FIGURE 7
FIGURE 7
An N-J tree was constructed using MEGA 10.1 software. Phylogenetic analysis (A,C) based on mtDNA ATP synthase membrane subunit 6 and Cytochrome b gene sequences of seven native Indian breeds along with reference RJF. The numbers at the nodes represent the percentage of bootstrap values for interior branch after 1000 replications. A median-joining network was produced by the network software 10.1 for native Indian chicken breeds along with reference mtDNA based on the polymorphic site of the mtDNA ATP synthase membrane subunit 6 and Cytochrome b genes (B,D). The area of each yellow circle is proportional to the frequency of the corresponding haplotype. The pink dots illustrate median vectors (mv) and the numbers on each link line represent mutated positions.
FIGURE 8
FIGURE 8
An N-J tree was constructed using MEGA 10.1 software. Phylogenetic analysis (A,C) based on mtDNA Ribosomal RNA 1 and 2 gene sequences of seven native Indian breeds along with reference RJF. The numbers at the nodes represent the percentage of bootstrap values for interior branches after 1000 replications. A median-joining network was produced by the network software 10.1 for native Indian chicken breeds along with reference mtDNA based on the polymorphic site of the mtDNA Ribosomal RNA 1 and 2 genes (B,D). The area of each yellow circle is proportional to the frequency of the corresponding haplotype. The pink dots illustrate median vectors (mv) and the numbers on each link line represent mutated positions.

References

    1. Ahmed S. U., Shukla S., Das H. (2017). Molecular Characterization of Mitochondrial D Loop of Indian Red Jungle Fowl. Int. J. Livest. Res. 7 (6), 1–152. 10.5455/ijlr.20170423033604 - DOI
    1. Altshuler D. L., Dudley R. (2006). The physiology and biomechanics of avian flight at high altitude. Integr. Comp. Biol. 46, 62–71. 10.1093/icb/icj008 - DOI - PubMed
    1. Anderson S., Bankier A. T., Barrell B. G., de Bruijn M. H., Coulson A. R., Drouin J., et al. (1981). Sequence and organization of the human mitochondrial genome. Nature 290 (5806), 457–465. 10.1038/290457a0 - DOI - PubMed
    1. Bandelt H. J., Forster P., Rohl A. (1999). Median-joining networks for inferring intraspecific phylogenies. Mol. Biol. Evol. 16 (1), 37–48. 10.1093/oxfordjournals.molbev.a026036 - DOI - PubMed
    1. Bao H., Zhao C., Li J., Wu C. (2007). Association of MT-ND5 gene variation with mitochondrial respiratory control ratio and NADH dehydrogenase activity in Tibet chicken embryos. Anim. Genet. 38, 514–516. 10.1111/j.1365-2052.2007.01622.x - DOI - PubMed

LinkOut - more resources