. 2023 Jun 28:29:36-49.
doi: 10.1016/j.bioactmat.2023.06.019. eCollection 2023 Nov.

Microvascular endothelial cells derived from spinal cord promote spinal cord injury repair

Affiliations

Microvascular endothelial cells derived from spinal cord promote spinal cord injury repair

Zhifeng You et al. Bioact Mater. .

Abstract

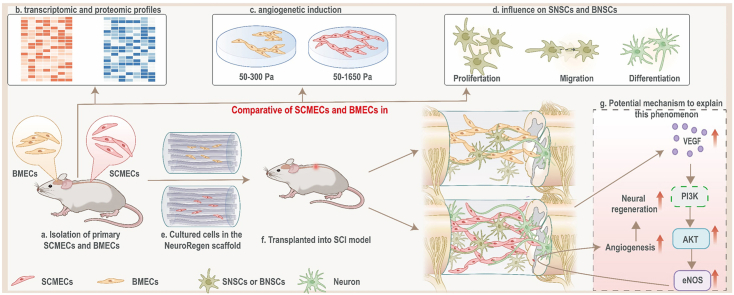
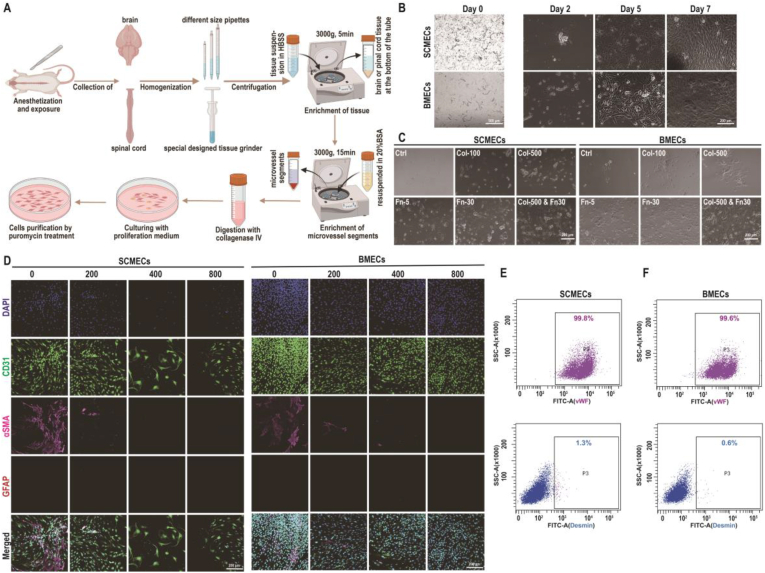
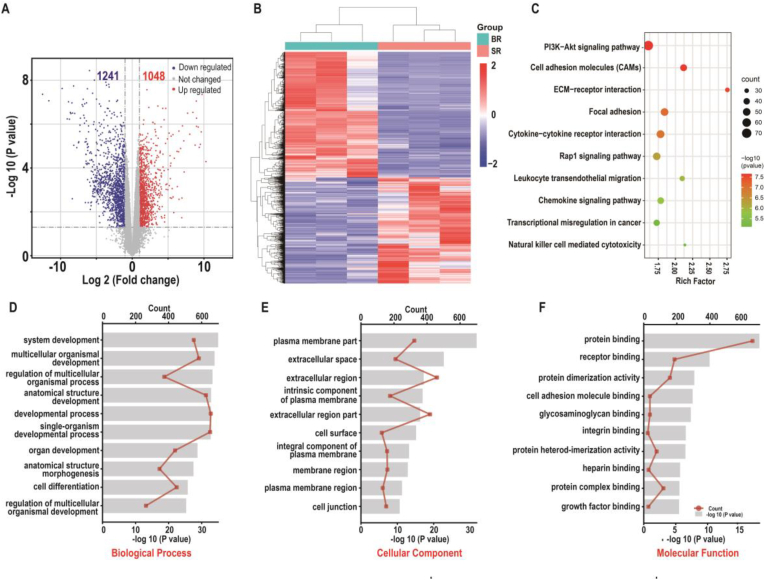
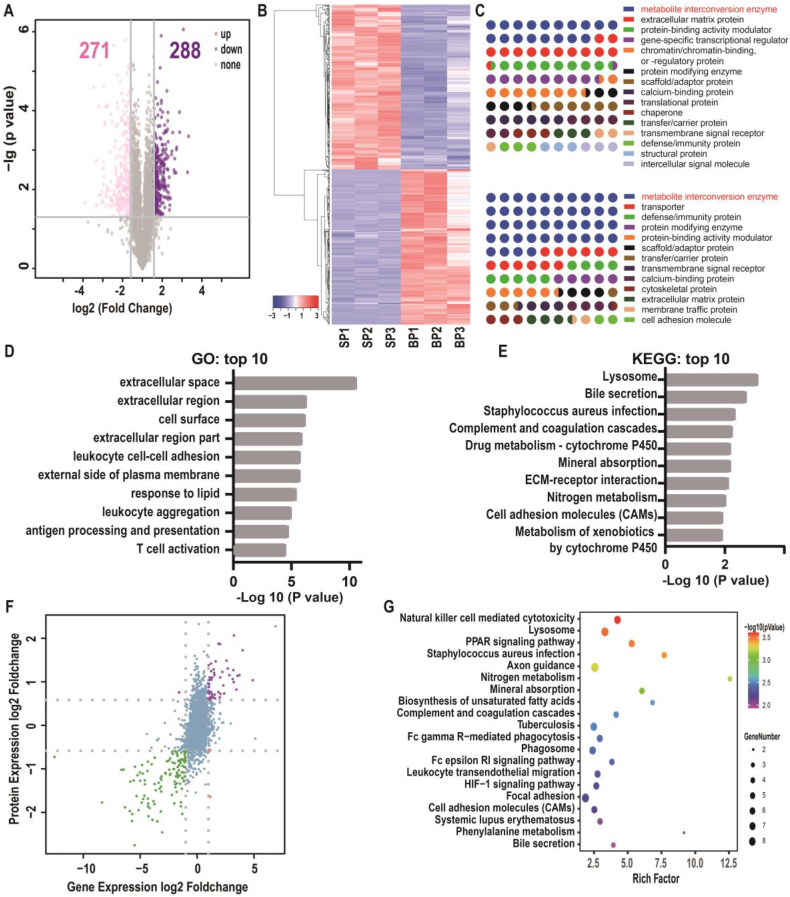
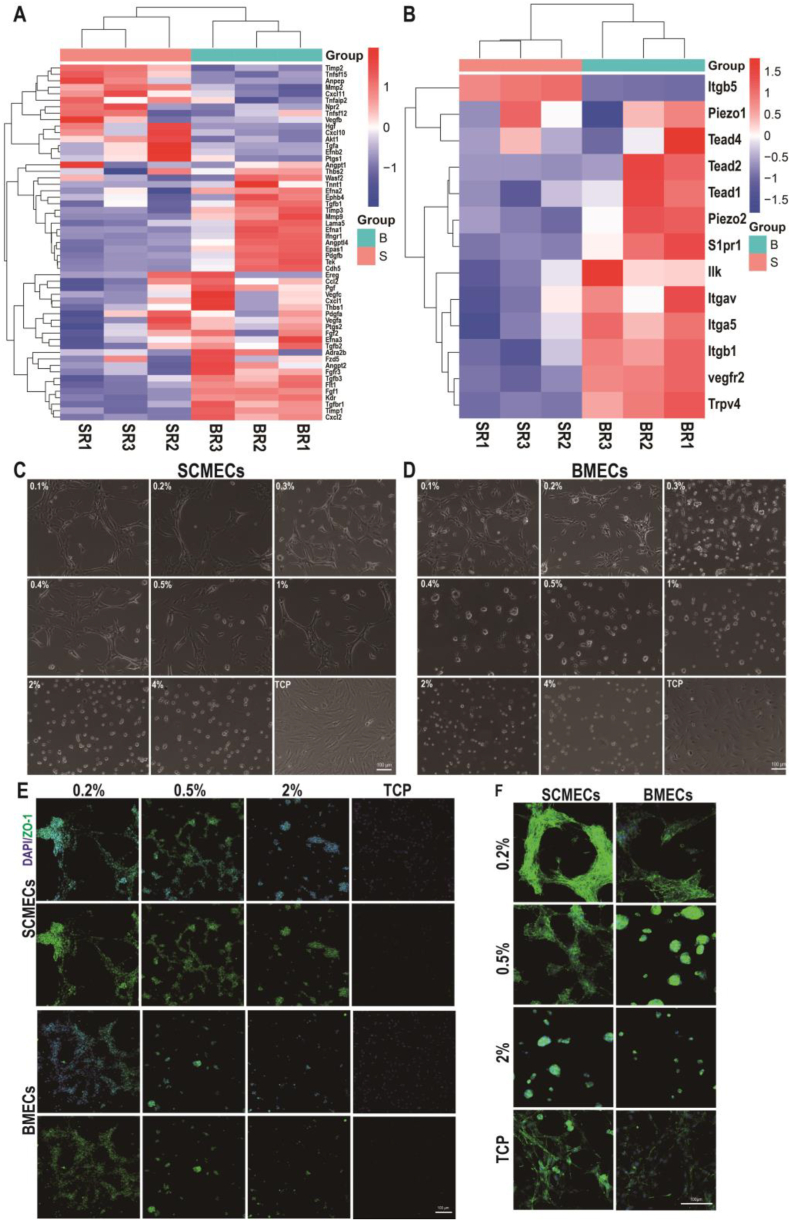
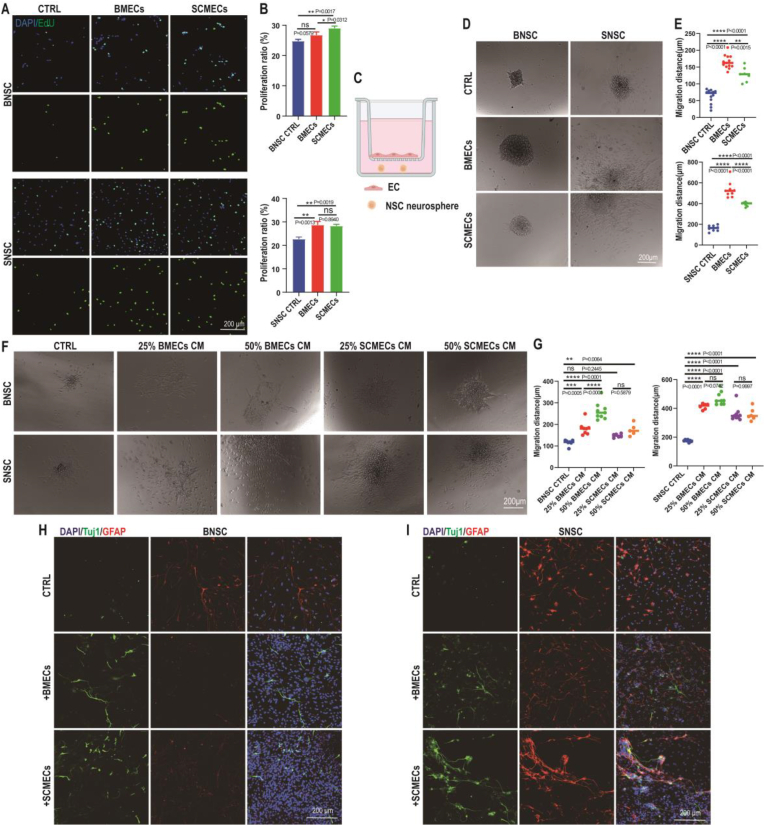
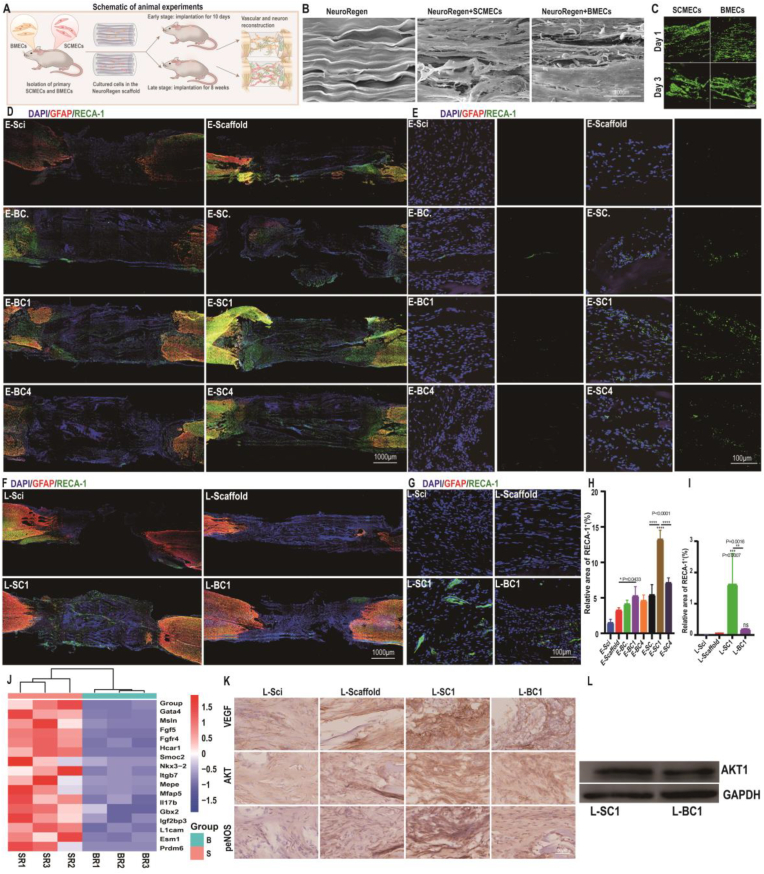
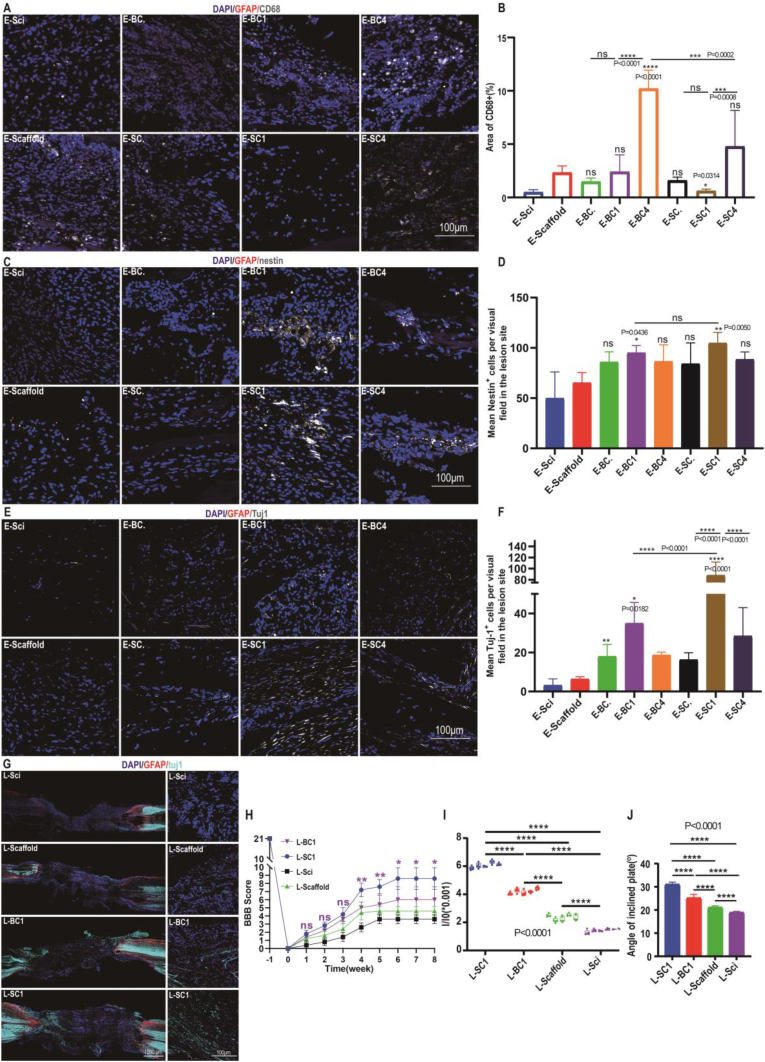
Neural regeneration after spinal cord injury (SCI) closely relates to the microvascular endothelial cell (MEC)-mediated neurovascular unit formation. However, the effects of central nerve system-derived MECs on neovascularization and neurogenesis, and potential signaling involved therein, are unclear. Here, we established a primary spinal cord-derived MECs (SCMECs) isolation with high cell yield and purity to describe the differences with brain-derived MECs (BMECs) and their therapeutic effects on SCI. Transcriptomics and proteomics revealed differentially expressed genes and proteins in SCMECs were involved in angiogenesis, immunity, metabolism, and cell adhesion molecular signaling was the only signaling pathway enriched of top 10 in differentially expressed genes and proteins KEGG analysis. SCMECs and BMECs could be induced angiogenesis by different stiffness stimulation of PEG hydrogels with elastic modulus 50-1650 Pa for SCMECs and 50-300 Pa for BMECs, respectively. Moreover, SCMECs and BMECs promoted spinal cord or brain-derived NSC (SNSC/BNSC) proliferation, migration, and differentiation at different levels. At certain dose, SCMECs in combination with the NeuroRegen scaffold, showed higher effectiveness in the promotion of vascular reconstruction. The potential underlying mechanism of this phenomenon may through VEGF/AKT/eNOS- signaling pathway, and consequently accelerated neuronal regeneration and functional recovery of SCI rats compared to BMECs. Our findings suggested a promising role of SCMECs in restoring vascularization and neural regeneration.

Keywords: Microvascular endothelial cells; Neural regeneration; NeuroRegen scaffold; Spinal cord injury.


Conflict of interest statement

The authors declare no competing interests.

Figures

Image 1
Graphical abstract
Fig. 1
Fig. 1
Schematic of the project. (a and b) SCMECs/BMECs isolation were established to systematically compare differences between SCMECs and BMECs in transcriptomic and proteomic profiles. (c) It was inferred by transcriptomic/proteomic profiles and validated through PEG hydrogels with different elastic modulus that angiogenetic activity in SCMECs and BMECs were different. (d) It was also proved that the proliferation, migration, and differentiation of neural stem cells, which was essential for spinal cord injury repair, was promoted by SCMECs or BMECs, suggesting SCMECs/BMECs benefit angiogenesis and neuron regeneration for spinal cord repair. (e to g) In combination with NeuroRegen scaffold, SCMECs showed higher effectiveness in the promotion of vascular reconstruction through the VEGF/AKT/eNOS- signaling pathway than BMECs, and consequently accelerated neuronal regeneration in spinal cord injury rats. SCMECs, spinal cord microvascular endothelial cells; BMECs, brain microvascular endothelial cells.
Fig. 2
Fig. 2
Isolation and characterization of primary SCMECs and BMECs. (A) Schematic presentation of primary rat SCMECs and BMECs isolation procedure, SCMECs, spinal cord microvascular endothelial cells; BMECs, brain microvascular endothelial cells. (B) Morphology of SCMECs and BMECs after culturing for different indicated times, analyzed using phase contrast microscopy. Scale bars, 500 μm (day 0) and 200 μm (days 2–7). (C) Representative phase-contrast images of SCMECs (left) and BMECs (right) grown for 72 h on culture plates coated with 100 or 500 μg/mL collagen (Col) and/or 5 or 30 μg/mL fibronectin (Fn). Scale bar, 200 μm. (D) Representative immunofluorescence images of SCMECs (left) and BMECs (right) treated with the indicated concentrations of puromycin (ng/mL) and stained with DAPI (blue) and antibodies against CD31 (green), αSMA (pink), or GFAP (red). Scale bar, 200 μm. (E and F) Representative flow cytometry dot plots of isolated SCMECs (E) and BMECs (F) labeled with antibodies against vwF (upper panels) and desmin (lower panels).
Fig. 3
Fig. 3
Comparative transcriptomics of SCMECs and BMECs. (A) A volcano plot of RNA-seq results showing statistics of upregulated and downregulated genes (DEGs; log2 FC ≥ 1 or ≤ −1, respectively; p-value ≤ 0.05). (B) Heatmap of DEGs in SCMECs compared with BMECs. (C) A scatter plot of the top 10 KEGG pathways enriched among the DEGs. (DF) Top 10 enriched GO biological processes (D), cellular components (E), and molecular functions (F). Red lines indicate the number of DEGs.
Fig. 4
Fig. 4
Comparative proteomics and combined transcriptomics/proteomics of SCMECs and BMECs. (A) A volcano plot of differentially expressed proteins (DEPs) in SCMECs (FC ≥ 1.5 or ≤ 0.67 for upregulated (purple) or downregulated (pink) DEPS, respectively; p-value ≤ 0.05). (B) Proteomic clustering in SCMECs (SP1–3) compared to that in BMECs (BP1–3). (C) Classification of DEPs using the PANTHER system. (D and E) Top 10 enriched GO terms (D) and KEGG pathways (E) among the DEPs. (F) A volcano plot of differentially expressed genes and proteins (DEGPs) (log2 FC > 1 or < -1 for upregulated or downregulated DEGPs, respectively) identified by combined transcriptomics/proteomics analysis. (G) A scatter plot of top 20 enriched KEGG pathways among the DEGPs.
Fig. 5
Fig. 5
Comparison of angiogenesis in SCMECs and BMECs. (A) Heatmap of angiogenesis-related genes. (B) Heatmap of mechanical sensors-related genes. (C and D) Morphology of SCMECs (C) and BMECs (D) cultured on PEG hydrogels with different PEGDA content and elastic modulus. Scale bar, 100 μm. (E and F) Representative immunofluorescence images of SCMECs and BMECs (F) cultured on PEG hydrogels prepared with different PEGDA concentrations. Cells were stained with DAPI (blue) and antibodies against ZO-1 (green; E) and F-actin (green; F); scale bar, 100 μm.
Fig. 6
Fig. 6
Effects of SCMECs and BMECs on BNSCs and SNSCs. (A) Representative immunofluorescence images of BNSCs and SNSCs stained with EdU (green) and DAPI (blue). Scale bar, 200 μm. (B) The proliferation ratio (EdU-positive/DAPI-positive) of BNSCs (upper graph) and SNSCs (lower graph) in the presence of SCMECs and BMECs (n = 3 per group); *p < 0.05 and **p < 0.01 using the one-way ANOVA. (CE) Effect of MECs on NSC migration. Schematic representation of the transwell system used in the test: NSC neurospheres were placed on the bottom of a PDL-coated plate and ECs were placed in the insert (C). Representative Images of BNSCs and SNSCs cultured with SCMECs and BMECs are shown (CTRL, control) (D). Graphs present the migration distance of BNSCs (upper) and SNSCs (lower) cultured with SCMECs or BMECs (n > 7 per group); ***p = 0.0001 and ****p < 0.0001 (E). (F and G) Effects of SCMEC and BMEC conditioned medium (CM) on NSC migration. Images of migrated BNSCs and SNSCs cultured with the indicated CM concentrations (F). Quantitative analysis of NSC migration distance (n > 6 per group); *p < 0.05, **p < 0.01, ***p = 0.0001, and ****p < 0.0001 (G). (H and I) Effect of SCMECs and BMECs on BNSC (H) and SNSC (H) differentiation analyzed using immunofluorescence. Tuj1, green; GFAP, red; DAPI, blue. Scale bar, 200 μm.
Fig. 7
Fig. 7
Transplanted SMECs/BMECs affect vascular reconstruction after SCI. (A) Schematic representation of the experimental design. SCMECs or BMECs loaded on NeuroRegen scaffolds were transplanted into the lesion site of rats with complete SCI. (B) Representative SEM images of SCMECs or BMECs cultured on NeuroRegen for 2 days. Scale bar, 100 μm. (C) Live-dead staining of SCMECs and BMECs cultured on NeuroRegen for 1 day and 3 days. Scale bar, 200 μm. (D and E) RECA-1 immunostaining of the spinal cord at early-stage SCI; scale bars, 1000 μm (D) and 100 μm (SCI zone, E). GFAP, red; RECA-1, green; DAPI, blue. (F and G) RECA-1 immunostaining of the spinal cord at late-stage SCI; scale bars, 1000 μm (F) and 100 μm (SCI zone, G). GFAP, red; RECA-1, pink; DAPI, blue. (H and I) Quantification of RECA-1-positive blood vessels in the early-stage (H) and late-stage SCI zone (I). (J) RNA sequencing results of the expression of genes related to angiogenesis regulation of. (K and L) Immunohistochemistry (K) and western blot analysis (L) of proteins in the VEGF-PI3K/AKT/eNOS signaling pathway.
Fig. 8
Fig. 8
Transplanted SCMECs promoted neural niches and motor function recovery in rats with SCI. (A and B) Representative images of CD68-positive areas (A) and quantitative analysis (B) for early-stage SCI. GFAP red; CD68, gray; DAPI, blue. Scale bar, 100 μm. (C and D) Representative images of nestin-positive areas (C) and quantitative analysis (D) for early-stage SCI. GFAP, red; nestin, gray; DAPI, blue. Scale bar, 100 μm. (E and F) Representative images of Tuj1-positive areas (E) and quantitative analysis (F) for early-stage SCI. GFAP, red; Tuj1, gray; DAPI, blue. Scale bar, 100 μm. (G) Representative images of Tuj1-positive areas for late-stage SCI. Scale bars, 1000 μm (left) or 100 μm (lesion site, right). GFAP, red; Tuj1, cyan; DAPI, blue. (H) Hindlimb Basso-Beattie-Bresnahan scores. (I) Relative corresponding signals of hindlimb strengths were recorded by the pressure sensorat 8 weeks post-SCI. (J) Inclined plane assay results at 8 weeks post-SCI for the indicated animal groups (n = 3 per group).

References

    1. Cristante A.F., Barros Filho T.E., Marcon R.M., Letaif O.B., Rocha I.D. Therapeutic approaches for spinal cord injury. Clinics. 2012;67(10):1219–1224. doi: 10.6061/clinics/2012(10)16. - DOI - PMC - PubMed
    1. Injury G.B.D.T.B. C. Spinal Cord Injury, Global, regional, and national burden of traumatic brain injury and spinal cord injury, 1990-2016: a systematic analysis for the global burden of disease study 2016. Lancet Neurol. 2019;18(1):56–87. doi: 10.1016/S1474-4422(18)30415-0. - DOI - PMC - PubMed
    1. Alizadeh A., Dyck S.M., Karimi-Abdolrezaee S. Traumatic spinal cord injury: an overview of pathophysiology, models and acute injury mechanisms. Front. Neurol. 2019;10:282. doi: 10.3389/fneur.2019.00282. - DOI - PMC - PubMed
    1. Shen H., Fan C., You Z., Xiao Z., Zhao Y., Dai J. Advances in biomaterial-based spinal cord injury repair. Adv. Funct. Mater. 2022;32(13) doi: 10.1002/adfm.202110628. - DOI
    1. Zhang Y., Al Mamun A., Yuan Y., Lu Q., Xiong J., Yang S., Wu C., Wu Y., Wang J. Acute spinal cord injury: pathophysiology and pharmacological intervention (review) Mol. Med. Rep. 2021;23(6):1–18. doi: 10.3892/mmr.2021.12056. - DOI - PMC - PubMed

LinkOut - more resources