

Pharmacokinetic modelling of orally administered cannabidiol and implications for medication control in horses
- PMID: 37621871
- PMCID: PMC10445762
- DOI: 10.3389/fvets.2023.1234551
Pharmacokinetic modelling of orally administered cannabidiol and implications for medication control in horses
Abstract
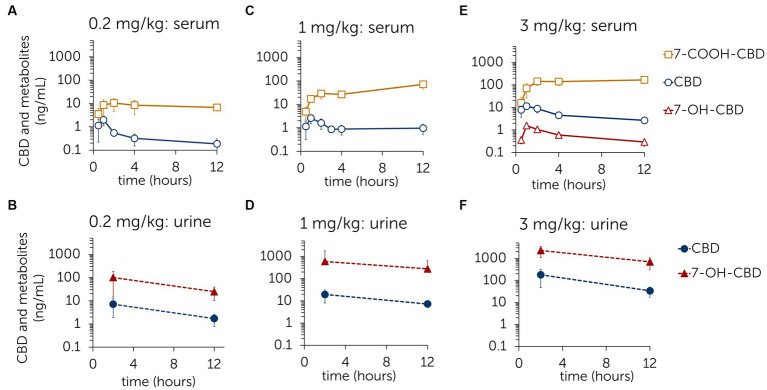
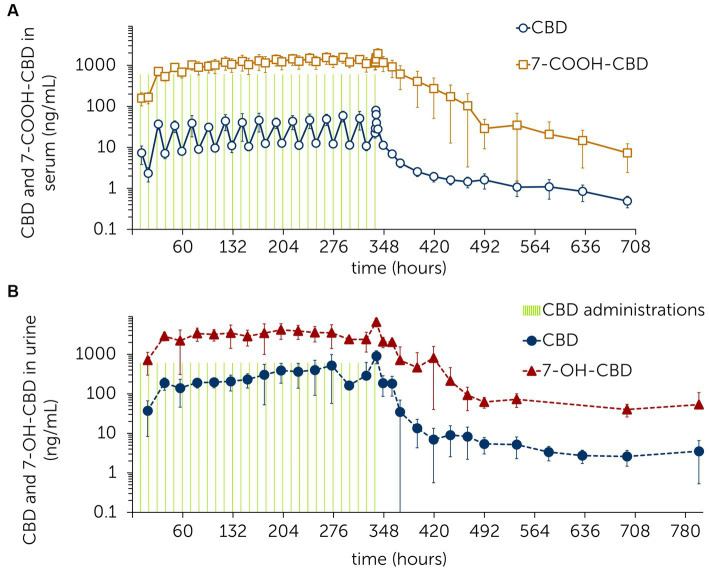
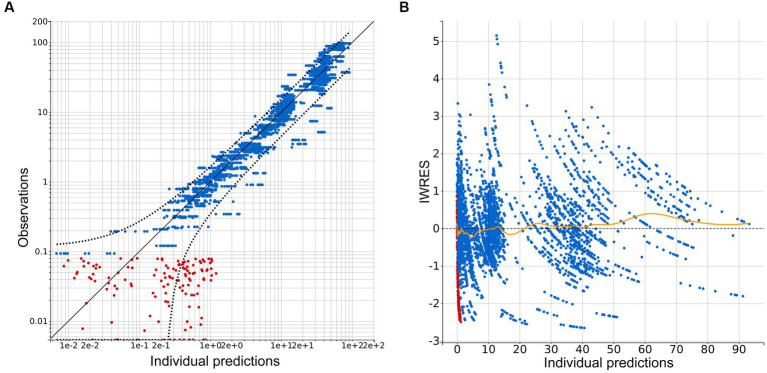
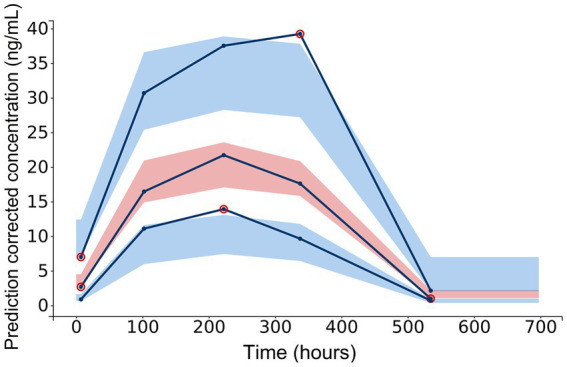
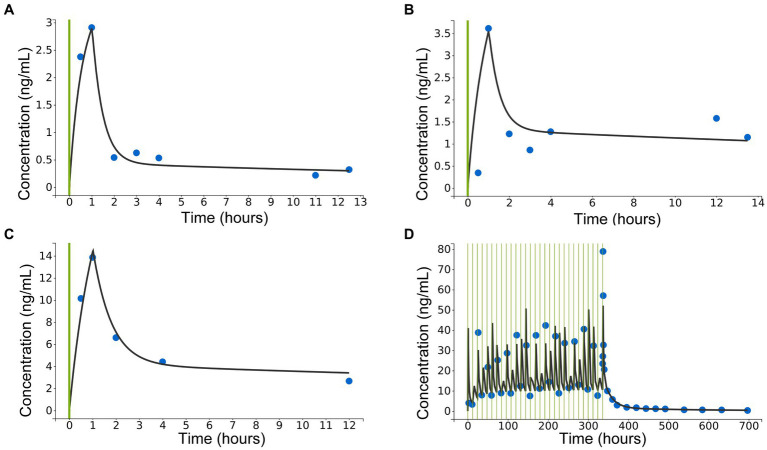
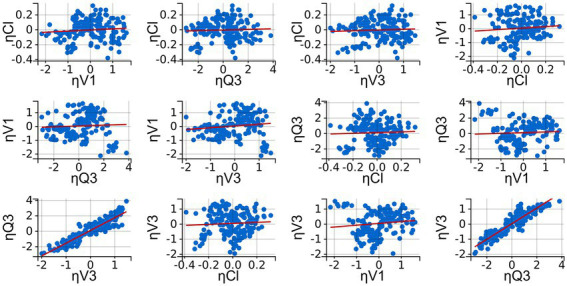
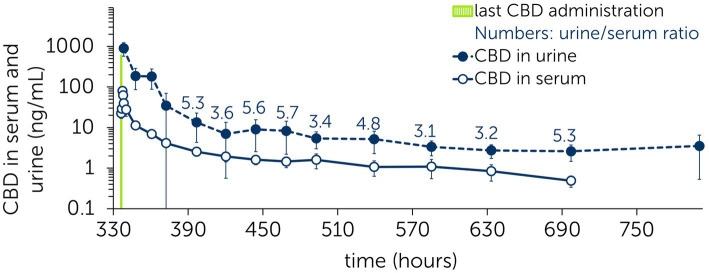
Cannabidiol (CBD) products gain increasing popularity amongst animal owners and veterinarians as an alternative remedy for treatment of stress, inflammation or pain in horses. Whilst the use of cannabinoids is banned in equine sports, there is limited information available concerning CBD detection times in blood or urine. The aim of this study was to determine the pharmacokinetic properties of CBD following oral administration in the horse to assist doping control laboratories with interpreting CBD analytical results. Part 1: dose escalation study: Single oral administration of three escalating doses of CBD paste (0.2 mg/kg, n = 3 horses; 1 mg/kg, n = 3; 3 mg/kg, n = 5) with >7 days wash-out periods in between. Part 2: multiple dose study: oral administration of CBD paste (3 mg/kg, n = 6) twice daily for 15 days. Multiple blood and urine samples were collected daily throughout both studies. Following study part 2, blood and urine samples were collected for 2 weeks to observe the elimination phase. Concentrations of CBD, its metabolites and further cannabinoids were evaluated using gas-chromatography/tandem-mass-spectrometry. Pharmacokinetic parameters were assessed via two approaches: population pharmacokinetic analysis using a nonlinear mixed-effects model and non-compartmental analysis. AUC0-12 h and Cmax were tested for dose proportionality. During the elimination phase, the CBD steady-state urine to serum concentration ratio (Rss) was calculated. Oral CBD medication was well-tolerated in horses. Based on population pharmacokinetics, a three-compartment model with zero-order absorption most accurately described the pharmacokinetic properties of CBD. High volumes of distribution into peripheral compartments and high concentrations of 7-carboxy-CBD were observed in serum. Non-compartmental analysis identified a Cmax of 12.17 ± 2.08 ng/mL after single administration of CBD (dose: 3 mg/kg). AUC0-12 h showed dose proportionality, increase for Cmax leveled off at higher doses. Following multiple doses, the CBD terminal half-life was 161.29 ± 43.65 h in serum. Rss was 4.45 ± 1.04. CBD is extensively metabolized and shows high volumes of tissue distribution with a resulting extended elimination phase. Further investigation of the potential calming and anti-inflammatory effects of CBD are required to determine cut-off values for medication control using the calculated Rss.
Keywords: CBD; Monolix; NLME model; PK; cannabinoids; doping; drug control; equine.
Copyright © 2023 Eichler, Poźniak, Machnik, Schenk, Wingender, Baudisch, Thevis, Bäumer, Lischer and Ehrle.
Conflict of interest statement
The authors declare that the research was conducted in the absence of any commercial or financial relationships that could be construed as a potential conflict of interest.
Figures
Similar articles
-
Behavioral observations, heart rate and heart rate variability in horses following oral administration of a cannabidiol containing paste in three escalating doses (part 1/2).Front Vet Sci. 2023 Dec 11;10:1305868. doi: 10.3389/fvets.2023.1305868. eCollection 2023. Front Vet Sci. 2023. PMID: 38149295 Free PMC article.
-
Pharmacokinetic Evaluation of a Cannabidiol Supplement in Horses.J Equine Vet Sci. 2022 Mar;110:103842. doi: 10.1016/j.jevs.2021.103842. Epub 2021 Dec 17. J Equine Vet Sci. 2022. PMID: 34923070
-
A Phase I, Randomized, Double-Blind, Placebo-Controlled, Single Ascending Dose, Multiple Dose, and Food Effect Trial of the Safety, Tolerability and Pharmacokinetics of Highly Purified Cannabidiol in Healthy Subjects.CNS Drugs. 2018 Nov;32(11):1053-1067. doi: 10.1007/s40263-018-0578-5. CNS Drugs. 2018. PMID: 30374683 Free PMC article. Clinical Trial.
-
Model-Based Analysis of Cannabidiol Dose-Exposure Relationship and Bioavailability.Pharmacotherapy. 2020 Apr;40(4):291-300. doi: 10.1002/phar.2377. Epub 2020 Mar 10. Pharmacotherapy. 2020. PMID: 32058609
-
Veterinary medicines and competition animals: the question of medication versus doping control.Handb Exp Pharmacol. 2010;(199):315-39. doi: 10.1007/978-3-642-10324-7_13. Handb Exp Pharmacol. 2010. PMID: 20204593 Review.
Cited by
-
Endocannabinoid system and phytocannabinoids in the main species of veterinary interest: a comparative review.Vet Res Commun. 2024 Oct;48(5):2915-2941. doi: 10.1007/s11259-024-10509-7. Epub 2024 Aug 20. Vet Res Commun. 2024. PMID: 39162768 Free PMC article. Review.
-
Pharmacokinetics of cannabidiol, (-)-trans-Δ9-tetrahydrocannabinol, and their oxidative metabolites after intravenous and oral administration of a cannabidiol-dominant full-spectrum hemp product to beagle dogs.Front Vet Sci. 2025 Apr 8;12:1556975. doi: 10.3389/fvets.2025.1556975. eCollection 2025. Front Vet Sci. 2025. PMID: 40264990 Free PMC article.
-
Behavioral observations, heart rate and heart rate variability in horses following oral administration of a cannabidiol containing paste in three escalating doses (part 1/2).Front Vet Sci. 2023 Dec 11;10:1305868. doi: 10.3389/fvets.2023.1305868. eCollection 2023. Front Vet Sci. 2023. PMID: 38149295 Free PMC article.
-
Cannabis sativa in veterinary medicine: Foundations and therapeutic applications.Can Vet J. 2024 Sep;65(9):948-958. Can Vet J. 2024. PMID: 39219599 Free PMC article. Review.
-
Role of cannabidiolic acid or the combination of cannabigerol/cannabidiol in pain modulation and welfare improvement in horses with chronic osteoarthritis.Front Vet Sci. 2024 Dec 10;11:1496473. doi: 10.3389/fvets.2024.1496473. eCollection 2024. Front Vet Sci. 2024. PMID: 39720409 Free PMC article.
References
LinkOut - more resources
Full Text Sources