Identifying immune cell infiltration and effective diagnostic biomarkers in Crohn's disease by bioinformatics analysis
- PMID: 37622114
- PMCID: PMC10445157
- DOI: 10.3389/fimmu.2023.1162473
Identifying immune cell infiltration and effective diagnostic biomarkers in Crohn's disease by bioinformatics analysis
Abstract
Background: Crohn's disease (CD) has an increasing incidence and prevalence worldwide. It is currently believed that both the onset and progression of the disease are closely related to immune system imbalance and the infiltration of immune cells. The aim of this study was to investigate the molecular immune mechanisms associated with CD and its fibrosis through bioinformatics analysis.
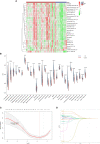
Methods: Three datasets from the Gene Expression Omnibus data base (GEO) were downloaded for data analysis and validation. Single sample gene enrichment analysis (ssGSEA) was used to evaluate the infiltration of immune cells in CD samples. Immune cell types with significant differences were identified by Wilcoxon test and Least Absolute Shrinkage and Selection Operator (LASSO) regression analysis. Differentially expressed genes (DEGs) were screened and then subjected to Gene Ontology (GO) and Kyoto Encyclopedia of Genes and Genomes (KEGG) functional correlation analysis, as well as protein-protein interaction (PPI) network analysis. The cytoHubba program and the GSE75214 dataset were used to screen for hub genes and plot Receiver operating characteristic (ROC)curves to screen for possible biomarkers of CD based on diagnostic efficacy. The hub genes of CD were correlated with five significantly different immune cells. In addition, validation was performed by real time quantitative PCR (RT-qPCR) experiments in colonic tissue of CD intestinal fibrosis rats to further identify hub genes that are more related to CD intestinal fibrosis.
Results: The DEGs were analyzed separately by 10 algorithms and narrowed down to 9 DEGs after taking the intersection. 4 hub genes were further screened by the GSE75214 validation set, namely COL1A1, CXCL10, MMP2 and FGF2. COL1A1 has the highest specificity and sensitivity for the diagnosis of CD and is considered to have the potential to diagnose CD. Five immune cells with significant differences were screened between CD and health controls (HC). Through the correlation analysis between five kinds of immune cells and four biomarkers, it was found that CXCL10 was positively correlated with activated dendritic cells, effector memory CD8+ T cells. MMP2 was positively correlated with activated dendritic cells, gamma delta T cells (γδ T) and mast cells. MMP2 and COL1A1 were significantly increased in colon tissue of CD fibrosis rats.
Conclusion: MMP2, COL1A1, CXCL10 and FGF2 can be used as hub genes for CD. Among them, COL1A1 can be used as a biomarker for the diagnosis of CD. MMP2 and CXCL10 may be involved in the development and progression of CD by regulating activated dendritic cell, effector memory CD8+ T cell, γδ T cell and mast cell. In addition, MMP2 and COL1A1 may be more closely related to CD intestinal fibrosis.
Keywords: Crohn’s disease; biomarker; fibrosis; immune cells; ssGSEA.
Copyright © 2023 Huang, Wang, Chen, Chai, Qi, Zheng, Chen, Wu and Liu.
Conflict of interest statement
The authors declare that the research was conducted in the absence of any commercial or financial relationships that could be construed as a potential conflict of interest.
Figures


Similar articles
-
Identification of hub programmed cell death-related genes and immune infiltration in Crohn's disease using bioinformatics.Front Genet. 2024 Dec 18;15:1425062. doi: 10.3389/fgene.2024.1425062. eCollection 2024. Front Genet. 2024. PMID: 39744064 Free PMC article.
-
Bioinformatics analysis of the immune cell infiltration characteristics and correlation with crucial diagnostic markers in pulmonary arterial hypertension.BMC Pulm Med. 2023 Aug 15;23(1):300. doi: 10.1186/s12890-023-02584-4. BMC Pulm Med. 2023. PMID: 37582718 Free PMC article.
-
Identifying Immune Cell Infiltration and Effective Diagnostic Biomarkers in Rheumatoid Arthritis by Bioinformatics Analysis.Front Immunol. 2021 Aug 13;12:726747. doi: 10.3389/fimmu.2021.726747. eCollection 2021. Front Immunol. 2021. PMID: 34484236 Free PMC article.
-
Integrated bioinformatics and network pharmacology identifying the mechanisms and molecular targets of Guipi Decoction for treatment of comorbidity with depression and gastrointestinal disorders.Metab Brain Dis. 2024 Jan;39(1):183-197. doi: 10.1007/s11011-023-01308-1. Epub 2023 Oct 17. Metab Brain Dis. 2024. PMID: 37847347 Review.
-
Identification of oxidative stress-related diagnostic markers and immune infiltration features for idiopathic pulmonary fibrosis by bibliometrics and bioinformatics.Front Med (Lausanne). 2024 Aug 6;11:1356825. doi: 10.3389/fmed.2024.1356825. eCollection 2024. Front Med (Lausanne). 2024. PMID: 39165378 Free PMC article. Review.
Cited by
-
Microprotein-encoding RNA regulation in cells treated with pro-inflammatory and pro-fibrotic stimuli.BMC Genomics. 2024 Nov 5;25(1):1034. doi: 10.1186/s12864-024-10948-1. BMC Genomics. 2024. PMID: 39497054 Free PMC article.
-
Food-Protein-Induced Proctocolitis in Pre-Term Newborns with Bloody Stools in a Neonatal Intensive Care Unit.Nutrients. 2024 Sep 9;16(17):3036. doi: 10.3390/nu16173036. Nutrients. 2024. PMID: 39275351 Free PMC article.
-
Dendritic cells: the yin and yang in disease progression.Front Immunol. 2024 Jan 4;14:1321051. doi: 10.3389/fimmu.2023.1321051. eCollection 2023. Front Immunol. 2024. PMID: 38239364 Free PMC article. Review.
-
Validation of Biomarkers and Immunotherapy With Crohn's Disease Using WGCNA and Two-Sample Mendelian Randomization Study.Gastroenterol Res Pract. 2025 Jul 1;2025:8194480. doi: 10.1155/grp/8194480. eCollection 2025. Gastroenterol Res Pract. 2025. PMID: 40630894 Free PMC article.
-
Key Disease-Related Genes and Immune Cell Infiltration Landscape in Inflammatory Bowel Disease: A Bioinformatics Investigation.Int J Mol Sci. 2024 Sep 9;25(17):9751. doi: 10.3390/ijms25179751. Int J Mol Sci. 2024. PMID: 39273699 Free PMC article.
References
-
- Ng SC, Shi HY, Hamidi N, Underwood FE, Tang W, Benchimol EI, et al. . Worldwide incidence and prevalence of inflammatory bowel disease in the 21st century: a systematic review of population-based studies. Lancet (London England). (2017) 390(10114):2769–78. doi: 10.1016/S0140-6736(17)32448-0 - DOI - PubMed
-
- Wu Kc, Liang J, Ran Zh, Qian JM, Yang H, Chen MH, et al. . Consensus on diagnosis and treatment of inflammatory bowel disease (2018, Beijing). Chin J Digestion (2018) 38(5):292–311. doi: 10.19538/j.nk2018090106 - DOI
Publication types
MeSH terms
Substances
LinkOut - more resources
Full Text Sources
Medical
Research Materials
Miscellaneous

