. 2023 Aug 9:14:1179742.
doi: 10.3389/fimmu.2023.1179742. eCollection 2023.

Identification of cuproptosis and immune-related gene prognostic signature in lung adenocarcinoma

Affiliations

Identification of cuproptosis and immune-related gene prognostic signature in lung adenocarcinoma

Wentao Zhang et al. Front Immunol. .

Abstract

Background: Cuproptosis is a novel form of programmed cell death that differs from other types such as pyroptosis, ferroptosis, and autophagy. It is a promising new target for cancer therapy. Additionally, immune-related genes play a crucial role in cancer progression and patient prognosis. Therefore, our study aimed to create a survival prediction model for lung adenocarcinoma patients based on cuproptosis and immune-related genes. This model can be utilized to enhance personalized treatment for patients.

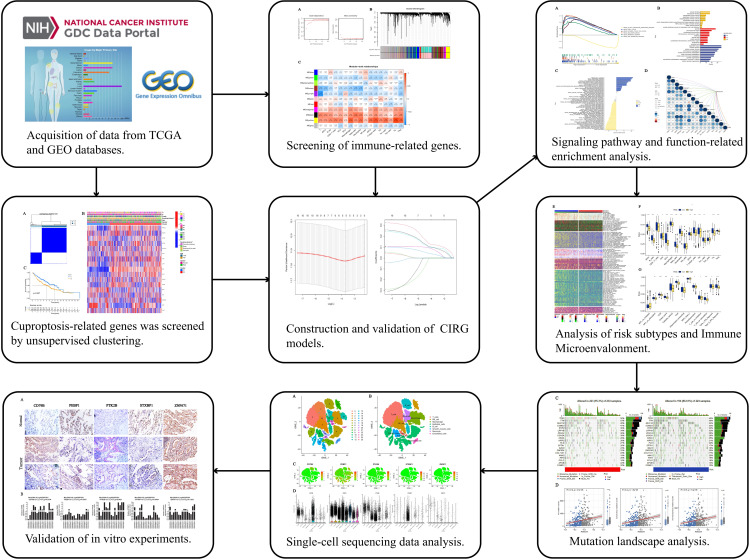
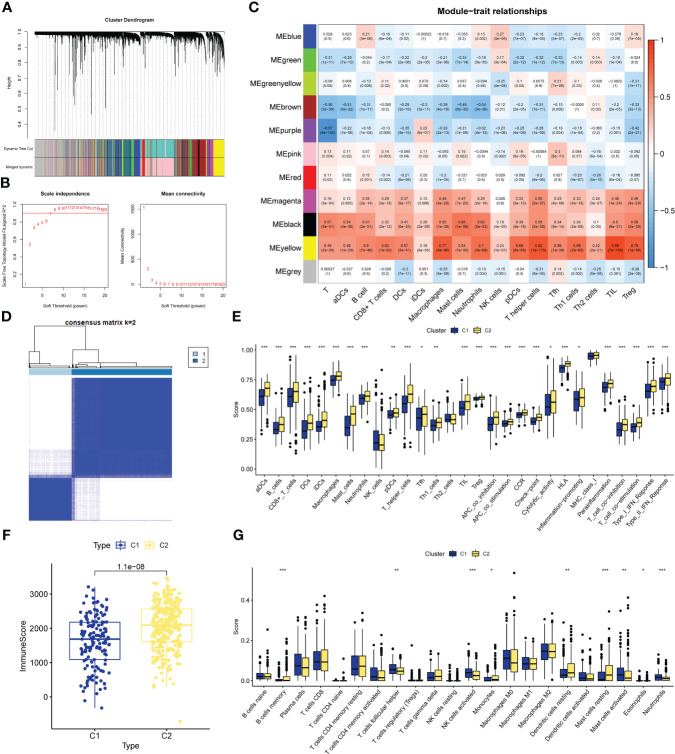
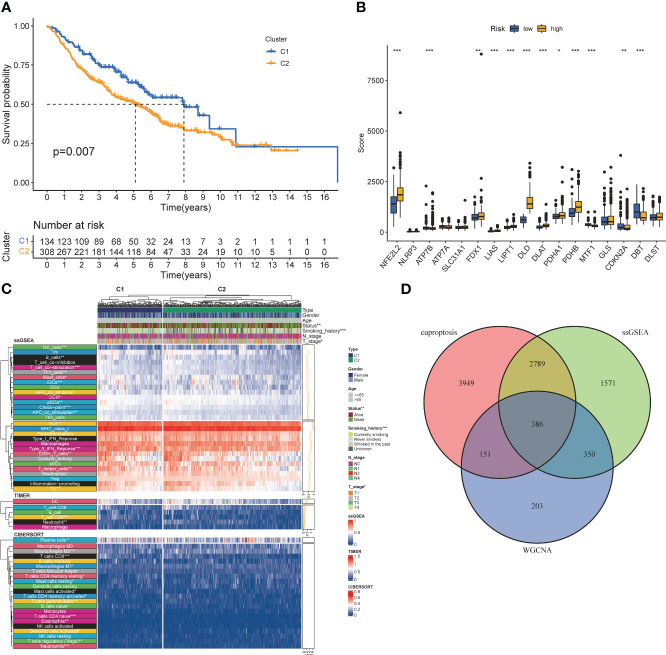
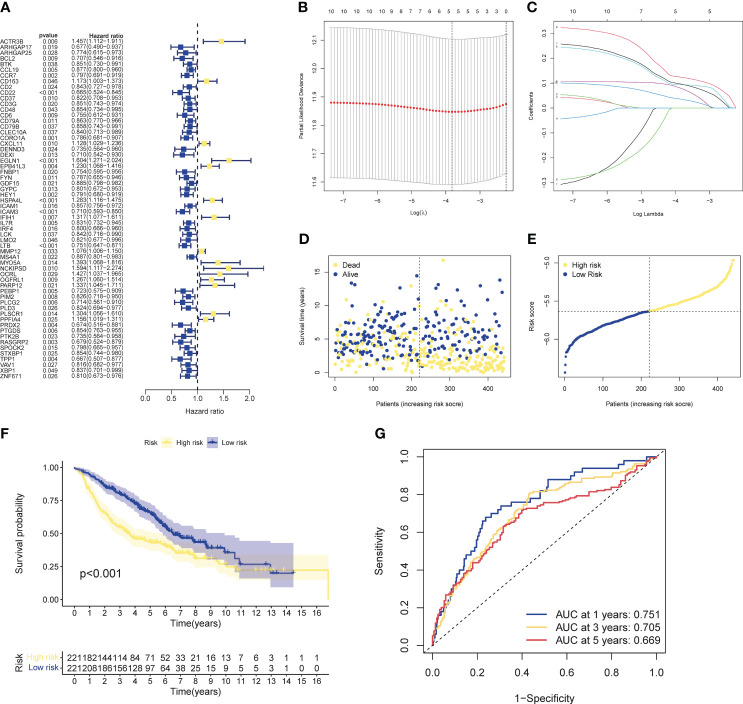
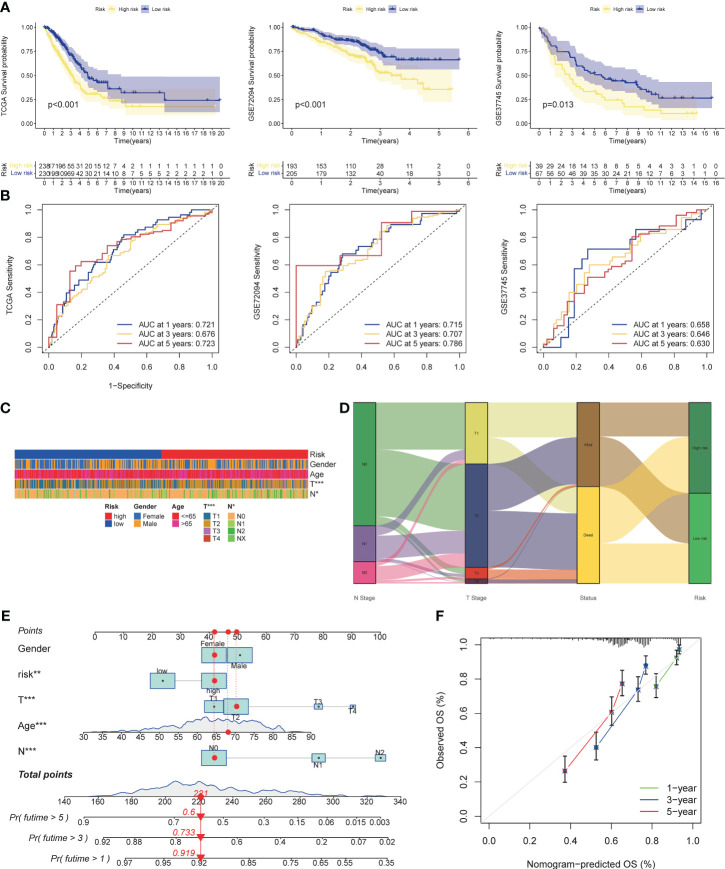
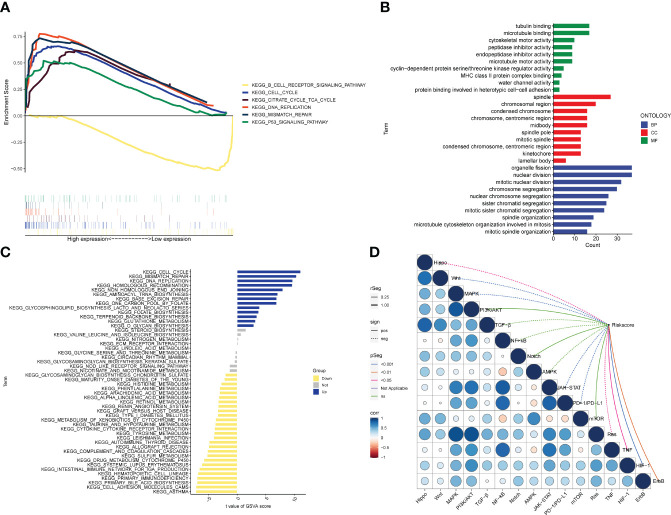
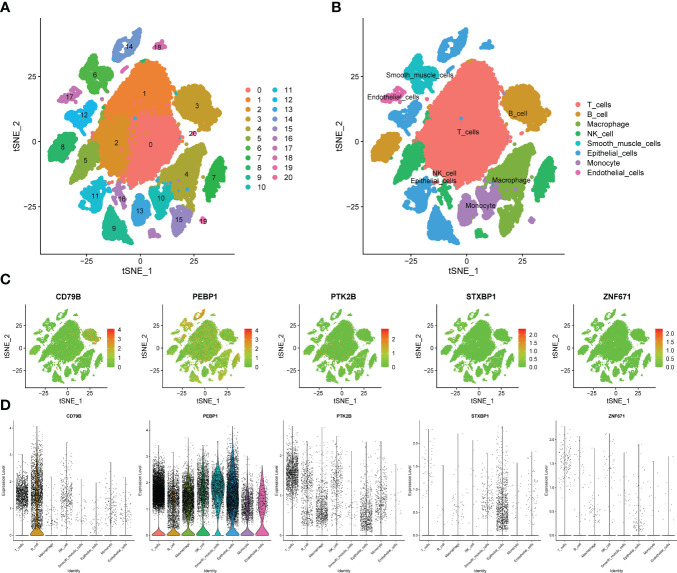
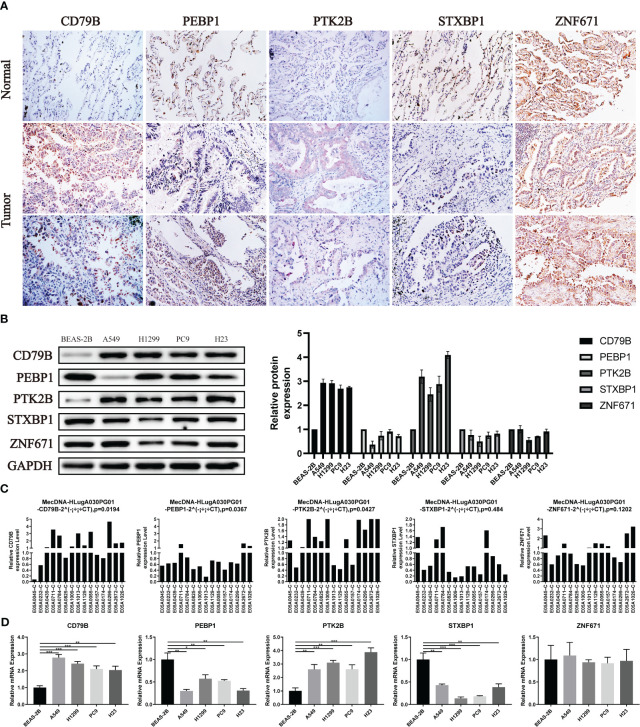
Methods: RNA sequencing (RNA-seq) data of lung adenocarcinoma (LUAD) patients were collected from The Cancer Genome Atlas (TCGA) and Gene Expression Omnibus (GEO) databases. The levels of immune cell infiltration in the GSE68465 cohort were determined using gene set variation analysis (GSVA), and immune-related genes (IRGs) were identified using weighted gene coexpression network analysis (WGCNA). Additionally, cuproptosis-related genes (CRGs) were identified using unsupervised clustering. Univariate COX regression analysis and least absolute shrinkage selection operator (LASSO) regression analysis were performed to develop a risk prognostic model for cuproptosis and immune-related genes (CIRGs), which was subsequently validated. Various algorithms were utilized to explore the relationship between risk scores and immune infiltration levels, and model genes were analyzed based on single-cell sequencing. Finally, the expression of signature genes was confirmed through quantitative real-time PCR (qRT-PCR), immunohistochemistry (IHC), and Western blotting (WB).

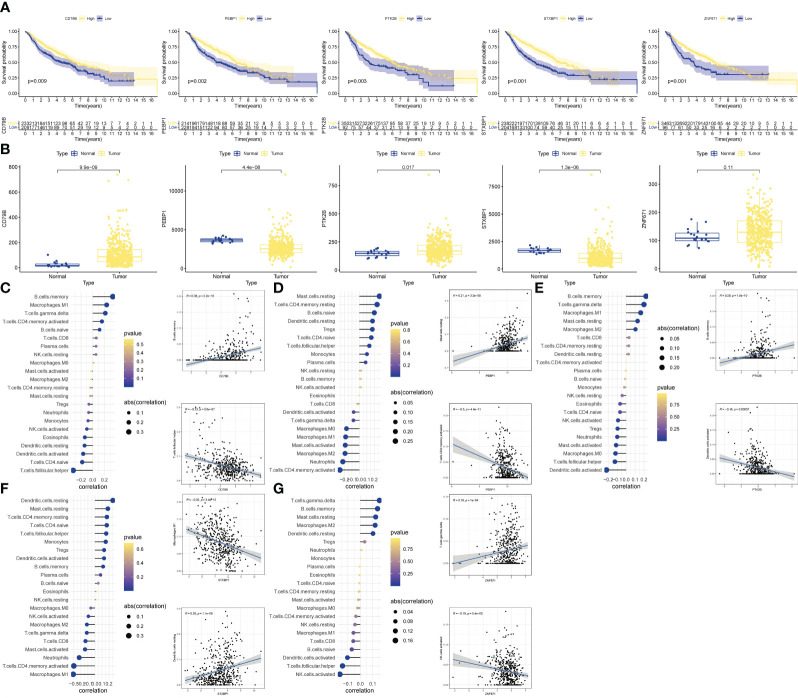
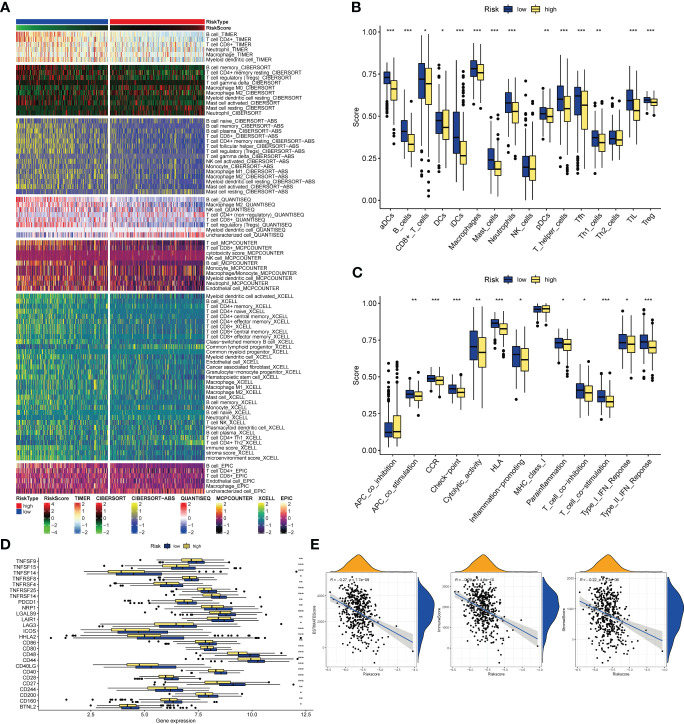
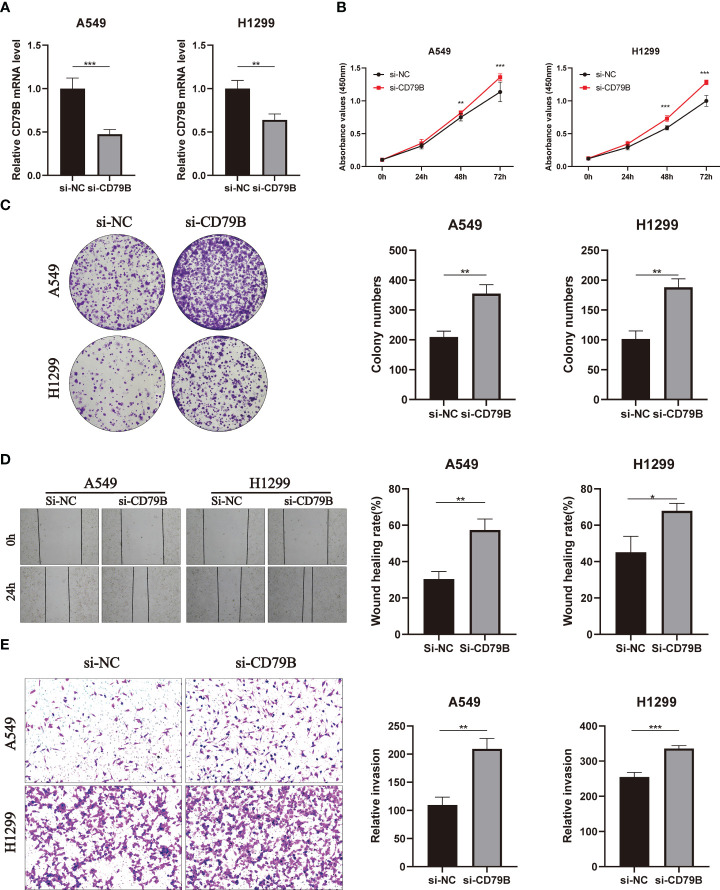
Results: We have identified 5 Oncogenic Driver Genes namely CD79B, PEBP1, PTK2B, STXBP1, and ZNF671, and developed proportional hazards regression models. The results of the study indicate significantly reduced survival rates in both the training and validation sets among the high-risk group. Additionally, the high-risk group displayed lower levels of immune cell infiltration and expression of immune checkpoint compared to the low-risk group.

Keywords: LUAD; cuproptosis; immune; prognosis; signature.


Conflict of interest statement

The authors declare that the research was conducted in the absence of any commercial or financial relationships that could be construed as a potential conflict of interest.

Figures

Figure 1
Figure 1
Work flow of the study. This figure shows the construction process and subsequent analysis of the CIRG model. *P<0.05, **P<0.01, ***P<0.001.
Figure 2
Figure 2
CIRG were screened by WGCNA. (A) The distribution and trends of the scale free topology model fit and meanconnectivity along with soft threshold. (B) The clustering of genes among different modules by the dynamic trees cut andmerged dynamic method. The gray modules represent unclassified genes. (C) Average correlation between multiplemodules and tumor development, levels of immune cell infiltration. The color of the cell indicates the strength of thecorrelation and the number in parentheses indicates the P-value for the correlation test. (D) Consensus clustering matrix with K-2:443 lung adenocarcinoma patient were divided into two cuproptosis-related cluster. (E–G) Different sis of immune fractions in SSGSEA, Estimate. Cibersort in immune-related clusters. *P<0.05, **P<0.01, ***P<0.001.
Figure 3
Figure 3
Co-screening ofCIRGS by WGCNA and cuproptosis clustering. (A) Kaplan-Meier survival curves for patients in the two clusters. (B) Differences in the expression of cuprotosis-related genes between the two clusters. (C) CRGs-related clusters differed in the abundance ofimmune cell infiltrates. (D) Through WGCNA SSGSEA. unsupervised clustering and other algorithms, a total of 386 CIRGs was obtained. *P<0.05, **P<0.01, ***P<0.001.
Figure 4
Figure 4
Development of risk profiles in LUAD patients collected from the GEO cohort GSE68465. (A) Univariate Coxregression of 44 GIRGs in LUAD. (B) LASSO regression of the top 10 CIRGs with survival weights screened by machine learning. (C) Cross-validation in the LASSO regression for optimizing parameter selection. (D) Distribution of LUAD patients based on risk scores. (E) Distributions of OS status, OS and risk scores. (F) KM curves for OS of LUAD patients in different clusters. (G) ROC curves of this signature.
Figure 5
Figure 5
Validation of risk models, prognostic clinical value and nomogram. (A) Survival curves of high and low risk group in the validation set (TCGA cohort, GSE37745). (B) AUC values of ROC curves for risk scores in the validation set (TCGA cohort, GSE72094, GSE37745). (C) Different stratification of clinical phenotypes in the high- and – low-risk groups. (D) Connection among the risk subtypes, vital status, T stage and N stage stratification. (E) Nomogram for 1-3,and 5-years overall survival prediction. The red line show an example of how to predict the prognosis. (F) Calibration plots for agreement tests between predicted and actual OS. *P<0.05, **P<0.01, ***P<0.001.
Figure 6
Figure 6
Validation of OCIRGS. (A) Kaplan-Meier curves of OS for high- and low-risk patients in the training sets and merged validation sets. (B) Expression changes of OCIRGS between normal and tumor tissues. (C–G) Associations between OCFRGs and immune-infiltrating levels. The color represents the significance. The greener, the more significant. The circle size represents the correlation coefficients.
Figure 7
Figure 7
Biological functions. (A) Significant enriched pathways in the high- and low-risk groups. The extremum located in the left part indicates a positive association between risk scores and pathway activity, and vice versa. (B) Barplot graph for GO enrichment, with bar length representing the degree of enrichment and color representing the degree of difference. (C) There were significant differences in pathways between high and low risk groups. The blue bars represent a positive correlation between risk scores and pathway activity, and the opposite is true for yellow bars. (D) Correlations between Riskscore and important pathways in tumors.
Figure 8
Figure 8
Immune-related analysis. (A) The relationships of risk and tumor immune-infiltrations according to the evidence from the TIMER database. (B, C) The differences of tumor infiltrating of 16 cell types and score of immune pathways between the risk groups by ssGSEA. The lines in the boxes represent the median values. The black dots represent outliers. Asterisks indicate significance. (D) The differences of expression level of immune checkpoints between the high-and-low-risk subtypes. The lines inside the boxes represent the median values, and the lines outsides the boxes indicate the 95% confidence interval. (E) The correlation between tumor purity and risk scores. The blue lines represent ftted lines, and the gray area represents the 95% confidence interval. The mountain graphs at the top and stuck to the right represent the density of distribution. *P<0.05, **P<0.01, ***P<0.001.
Figure 9
Figure 9
Verification of OCIRGs through sc-RNA seq. (A, B) tSNE plots of cells generated from LUAD tissue. The plots are colored by cell cluster, and the cells are clustered into 8 sub-clusters. Each dot represents a LUAD cell. (C) The expression of signature genes in LUAD visualized in tSNE. (D) Violin plots depicting the expression of signature genes in clusters of LUAD. The y axis shows the normalized read count. t-SNE:t-distributed stochastic neighbor embedding.
Figure 10
Figure 10
Verification of OCIRGS expression. (A) IHC verification of the expression level of OCIRGS in the LUAD tissue and surrounding tissue. (B) Western Bloting verifies the expression of OCIRGS in 1 normal cell strain and three types of LC cells. (C, D) PCR verification OCIRGS’s expression level. *P<0.05, **P<0.01, ***P<0.001.
Figure 11
Figure 11
Validates the role of the key gene CD79B in lung cancer cell lines in vitro. (A) Knockdown of CD79B significantly reduced its expression in A549 and h1299 cell lines (**P<0.01, **P<0.001). (B) After CD79B knockdown in A549 and H1299 cell lines, the activity of lung adenocarcinoma cells was significantly enhanced (**P<0.01, *** (P<0.001). (C) Clonogenic assays showed a significant increase in the ability of A549 and H1299 cell lines to form colonies after CD79B knockdown (**P<0.01). (D) The si-NC group in the wound healing experiment of A549 and H1299 cell lines showed weaker migration ability than the si-CD79B group (*P<0.05, **P<0.01). (E) Knockdown of CD79B enhanced the invasion ability of A549 and H1299 cell lines (**P<0.01, *** (P<0.001).

References

    1. Ren J, Zhang H, Wang J, Xu Y, Zhao L, Yuan Q. Transcriptome analysis of adipocytokines and their-related LncRNAs in lung adenocarcinoma revealing the association with prognosis, immune infiltration, and metabolic characteristics. Adipocyte (2022) 11:250–65. doi: 10.1080/21623945.2022.2064956 - DOI - PMC - PubMed
    1. Graham GG. Human copper deficiency. N Engl J Med (1971) 285:857–8. doi: 10.1056/NEJM197110072851512 - DOI - PubMed
    1. Tang D, Chen X, Kroemer G. Cuproptosis: a copper-triggered modality of mitochondrial cell death. Cell Res (2022) 32:417–8. doi: 10.1038/s41422-022-00653-7 - DOI - PMC - PubMed
    1. Wang Y, Zhang L, Zhou F. Cuproptosis: a new form of programmed cell death. Cell Mol Immunol (2022) 19:867–8. doi: 10.1038/s41423-022-00866-1 - DOI - PMC - PubMed
    1. Duan W-J, He R-R. Cuproptosis: copper-induced regulated cell death. Sci China Life Sci (2022) 65:1680–2. doi: 10.1007/s11427-022-2106-6 - DOI - PubMed

Publication types

Substances