. 2023 Jan-Dec;15(1):2248672.
doi: 10.1080/19420862.2023.2248672.

Unique epitope-antibody interactions in the intrinsically disordered proteoglycan-like domain of human carbonic anhydrase IX defined by high-resolution NMR combined with yeast surface display

Affiliations

Unique epitope-antibody interactions in the intrinsically disordered proteoglycan-like domain of human carbonic anhydrase IX defined by high-resolution NMR combined with yeast surface display

Feng Ni et al. MAbs. 2023 Jan-Dec.

Abstract

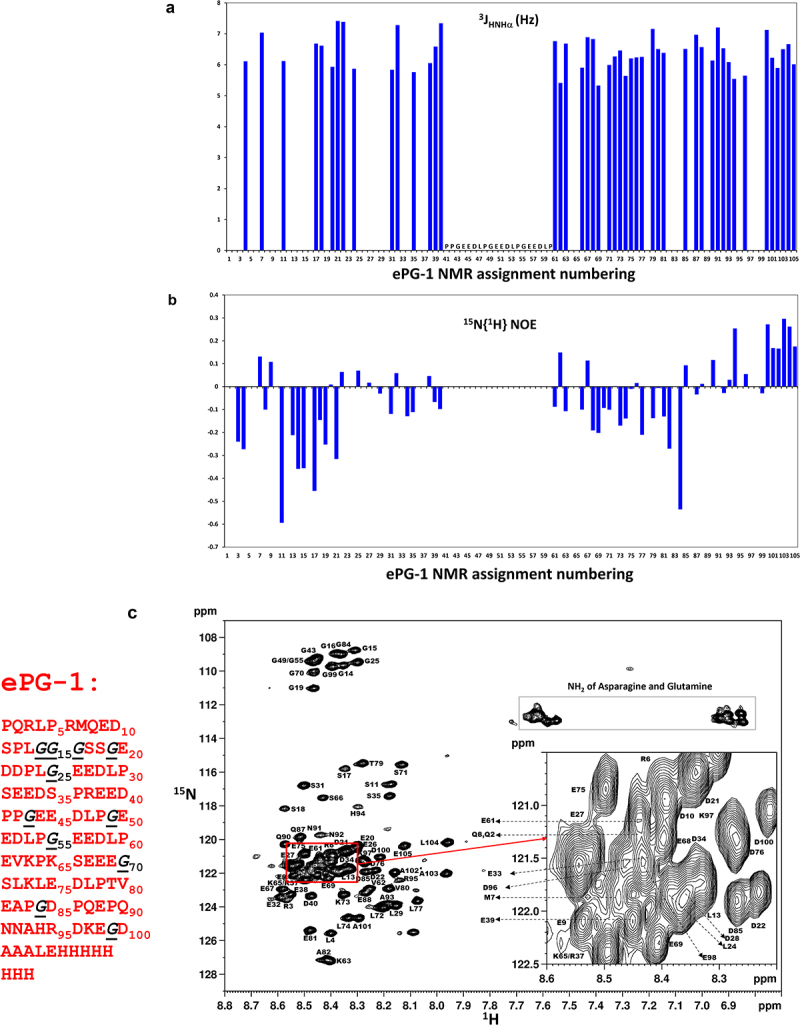
Carbonic anhydrase (CA)-IX is an extracellular enzyme that is essential in the adaptation of tumor cells to their increasingly more hypoxic and acidic microenvironment. Within the family of carbonic anhydrases, CA-IX is unique in that it is the only CA with an N-terminal intrinsically disordered region (IDR) containing a proteoglycan (PG)-like domain. This PG-like IDR has been described to be instrumental in CA-IX's enzyme activity, as well as tumor cell motility and invasion. We have characterized the antibody-epitope interactions of two novel and unique antibodies (11H9 and 12H8) that are specific for the human CA-IX's IDR. Binding interactions of these antibodies to the intact IDR were studied by surface plasmon resonance and high-resolution nuclear magnetic resonance (NMR) spectroscopy, while the specific epitopes were determined by both NMR and yeast surface display (YSD). Our data show that 12H8 binds to the N-terminus of CA-IX, while 11H9 has a high affinity for an epitope located in the central region of the IDR containing three GEEDLP repeats in a manner that is different from the previously described M75 antibody. Titration NMR spectroscopy using CA-IX's entire IDR in addition identified a secondary epitope of 11H9 at the beginning of the PG-like domain that remains exposed and available for further binding events after the engagement at its primary epitope at the center of the PG-like domain. Transverse relaxation optimized NMR spectroscopy of 11H9-F(Ab) in complex with the CA-IX IDR outlines structural rigidification of a linear epitope, while the rest of the IDR remains largely unstructured upon complex formation. This study illustrates how high-resolution NMR and YSD are used as complementary tools for a comprehensive characterization of antibody-epitope interactions involving intrinsically unstructured antigen domains with highly repetitive sequences.

Keywords: Antibodies; F(ab); NMR spectroscopy; antibody–antigen interactions; carbonic anhydrase IX; epitope mapping; intrinsically disordered proteins; yeast surface display.


Conflict of interest statement

No potential conflict of interest was reported by the author(s).

Figures

Three panels of SPR sensorgrams of four monoclonal antibodies (mAbs), M75, 2D7, 11H9, and 12H8 and the F(Ab) fragments of 11H9 and 12H8. Left panel (a) has the sensorgram of M75 on top with the typical fast on (loading) phase and slow off (dissociation) phase and 2D7 at the bottom with no SPR signal. Middle panel (b) compares the sensorgrams of 11H9 with a very slow off phase (top) and its F(Ab) fragment with a faster, but still slow, off phase (bottom). Right panel (c) illustrates the sensorgrams of 12H8 with a faster off phase (top) compared to 11H9 and its F(Ab) fragment with a fast phase of dissociation.
Figure 1.
SPR binding studies of the CA-IX mAbs and F(Ab)s to immobilized ePG-1 polypeptide. SPR sensorgrams of (a) mAb M75 and mAb 2D7, (b) mAb 11H9 and its F(Ab) fragment, and (c) mAb 12H8 and its F(Ab) fragment to the immobilized ePG-1 polypeptide. MAb 2D7, which binds to CA-IX’s catalytic domain, and mAb M75, which binds CA-IX’s PG domain were used as a negative and positive control, respectively. MAbs were flowed at 1.23, 3.7, 11.1, and 33.3 nM whereas F(Ab)s were flowed at 1.23, 3.7, 11.1, 33.3 and 100 nM over the chip surface with immobilized ePG-1.
Plots of the 3JHN,HA coupling constants at the top (a) and the 15N{1H} heteronuclear NOE values at the bottom (b) versus the assigned residues of 15N-labeled ePG-1. These plots have an empty region in the middle of the amino acid sequence of ePG-1 due to spectral overlaps and missing asignments. Sub-Figure c shows the 1H/15N-HSQC spectrum of 15N-labeled ePG-1 annotated by the assigned residues (on the right) and on the left displays the numbered amino acid sequence of ePG-1 used for NMR assignments.
Figure 2.
Solution conformation of ePG-1 characterized by NMR using backbone 3JHN,HA coupling constants, 15N{H} heteronuclear NOE measurements and detailed resonance assignments. (a) essentially uniform 3JHN,HA coupling constants (of 6–7 Hz) indicate largely random coil conformations for the ePG-1 backbone. (b) Small 15N{H} heteronuclear NOE values with excursions to negative values are also characteristic of unfolded polypeptide chains for ePG-1. NMR data for the central region of ePG-1 could not be analyzed due to overlaps of the 1H/N-HSQC signals of the highly repetitive sequence PPGEEDLPGEEDLPGEEDLP. The companion 15N longitudinal (T1) and transverse (T2) relaxation data are shown in SupplFig. S3B and SupplFig. S3C, respectively. (c) assigned HSQC spectrum of ePG-1. The amino acid sequence of ePG-1 (Table 1) is reproduced here with Pro (P37 of the hCA-IX sequence) as the first residue for the NMR assignment numbering. The italicized black font indicates the locations of the 11 Gly residues in the sequence of ePG-1. The inset details some signal assignments of the heavily overlapping region in the HSQC spectrum. A rectangular box outlines the side-chain amide HSQC signals of Asn and Gln residues. Two Gln residues, Q2 and Q8, and two Asn residues, N91 and N92 are located at the N-terminal and C-terminal regions of ePG-1, respectively.
Figure 3.
Figure 3.
(a) 1H/N-HSQC spectrum of ePG-1 responding to 12H8-F(Ab) binding with assignments of ePG-1 signals that perturbed and disappeared (shown in black) in the 1:1 complex. The inset shows the detailed responses of the 11 Gly signals with the disappearance of the signals of G14 and G16 of free ePG-1 (black) along with the appearance of two new HSQC signals for the complex (red). Signal movements in response to 12H8 binding were assigned tentatively as indicated by arrows in the inset, producing the chemical shift perturbations for G14, G15 and Gl6 in decreasing amplitudes. (b) Gly region of ePG-1 HSQC responding to 11H9-F(Ab) binding; the left-most panels show the superposition of the complex spectra with that of free ePG-1 (black) exemplifying the response of G25 while the right panels detailing Gly signal intensity evolutions from free ePG-1 (black) to the 1:1 (red), 1:2 (blue) and 1:5 (green) complexes, respectively. (c) Ser region of the ePG-1 HSQC spectrum responding to excess 11H9-F(Ab) binding, i.e., From 1:1 (red) to 1:2 (blue) and to 1:5 (green) for the ePG-1/F(Ab) ratio, respectively; free ePG-1 spectra are shown in black.
Plot of a region of the TROSY spectrum of ePG-1 annotated by the assigned residues of ePG-1 in its complex with the 11H9 F(Ab). The TROSY spectrum also contains many HSQC signals distributed within a narrow band of (NH) chemical shifts from 7.6 to 8.6 ppm.
Figure 4.
Amide 1H/N-TROSY NMR spectrum of 13C/N/H-labeled ePG-1 in a 1:1 stoichiometric complex with the 11H9-F(Ab) fragment. Well-dispersed signals are labeled with the respective residue assignments in the triple-labeled ePG-1. It should be noted that the remaining signals in the rest of this TROSY spectrum are similar in chemical shift positions to the 1H/N-HSQC spectra of free ePG-1 (see Fig. 2C).
Graphic illustration of CA-IX fragments studied by yeast surface display. Panel (a) shows how the displayed fragments cover the N-terminal (i.e., PG) region of CA-IX and (b) the plot of yeast ELISA of three monoclonal antibodies, 11H9, 12H8, and M75, showing the differing binding behaviors of the three antibodies to different CA-IX fragments. 11H9 has large ELISA readings for fragments 77–91, 87–101, 67-111, and 37–140; 12H8 for fragments 37–71 and 37–140; M75 with large ELISA readings for 57–71, 77–91, 37–71 and weaker, but non-negligible ELISA signals for fragments 87–101 and 107–121.
Figure 5.
Epitope mapping by yeast surface display strategy. (a) Cartoon depicting the CA-IX N-terminal fragments that were expressed on the cell surface of yeast. (b) ELISA results showing the yeast-displayed CA-IX fragments binding to mAb 11H9 (red), 12H8 (blue) and M75 (gray).
Display of the amino acid sequence of residues 37–140 along with the 12 15-aa overlapping peptide fragments, illustrating the differing epitope (binding) loci for the three antibodies, 12H8, 11H9, and M75. Panel (a) shows the binding epitope in the form of 15-residue fragments, while panel b outlines minimal epitope for each antibody identified by sequence truncation and alanine substitutions.
Figure 6.
Fine epitope mapping using yeast surface display (YSD). (a) Summary of antibody binding of yeast-displayed 15-residue tiling fragments of the CA-IX N-terminal region, residues 37–140. The colored sequences (12H8, green; 11H9, red, M75, blue) are the fragments within CA-IX IDR that showed the highest binding to each of the indicated antibodies by yeast cell ELISA (see Fig. 5). (b) Fine epitope mapping on 15-residue fragments that were identified to bind the antibodies through N-and C-terminal truncations to determine the “minimal” epitope followed by mutagenic alanine scan. Residues in large font and bold are those that do not tolerate alanine substitution indicating their critical role in antibody binding (see text for details).
Cartoon diagram illustrating the two possible binding modes between 11H9 and the ePG-1 polypeptide. In (a), the mAb 11H9 having two F(Ab)’s is shown to bind ePG-1 preferentially via the high-affinity binding site EDLPGEED, resulting in the 2:1 (PG:11H9) binding stoichiometry. (b) shows the cross-linking action of ePG-1 on 11H9 when their concentration ratio reaches 2:1 (PG:11H9) or below, leading to antibody aggregation.
Figure 7.
A schematic representation of the unique interactions of the 11H9 mAb with the ePG-1 polypeptide containing two epitopes. (a) the 2:1 (PG:11H9) complex is formed preferentially when the two combining sites of 11H9 are occupied by the high-affinity epitope EDLPGEED (shown in black circles), especially when the concentration of ePG-1 is higher than or equal to the 2:1 stoichiometry. With a concentration of ePG-1 at the 1:1 (PG:11H9) ratio, the same 2:1 (PG:11H9) complex is formed for 25% of the 11H9 concentration while 50% of 11H9 forms a 1:1 (PG:11H9) complex via the high-affinity epitope. The fraction of unoccupied 11H9 (25%) interacts with the low-affinity secondary epitope, e.g. DDPLGEED, exposed in the 2:1 (PG:11H9) complex (shown in pink), leading to differential HSQC signal perturbations of residues around this site (SupplFig. S4). Such a 2:1 (PG:11H9) complex can also be formed on SPR sensor chips with the ePG-1 polypeptide immobilized via its His-tag binding to surface-conjugated anti-His antibodies (see Materials and Methods), leading to the extremely slow rate of dissociation of 11H9 mAb from the sensor chip surface (Fig. 1b and SupplFig. S1B), (a) with a concentration of ePG-1 lower than the 2:1 stoichiometry, the insufficient spacing provided by ~ 22 residues between the high-affinity and low-affinity epitopes in ePG-1 favors intermolecular cross-linking or aggregation of the 1:1 PG:11H9 species, as evidenced by turbidity and precipitation in ePG-1/11H9 samples prepared at ~ 2:1 and ~ 1:1 ratios for the concentrations of ePG-1 and 11H9, respectively (see SupplFig. S4 for further details). The 2:1 (PG:11H9) complex species shown in (A) is also present in these (2:1 and 1:1) samples as detected by both 1H/N-HSQC (SupplFig. S4C/D/E/F) and by size-exclusion chromatography (SupplFig. S5) after removing the cross-linked and insoluble 11H9 aggregates by centrifugation.

Similar articles

Cited by

References

    1. Pastorekova S, Parkkila S, Pastorek J, Supuran CT.. Carbonic anhydrases: current state of the art, therapeutic applications and future prospects. J Enzyme Inhib Med Chem. 2004;19(3):199–15. PMID: 15499993. doi:10.1080/14756360410001689540. - DOI - PubMed
    1. Thiry A, Dogne JM, Masereel B, Supuran CT. Targeting tumor-associated carbonic anhydrase IX in cancer therapy. Trends Pharmacol Sci. 2006;27:566–73. doi:10.1016/j.tips.2006.09.002. PMID: 16996620. - DOI - PubMed
    1. Ihnatko R, Kubes M, Takacova M, Sedlakova O, Sedlak J, Pastorek J, Kopacek J, Pastorekova S. Extracellular acidosis elevates carbonic anhydrase IX in human glioblastoma cells via transcriptional modulation that does not depend on hypoxia. Int J Oncol. 2006;29:1025–33. PMID: 16964400 https://www.ncbi.nlm.nih.gov/pubmed/16964400. - PubMed
    1. Andreucci E, Peppicelli S, Carta F, Brisotto G, Biscontin E, Ruzzolini J, Bianchini F, Biagioni A, Supuran CT, Calorini L. Carbonic anhydrase IX inhibition affects viability of cancer cells adapted to extracellular acidosis. J Mol Med (Berl). 2017;95:1341–53. doi:10.1007/s00109-017-1590-9. PMID: 28929255. - DOI - PubMed
    1. Becker HM, Deitmer JW. Transport metabolons and acid/base balance in tumor cells. Cancers Basel. 2020;12(4):899. PMID: 32272695. doi:10.3390/cancers12040899. - DOI - PMC - PubMed

Publication types

LinkOut - more resources