

Does One Size Fit All? Variations in the DNA Barcode Gaps of Macrofungal Genera
- PMID: 37623559
- PMCID: PMC10455624
- DOI: 10.3390/jof9080788
Does One Size Fit All? Variations in the DNA Barcode Gaps of Macrofungal Genera
Abstract
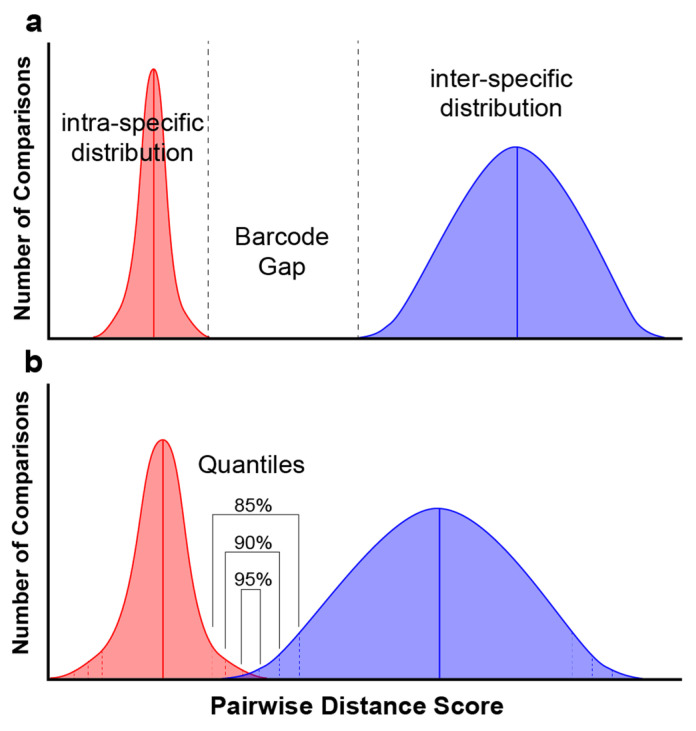
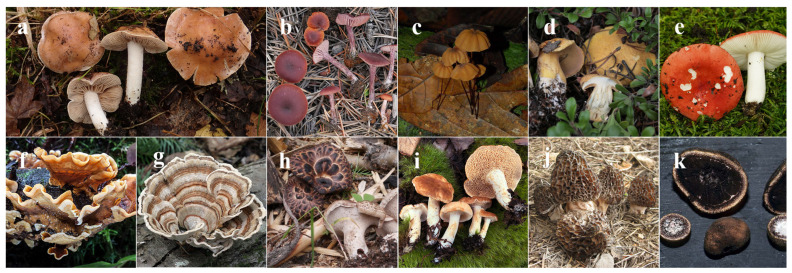
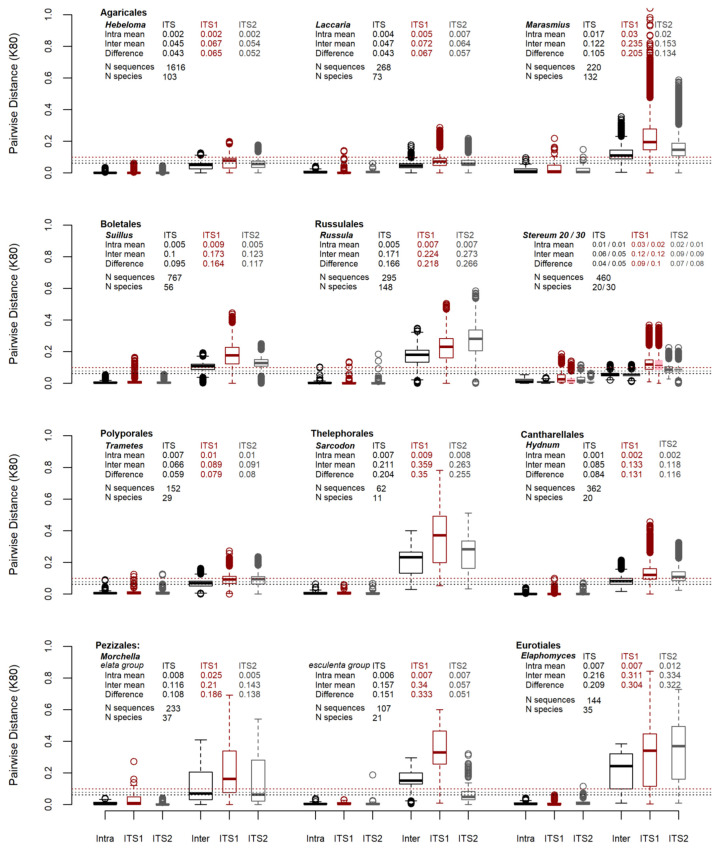
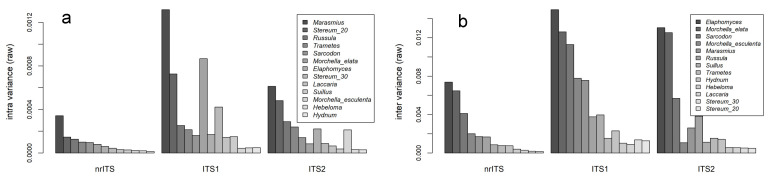
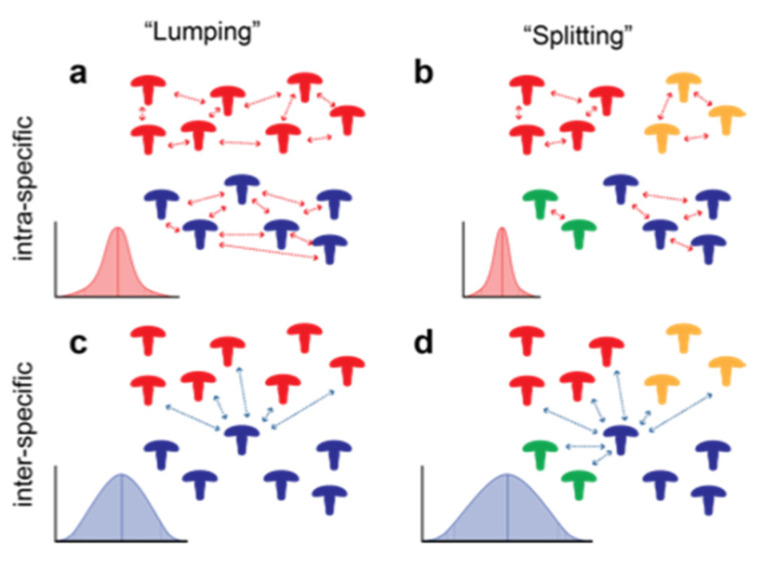
The nuclear ribosomal internal transcribed spacer (nrITS) region has been widely used in fungal diversity studies. Environmental metabarcoding has increased the importance of the fungal DNA barcode in documenting fungal diversity and distribution. The DNA barcode gap is seen as the difference between intra- and inter-specific pairwise distances in a DNA barcode. The current understanding of the barcode gap in macrofungi is limited, inhibiting the development of best practices in applying the nrITS region toward research on fungal diversity. This study examined the barcode gap using 5146 sequences representing 717 species of macrofungi from eleven genera, eight orders and two phyla in datasets assembled by taxonomic experts. Intra- and inter-specific pairwise distances were measured from sequence and phylogenetic data. The results demonstrate that barcode gaps are influenced by differences in intra- and inter-specific variance in pairwise distances. In terms of DNA barcode behavior, variance is greater in the ITS1 than ITS2, and variance is greater in both relative to the combined nrITS region. Due to the difference in variance, the barcode gaps in the ITS2 region are greater than in the ITS1. Additionally, the taxonomic approach of "splitting" taxa into numerous taxonomic units produces greater barcode gaps when compared to "lumping". The results show variability in the barcode gaps between fungal taxa, demonstrating a need to understand the accuracy of DNA barcoding in quantifying species richness. For taxonomic studies, variability in nrITS sequence data supports the application of multiple molecular markers to corroborate the taxonomic and systematic delineation of species.
Keywords: DNA barcode; ITS1; ITS2; nrITS; pairwise distances.
Conflict of interest statement
The authors declare no conflict of interest.
Figures
References
-
- Schoch C.L., Seifert K.A., Huhndorf S., Robert V., Spouge J.L., Levesque C.A., Chen W., Consortium F.B. Nuclear ribosomal internal transcribed spacer (ITS) region as a universal DNA barcode marker for Fungi. Proc. Natl. Acad. Sci. USA. 2012;109:6241–6246. doi: 10.1073/pnas.1117018109. - DOI - PMC - PubMed
-
- Lücking R., Aime M.C., Robbertse B., Miller A.N., Ariyawansa H.A., Aoki T., Cardinali G., Crous P.W., Druzhinina I.S., Geiser D.M. Unambiguous identification of fungi: Where do we stand and how accurate and precise is fungal DNA barcoding? IMA Fungus. 2020;11:1–32. doi: 10.1186/s43008-020-00033-z. - DOI - PMC - PubMed
-
- Nilsson R.H., Kristiansson E., Ryberg M., Hallenberg N., Larsson K.-H. Intraspecific ITS variability in the Kingdom Fungi as expressed in the international sequence databases and its implications for molecular species identification. Evol. Bioinform. 2008;4:193–201. doi: 10.4137/EBO.S653. - DOI - PMC - PubMed
LinkOut - more resources
Full Text Sources
Miscellaneous
