. 2023 Aug 21;13(8):965.
doi: 10.3390/metabo13080965.

Liver Metabolomics and Inflammatory Profiles in Mouse Model of Fentanyl Overdose Treated with Beta-Lactams

Affiliations

Liver Metabolomics and Inflammatory Profiles in Mouse Model of Fentanyl Overdose Treated with Beta-Lactams

Fawaz Alasmari et al. Metabolites. .

Abstract

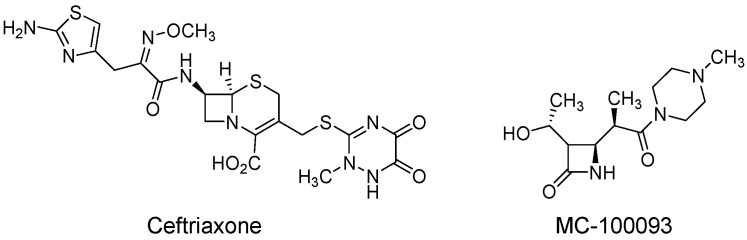
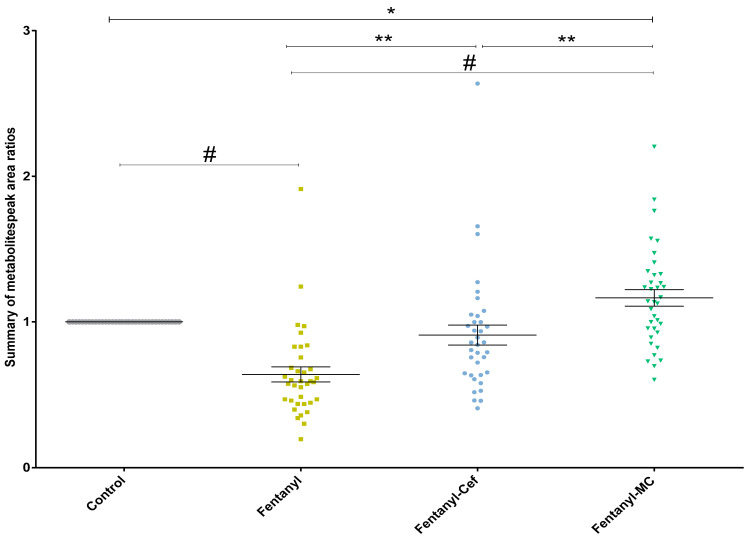
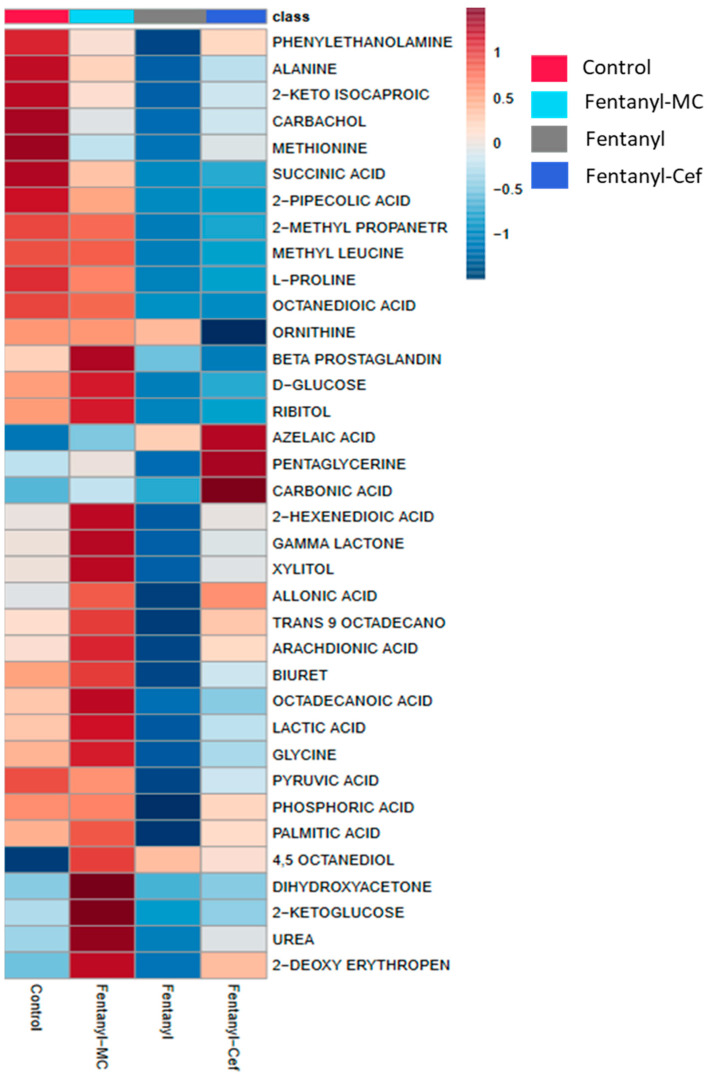
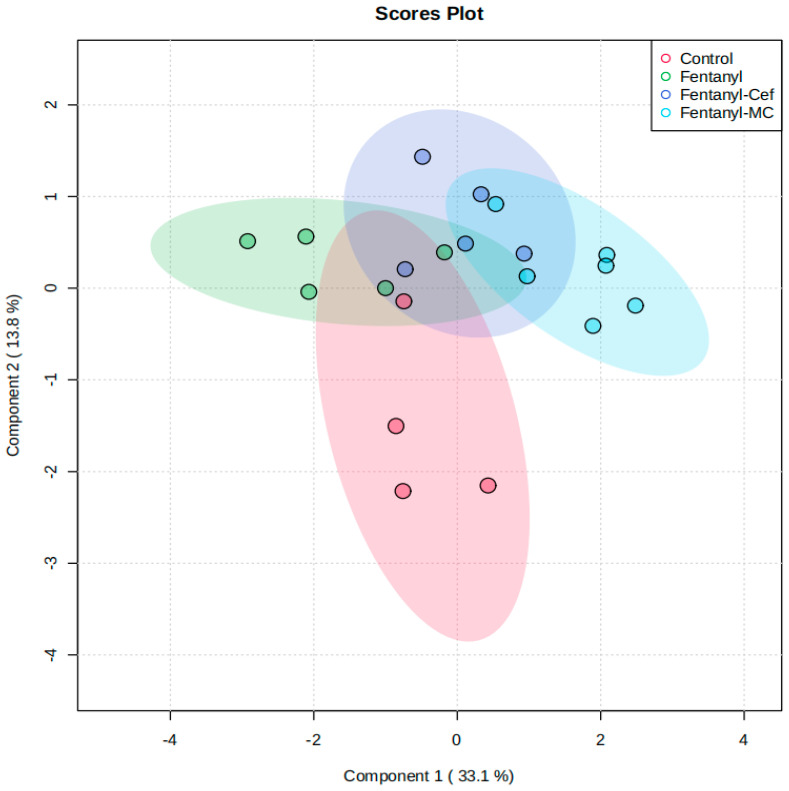
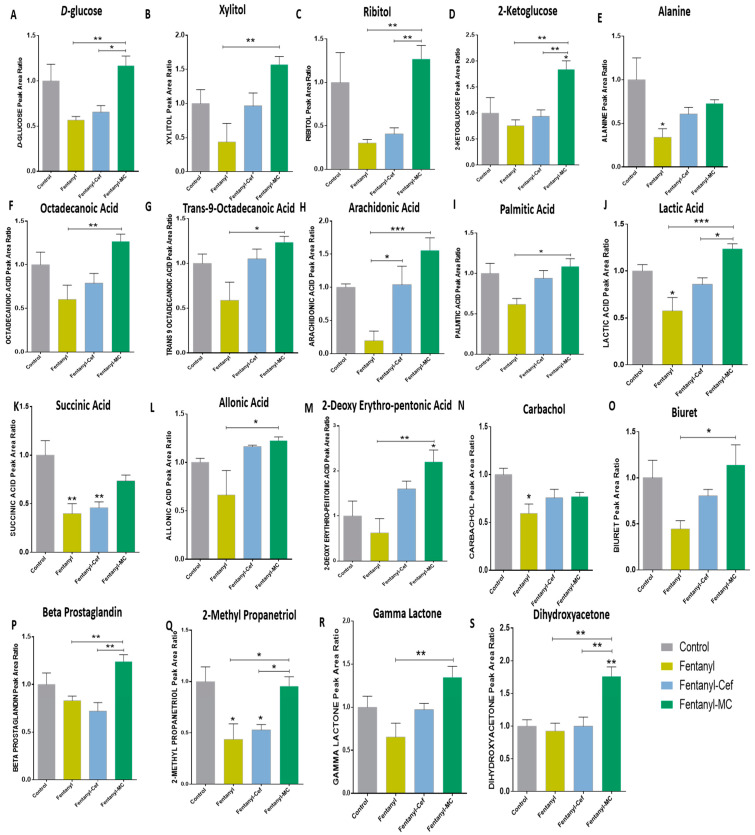
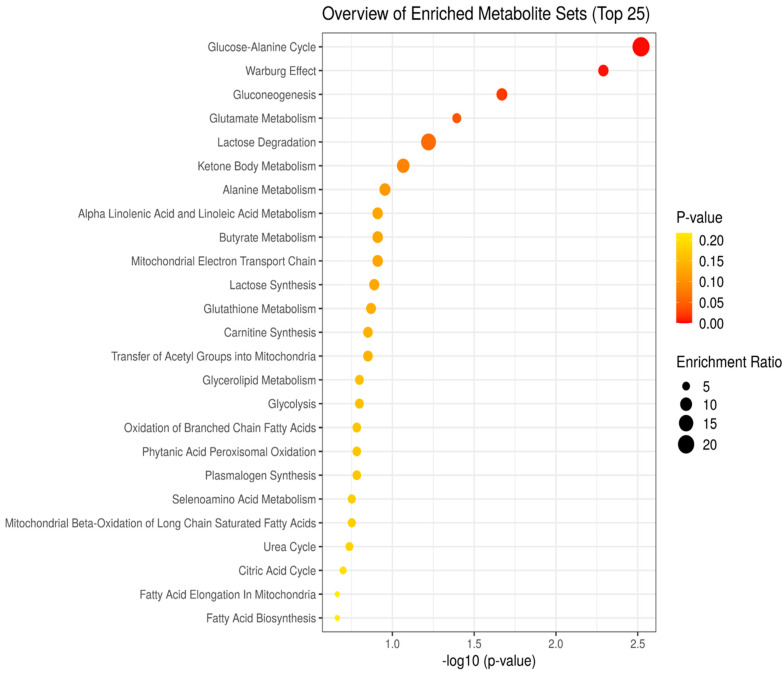
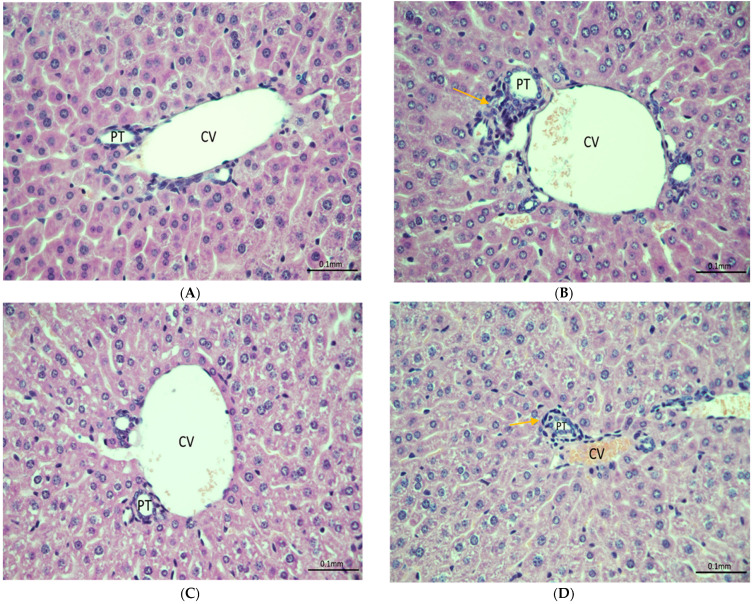
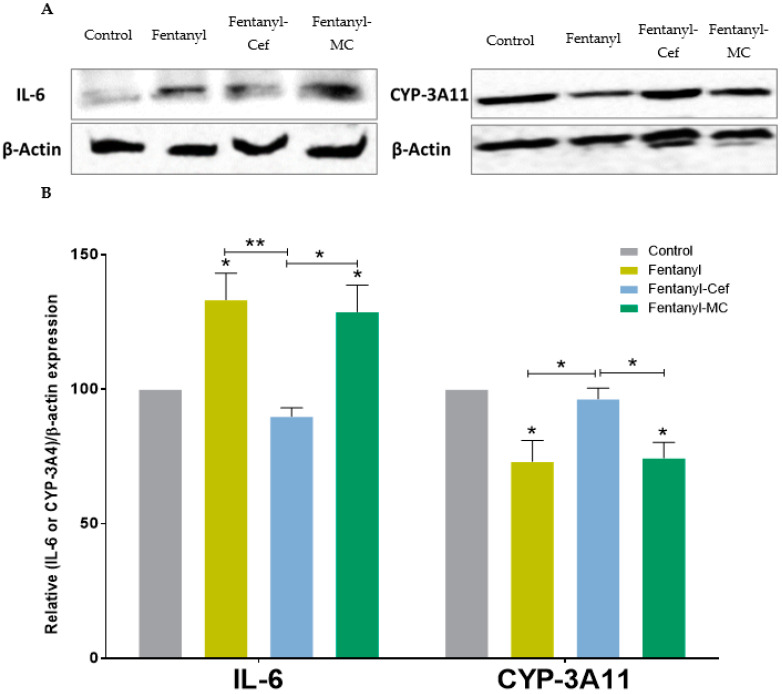
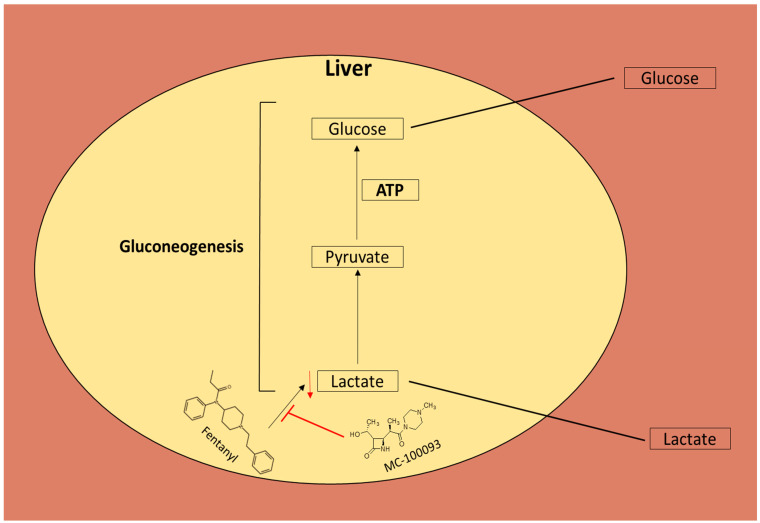
Fentanyl is a highly potent opioid analgesic that is approved medically to treat acute and chronic pain. There is a high potential for overdose-induced organ toxicities, including liver toxicity, and this might be due to the increase of recreational use of opioids. Several preclinical studies have demonstrated the efficacy of beta-lactams in modulating the expression of glutamate transporter-1 (GLT-1) in different body organs, including the liver. The upregulation of GLT-1 by beta-lactams is associated with the attenuation of hyperglutamatergic state, which is a characteristic feature of opioid use disorders. A novel experimental beta-lactam compound with no antimicrobial properties, MC-100093, has been developed to attenuate dysregulation of glutamate transport, in part by normalizing GLT-1 expression. A previous study showed that MC-100093 modulated hepatic GLT-1 expression with subsequent attenuation of alcohol-increased fat droplet content in the liver. In this study, we investigated the effects of fentanyl overdose on liver metabolites, and determined the effects of MC-100093 and ceftriaxone in the liver of a fentanyl overdose mouse model. Liver samples from control, fentanyl overdose, and fentanyl overdose ceftriaxone- or MC-100093-treated mice were analyzed for metabolomics using gas chromatography-mass spectrometry. Heatmap analysis revealed that both MC-100093 and ceftriaxone attenuated the effects of fentanyl overdose on several metabolites, and MC-100093 showed superior effects. Statistical analysis showed that MC-100093 reversed the effects of fentanyl overdose in some metabolites. Moreover, enrichment analysis revealed that the altered metabolites were strongly linked to the glucose-alanine cycle, the Warburg effect, gluconeogenesis, glutamate metabolism, lactose degradation, and ketone body metabolism. The changes in liver metabolites induced by fentanyl overdose were associated with liver inflammation, an effect attenuated with ceftriaxone pre-treatments. Ceftriaxone normalized fentanyl-overdose-induced changes in liver interleukin-6 and cytochrome CYP3A11 (mouse homolog of human CYP3A4) expression. Our data indicate that fentanyl overdose impaired liver metabolites, and MC-100093 restored certain metabolites.

Keywords: CYP-3A4; IL-6; MC-100093; beta-lactams; ceftriaxone; inflammation; metabolomic; opioids; overdose.


Conflict of interest statement

The authors declare no conflict of interest.

Figures

Figure 1
Figure 1
Structures of ceftriaxone and MC-100093.
Figure 2
Figure 2
Overall metabolomics profiles in fentanyl, fentanyl-MC-100093, and fentanyl–ceftriaxone groups. One-way ANOVA showed significant changes in the metabolomic profiles in fentanyl, fentanyl-MC-100093, and fentanyl–ceftriaxone groups. One-way ANOVA followed by Holm–Sidak’s multiple comparisons test showed significant differences in metabolomics profiles between the fentanyl group and the other three groups. The analysis also found significant differences in metabolomics profiles between fentanyl-MC-100093 and fentanyl–ceftriaxone groups. Each dot in the graph represents the mean of one metabolite in each group. Data are reported as the mean of all metabolites’ means ± SEM. (* p < 0.05, ** p < 0.01, # p < 0.0001, n = 4–6/group). Cef, ceftriaxone; MC, MC-100093.
Figure 3
Figure 3
Heatmap analysis model of control, fentanyl, fentanyl–ceftriaxone and fentanyl-MC-100093 metabolomic profiles. Cef, ceftriaxone; MC, MC-100093.
Figure 4
Figure 4
Partial least-squares-discriminant analysis (PLS-DA) model control, fentanyl, fentanyl–ceftriaxone and fentanyl-MC-100093 metabolomic profiles. n = 4–6/group. Cef, ceftriaxone; MC, MC-100093.
Figure 5
Figure 5
Effects of ceftriaxone and MC-100093 on selected metabolites in liver of fentanyl-overdosed mouse model. (A) One-way ANOVA followed by Holm–Sidak’s multiple comparisons test showed that the MC-100093-fentanyl group showed higher d-glucose compared to fentanyl and the fentanyl-cef groups. (B) One-way ANOVA followed by Holm–Sidak’s multiple comparisons test showed that fentanyl-MC-100093 had higher xylitol compared to the fentanyl group. (C) One-way ANOVA followed by Holm–Sidak’s multiple comparisons test showed that MC-100093-fentanyl had higher ribitol compared to the fentanyl and fentanyl-cef groups. (D) One-way ANOVA followed by Holm–Sidak’s multiple comparisons test showed that fentanyl- MC-100093 had higher xylitol compared to thew fentanyl group. (E) One-way ANOVA followed by Holm–Sidak’s multiple comparisons test showed lower alanine in the fentanyl group compared to controls. (F) One-way ANOVA followed by Holm–Sidak’s multiple comparisons test showed that octadecanoic acid was higher in fentanyl-MC-100093 compared to the fentanyl group. (G) One-way ANOVA followed by Holm–Sidak’s multiple comparisons test showed that trans-9 octadecanoic acid was higher in fentanyl-MC-100093 compared to the fentanyl group. (H) One-way ANOVA followed by Holm–Sidak’s multiple comparisons test showed that arachidonic acid was lower in the fentanyl group compared to the fentanyl–ceftriaxone and fentanyl-MC-100093 groups. (I) One-way ANOVA followed by Holm–Sidak’s multiple comparisons test showed that palmitic acid was lower in the fentanyl group compared to the fentanyl-MC-100093 group. (J) One-way ANOVA followed by Holm–Sidak’s multiple comparisons test showed lower lactic acid in the fentanyl group compared to controls; however, lactic acid was higher in the fentanyl-MC-100093 group compared to the fentanyl and fentanyl–ceftriaxone groups. (K) One-way ANOVA followed by Holm–Sidak’s multiple comparisons test showed that succinic acid was lower in the fentanyl and fentanyl–ceftriaxone groups compared to the control group. (L) One-way ANOVA followed by Holm–Sidak’s multiple comparisons test showed that allonic acid was lower in the fentanyl group compared to the fentanyl-MC-100093 group. (M) One-way ANOVA followed by Holm–Sidak’s multiple comparisons test showed that 2-deoxy erythro-pentonic acid was higher in fentanyl-MC-100093 compared to the control and fentanyl groups. (N) One-way ANOVA followed by Holm–Sidak’s multiple comparisons test showed that carbachol was lower in the fentanyl group as compared to the control group. (O) One-way ANOVA followed by Holm–Sidak’s multiple comparisons test showed that biuret was higher in the fentanyl-MC100093 group compared to the fentanyl group. (P) One-way ANOVA followed by Holm–Sidak’s multiple comparisons test showed that beta-prostaglandin was higher in the fentanyl-MC-100093 group compared to the fentanyl and fentanyl–ceftriaxone groups. (Q) One-way ANOVA followed by Holm–Sidak’s multiple comparisons test showed that 2-methylpropanetriol was lower in the fentanyl and fentanyl–ceftriaxone groups compared to the control and fentanyl-MC-100093 groups. (R) One-way ANOVA followed by Holm–Sidak’s multiple comparisons test showed that gamma lactone was higher in the fentanyl-MC-100093 group compared to the fentanyl group. (S) One-way ANOVA followed by Holm–Sidak’s multiple comparisons test showed that dihydroxyacetone was higher in the fentanyl-MC-100093 group compared to all other groups. The symbol of statistical significance is shown on any group's bar when it was compared to the control group. Data are reported as mean ± SEM. (* p < 0.05, ** p < 0.01, *** p < 0.001, n = 4–6/group). Cef, ceftriaxone; MC, MC-100093.
Figure 6
Figure 6
Overview of top 25 enriched metabolite pathways ordered based on p value and enrichment ratio.
Figure 7
Figure 7
(A) Section of liver showing normal portal tract and central vein with surrounding unremarkable hepatocytes in the control group. (B) Section of liver obtained from the fentanyl-overdose-treated group showing inflammation in portal tract and central vein. (C) Section of liver showing limited portal tract inflammation in the fentanyl–ceftriaxone group indicating the protective effects of ceftriaxone against fentanyl overdose. (D) Liver tissue showing minimal to mild inflammation around a bile duct in the fentanyl-MC100093 group. Yellow arrows indicate inflammation. H/E stain ×400. Cef, ceftriaxone; MC, MC-100093; PT, Portal tract; CV, Central vein.
Figure 8
Figure 8
(A) IL-6 and CYP3A11 (mouse homolog of human CYP3A4) bands expression in the control, fentanyl, fentanyl–ceftriaxone, and fentanyl-MC100093 groups. (B) One-way ANOVA followed by Holm–Sidak’s multiple comparisons test showed that liver IL-6 expression was increased in the fentanyl and fentanyl-MC100093 groups compared to the control and fentanyl–ceftriaxone groups; moreover, liver CYP3A11 expression was lower in the fentanyl and fentanyl-MC-100093 groups compared to the control and fentanyl–ceftriaxone groups (n = 4/group). Data are reported as mean ± SEM. (* p < 0.05, ** p < 0.01). Cef, ceftriaxone; MC, MC-100093.
Figure 9
Figure 9
A schematic diagram shows the effects of fentanyl and MC-100093 on lactic acid in the gluconeogenesis pathway. ATP, adenosine triphosphate.

Similar articles

Cited by

References

    1. Sobczak M., Sałaga M., Storr M.A., Fichna J. Physiology, signaling, and pharmacology of opioid receptors and their ligands in the gastrointestinal tract: Current concepts and future perspectives. J. Gastroenterol. 2014;49:24–45. doi: 10.1007/s00535-013-0753-x. - DOI - PMC - PubMed
    1. Iwaszkiewicz K.S., Schneider J.J., Hua S. Targeting peripheral opioid receptors to promote analgesic and anti-inflammatory actions. Front. Pharmacol. 2013;4:132. doi: 10.3389/fphar.2013.00132. - DOI - PMC - PubMed
    1. Le Merrer J., Becker J.A., Befort K., Kieffer B.L. Reward processing by the opioid system in the brain. Physiol. Rev. 2009;89:1379. doi: 10.1152/physrev.00005.2009. - DOI - PMC - PubMed
    1. Reeves K.C., Shah N., Muñoz B., Atwood B.K. Opioid receptor-mediated regulation of neurotransmission in the brain. Front. Mol. Neurosci. 2022;15:919773. doi: 10.3389/fnmol.2022.919773. - DOI - PMC - PubMed
    1. Pathan H., Williams J. Basic opioid pharmacology: An update. Br. J. Pain. 2012;6:11–16. doi: 10.1177/2049463712438493. - DOI - PMC - PubMed

LinkOut - more resources