Review
. 2023 Aug 11;12(8):1032.
doi: 10.3390/pathogens12081032.

Variability of High-Risk Human Papillomavirus and Associated Factors among Women in Sub-Saharan Africa: A Systematic Review and Meta-Analysis

Affiliations
Review

Variability of High-Risk Human Papillomavirus and Associated Factors among Women in Sub-Saharan Africa: A Systematic Review and Meta-Analysis

Michel Carlos Tommo Tchouaket et al. Pathogens. .

Abstract

Background: Sub-Saharan Africa (SSA) carries the highest burden of high-risk human papillomavirus (HR-HPV) in the world, driven by, and together with, HIV infection. This systematic review aimed to identify HR-HPV genotypes and their associated factors among women in SSA.

Methods: A systematic review and meta-analysis of studies conducted in SSA on HR-HPV was conducted. Standard electronic databases were searched. R software version 3.6.0 was used for meta-analysis, with p < 0.05 considered statistically significant.

Results: We included 28 articles with a total of 22,652 participants. The overall pooled prevalence of HR-HPV genotypes was 55.13%, albeit high heterogeneity between studies. The overall pooled prevalence of HR-HPV genotypes in HIV-positive individuals was 75.51%, compared to 52.97% in HIV-negatives (OR = 4.68 (0.71-30.76)). HPV 16 (18%), 35 (10.12%), 52 (9.98%), 18 (9.7%) and 45 (6.82%) genotypes were the most prevalent. Twelve studies identified the most frequently reported risk factors associated with HR-HPV, with HIV infection (66.66%), multiple sexual partners (41.66%) and young age (41.66%) being the most reported risk factors.

Conclusions: The combined prevalence of HR-HPV genotypes among women in general and HIV-infected women in particular remains high in SSA. The presence of several genotypes not covered by the vaccine is remarkable and suggests the need for revision of current vaccination policies to prevent HR-HPV infections.

Keywords: HR-HPV; human immunodeficiency virus; human papillomavirus; sub-Saharan Africa.


Conflict of interest statement

The authors declare no conflict of interest.

Figures

Figure 1
Figure 1
Study flow diagram of studies reviewed, screened and included.
Figure 2
Figure 2
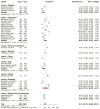
Forest plot to estimate the combined prevalence of human papillomavirus infection in women with 95% CI (weighted estimate based on the random effects model): ES—prevalence equivalent effect size, CI—confidence interval. In the graph, the diamond indicates the pooled result and the boxes indicate the effect estimates of the individual studies. The dotted purple vertical line indicates the pooled estimate. The solid purple vertical line indicates the baseline at zero indicating no effect. The horizontal line through the boxes shows the length of the confidence interval and the boxes show the effect estimates from the individual studies [3,27,29,31,32,33,34,35,36,37,38,39,40,41,42,43,44,45,46,47,48,49,50,51,52,53,54,55].
Figure 3
Figure 3
Forest plot for estimating the combined prevalence of high-risk human papillomavirus infection among HIV-infected participants (weighted estimate based on the random effects model): ES—prevalence equivalent error size, CI—confidence interval. In the graph, the diamond indicates the pooled result and the boxes indicate the effect estimates of the individual studies. The dotted purple vertical line indicates the pooled estimate. The solid purple vertical line indicates the baseline at zero indicating no effect. The horizontal line through the boxes shows the length of the confidence interval and the boxes show the effect estimates from the individual studies [31,40,41,42,46,47,50,51].
Figure 4
Figure 4
Forest plot for estimating the combined prevalence of high-risk human papillomavirus infection in HIV-positive women (weighted estimate based on the random effects model): ES—prevalence equivalent error size, CI—confidence interval. In the graph, the diamond indicates the pooled result and the boxes indicate the effect estimates of the individual studies. The dotted purple vertical line indicates the pooled estimate. The solid purple vertical line indicates the baseline at zero indicating no effect. The horizontal line through the boxes shows the length of the confidence interval and the boxes show the effect estimates from the individual studies [40,46,47,50,51].
Figure 5
Figure 5
Forest plot for estimating the combined prevalence of high-risk human papillomavirus infection among HIV+/HIV− infected women (weighted estimate based on the random effects model): ES—prevalence equivalent error size, CI—confidence interval. In the graph, the diamond indicates the pooled result and the boxes indicate the effect estimates of the individual studies. The dotted purple vertical line indicates the pooled estimate. The solid purple vertical line indicates the baseline at zero indicating no effect. The horizontal line through the boxes shows the length of the confidence interval and the boxes show the effect estimates from the individual studies [40,46,47,50,51].
Figure 6
Figure 6
Forest plot for estimating the combined prevalence of high-risk human papillomavirus infection among women by country in sub-Saharan Africa (weighted estimate based on the random effects model): ES—prevalence equivalent error size, CI—confidence interval. In the graph, the diamond indicates the pooled result and the boxes indicate the effect estimates of the individual studies. The dotted purple vertical line indicates the pooled estimate. The solid purple vertical line indicates the baseline at zero indicating no effect. The horizontal line through the boxes shows the length of the confidence interval and the boxes show the effect estimates from the individual studies [3,29,31,33,34,35,37,38,39,40,41,42,43,44,46,47,48,49,50,51,54,55].

References

    1. Hoory T., Monie A., Gravitt P., Wu T.C. Molecular epidemiology of human papillomavirus. J. Formos. Med. Assoc. Taiwan Yi Zhi. Mars. 2008;107:198–217. doi: 10.1016/S0929-6646(08)60138-2. - DOI - PubMed
    1. Hildesheim A., Schiffman M., Bromley C., Wacholder S., Herrero R., Rodriguez A.C., Bratti M.C., Sherman M.E., Scarpidis U., Lin Q.-Q., et al. Human Papillomavirus Type 16 Variants and Risk of Cervical Cancer. J. Natl. Cancer Inst. 2001;93:315–318. doi: 10.1093/jnci/93.4.315. - DOI - PubMed
    1. Banura C., Franceschi S., van Doorn L.J., Arslan A. Infection with human papillomavirus and HIV among young women in Kampala, Uganda. J. Infect. Dis. 2008;197:555. doi: 10.1086/526792. - DOI - PubMed
    1. Shope R.E., Hurst E.W. Infectious Papillomatosis of Rabbits: With a Note on the Histopathology. J. Exp. Med. 1933;58:607–624. doi: 10.1084/jem.58.5.607. - DOI - PMC - PubMed
    1. zur Hausen H. Papillomaviruses causing cancer: Evasion from host-cell control in early events in carcinogenesis. J. Natl. Cancer Inst. 2000;92:690–698. doi: 10.1093/jnci/92.9.690. - DOI - PubMed