. 2023 Jul 25;11(8):644.
doi: 10.3390/toxics11080644.

Arsenic Impairs Differentiation of Human Induced Pluripotent Stem Cells into Cholinergic Motor Neurons

Affiliations

Arsenic Impairs Differentiation of Human Induced Pluripotent Stem Cells into Cholinergic Motor Neurons

M Chiara Perego et al. Toxics. .

Abstract

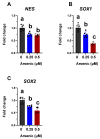
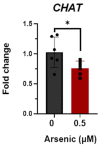
Arsenic exposure during embryogenesis can lead to improper neurodevelopment and changes in locomotor activity. Additionally, in vitro studies have shown that arsenic inhibits the differentiation of sensory neurons and skeletal muscle. In the current study, human-induced pluripotent stem (iPS) cells were differentiated into motor neurons over 28 days, while being exposed to up to 0.5 μM arsenic. On day 6, neuroepithelial progenitor cells (NEPs) exposed to arsenic had reduced transcript levels of the neural progenitor/stem cell marker nestin (NES) and neuroepithelial progenitor marker SOX1, while levels of these transcripts were increased in motor neuron progenitors (MNPs) at day 12. In day 18 early motor neurons (MNs), choline acetyltransferase (CHAT) expression was reduced two-fold in cells exposed to 0.5 μM arsenic. RNA sequencing demonstrated that the cholinergic synapse pathway was impaired following exposure to 0.5 μM arsenic, and that transcript levels of genes involved in acetylcholine synthesis (CHAT), transport (solute carriers, SLC18A3 and SLC5A7) and degradation (acetylcholinesterase, ACHE) were all downregulated in day 18 early MNs. In day 28 mature motor neurons, arsenic significantly downregulated protein expression of microtubule-associated protein 2 (MAP2) and ChAT by 2.8- and 2.1-fold, respectively, concomitantly with a reduction in neurite length. These results show that exposure to environmentally relevant arsenic concentrations dysregulates the differentiation of human iPS cells into motor neurons and impairs the cholinergic synapse pathway, suggesting that exposure impairs cholinergic function in motor neurons.

Keywords: ChAT; arsenic; cholinergic synapse; human induced pluripotent stem cells; motor neurons.


Conflict of interest statement

The authors declare no conflict of interest.

Figures

Figure 1
Figure 1
Low arsenic levels induce cell death in human iPS cells, but not in neuroepithelial progenitor cells (NEPs). Representative images of human iPS and NEP cells exposed to 0 arsenic for six days taken at 10X (A). Representative flow cytometry analysis of day 6 NEPs cells exposed to 0, 0.25, or 0.5 μM arsenic. Cells were stained with Annexin V and SyTox green to assess apoptosis. Text shows the percentage of live (R5), early apoptotic (R6), late apoptotic (R4), and necrotic (R3) cells reported in each quadrant (B) Percentage of live, apoptotic, and necrotic NEPs cells exposed to 0, 0.25 or 0.5 μM arsenic (n = 3 per exposure group) (C). Statistical differences were determined using two-way ANOVA followed by Tukey’s multiple comparison test (*; p ≤ 0.05).
Figure 2
Figure 2
Differential gene expression of key markers during differentiation of human iPS cells into motor neurons. Transcript levels of POU5F1 (A), SOX1 (B), NES (C), OLIG2 (D), and CHAT (E) were assessed by qPCR in control samples from day 0 human iPS cells (gray, circles), day 6 NEPs (green, diamonds), day 12 MNPs (red, triangles) and day 18 early MNs (blue, circles). Fold change was determined using the ΔΔCt method, and results were normalized to geometric mean of Gapdh and β2-microglobulin. Statistical differences were determined using ANOVA followed by Tukey’s multiple comparison test (p ≤ 0.05; n = 4–6 per exposure group; a = no statistical difference from day 0; b = statistically different from day 0; c = statistically different from all other days).
Figure 3
Figure 3
Arsenic exposure reduces neuronal differentiation markers in D6 neuroepithelial progenitor (NEP) cells. Transcript levels of NES (A), SOX1 (B), and SOX2 (C) were assessed in D6 NEPs exposed to 0 (black, circles), 0.25 (blue, squares), or 0.5 μM (red, triangles) arsenic by qPCR. Fold change was determined using the ΔΔCt method and results were normalized to the geometric mean of Gapdh and β2-microglobulin. Statistical differences were determined using ANOVA followed by Tukey’s multiple comparison test (p ≤ 0.05; n = 5–6 per exposure group; a = no statistical difference from control; b = statistically different from control; c = statistically different from all other exposure groups).
Figure 4
Figure 4
Arsenic exposure leads to morphological alterations of MNPs and MNs. Representative images at 10X of D12 MNPs, D18 early MNs, and at 20X of D28 mature MNs exposed to 0 or 0.5 μM arsenic. The arsenic-exposed D12 MNPs have less concentric organization and fewer elongated MNPs (arrows) while the arsenic-exposed D28 mature MNs have reduced neurite length (arrows heads).
Figure 5
Figure 5
Altered transcript levels of neuronal differentiation markers in D12 motor neuron progenitor (MNP) cells. Expression levels of OLIG2 (A), NES (B), SOX1 (C), and CHAT (D) mRNA were assessed by qPCR in D12 MNPs exposed to 0 (black, circles), 0.25 (blues, squares), or 0.5 μM arsenic (red, triangles). Fold change was determined using the ΔΔCt method and results were normalized to the geometric mean of Gapdh and β2-microglobulin. Statistical differences were determined using ANOVA followed by Tukey’s multiple comparison test (p ≤ 0.05; n = 5–6 per exposure group; a = no statistical difference from control; b = statistically different from control). Biplot of principal component analysis (PCA) from D12 MNPs exposed to 0, 0.25, or 0.5 μM arsenic (E).
Figure 6
Figure 6
Reductions in choline acetyltransferase (CHAT) mRNA in D18 early motor neurons (MNs). Transcript levels of CHAT were assessed in D18 early MNs exposed to 0 (black, circles) or 0.5 μM arsenic (red, squares) by qPCR. Fold change was determined using the ΔΔCt method and results were normalized to the geometric mean of Gapdh and β2-microglobulin. Statistical differences were determined using Student’s t-test (*; p ≤ 0.05; n = 6 per exposure group).
Figure 7
Figure 7
Arsenic exposure drives sample clustering in NEPs and early MNs and disrupts biological processes related to nervous system development and synapses. Heat map of normalized read counts of differentially expressed genes (DEGs) from D6 NEPs (A) and D18 early MNs (B) exposed to 0 (pink bars) or 0.5 μM arsenic (blue bars). Principal component analysis (PCA) from D6 NEPs (C) and D18 early MNs (D) exposed to 0 or 0.5 μM arsenic. The distance between the samples represents the differences in gene expression profile (n = 3 per exposure group). Dot plot representing gene set enrichment analysis (GSEA) performed on DEGs of arsenic-treated D6 NEPs (left) and D18 early MNs (right) (E). Dot plot shows activated and suppressed GO categories. GSEA performed on DEGs of day 18 early MNs. Gene sets for nervous system development, neurogenesis, neurotransmitter transport, synapse organization, and synaptic signaling were significantly enriched in D18 MNs exposed to arsenic. The vertical black lines present on the x-axis represent the genes while the y-axis identified the enrichment score. Significance threshold was set at FDR ≤ 0.05 (F).
Figure 7
Figure 7
Arsenic exposure drives sample clustering in NEPs and early MNs and disrupts biological processes related to nervous system development and synapses. Heat map of normalized read counts of differentially expressed genes (DEGs) from D6 NEPs (A) and D18 early MNs (B) exposed to 0 (pink bars) or 0.5 μM arsenic (blue bars). Principal component analysis (PCA) from D6 NEPs (C) and D18 early MNs (D) exposed to 0 or 0.5 μM arsenic. The distance between the samples represents the differences in gene expression profile (n = 3 per exposure group). Dot plot representing gene set enrichment analysis (GSEA) performed on DEGs of arsenic-treated D6 NEPs (left) and D18 early MNs (right) (E). Dot plot shows activated and suppressed GO categories. GSEA performed on DEGs of day 18 early MNs. Gene sets for nervous system development, neurogenesis, neurotransmitter transport, synapse organization, and synaptic signaling were significantly enriched in D18 MNs exposed to arsenic. The vertical black lines present on the x-axis represent the genes while the y-axis identified the enrichment score. Significance threshold was set at FDR ≤ 0.05 (F).
Figure 8
Figure 8
Arsenic exposure downregulates genes involved in acetylcholine synthesis, transport, and degradation of D18 early MNs. KEGG pathway analysis shows several downregulated (green) genes of the cholinergic synapse pathway in arsenic-exposed D18 early MNs (A). RNA sequencing normalized read counts of CHAT (B), SLC18A3 (C), ACHE (D), and SLC5A7 (E) from D6 NEPs and D18 early MNs. Data are presented as read count ± SE. Statistical differences (*) were determined by Student’s t-test using the adjusted p-value (FDR ≤ 0.05).
Figure 8
Figure 8
Arsenic exposure downregulates genes involved in acetylcholine synthesis, transport, and degradation of D18 early MNs. KEGG pathway analysis shows several downregulated (green) genes of the cholinergic synapse pathway in arsenic-exposed D18 early MNs (A). RNA sequencing normalized read counts of CHAT (B), SLC18A3 (C), ACHE (D), and SLC5A7 (E) from D6 NEPs and D18 early MNs. Data are presented as read count ± SE. Statistical differences (*) were determined by Student’s t-test using the adjusted p-value (FDR ≤ 0.05).
Figure 9
Figure 9
Arsenic exposure alters MAP2 pattern in day 18 early MNs. (A) Representative images of MAP2 (red) and ChAT (green) in control and 0.5 μM arsenic-exposed day 18 early MNs. Yellow arrows show differences in MAP2 pattern. (B) Relative fluorescence of MAP2 (left) and ChAT (right) was determined in ImageJ and is presented as integrated density value (IDV) ± SE between control (black) and 0.5 μM arsenic (red) (n = 3 per exposure group). Statistical differences were determined using Student’s t-test (*; p ≤ 0.05).
Figure 10
Figure 10
Arsenic exposure reduces neurite length and downregulates protein levels of MAP2 and ChAT in day 28 mature MNs. (A) Representative images of MAP2 (red) and ChAT (green) in control and 0.5 μM arsenic-exposed day 28 mature MNs. Arrows show differences in neurite length. (B) Relative fluorescence of MAP2 (left) and ChAT (right) in the cell body was determined in ImageJ. Protein expression was assessed in two to six cells per biological replicate (n = 3 replicates per exposure group), and data are presented as integrated density value (IDV) ± SE for control (black, circles) and 0.5 μM arsenic (red, triangles). Statistical differences were determined using Student’s t-test (*; p ≤ 0.05). (C) Sholl analysis of neural processes of MAP2+ day 28 mature MNs was performed on one to two cells per biological replicate (n = 3 replicates per exposure group). (D) Average neurite length of neuronal processes of MAP2+ day 28 mature MNs. Analysis was performed on n = 3 per exposure group and one to two cells per biological replicate. (E) Average number of intersections obtained from C.
Figure 10
Figure 10
Arsenic exposure reduces neurite length and downregulates protein levels of MAP2 and ChAT in day 28 mature MNs. (A) Representative images of MAP2 (red) and ChAT (green) in control and 0.5 μM arsenic-exposed day 28 mature MNs. Arrows show differences in neurite length. (B) Relative fluorescence of MAP2 (left) and ChAT (right) in the cell body was determined in ImageJ. Protein expression was assessed in two to six cells per biological replicate (n = 3 replicates per exposure group), and data are presented as integrated density value (IDV) ± SE for control (black, circles) and 0.5 μM arsenic (red, triangles). Statistical differences were determined using Student’s t-test (*; p ≤ 0.05). (C) Sholl analysis of neural processes of MAP2+ day 28 mature MNs was performed on one to two cells per biological replicate (n = 3 replicates per exposure group). (D) Average neurite length of neuronal processes of MAP2+ day 28 mature MNs. Analysis was performed on n = 3 per exposure group and one to two cells per biological replicate. (E) Average number of intersections obtained from C.

Similar articles

References

    1. Shankar S., Shanker U., Shikha Arsenic contamination of groundwater: A review of sources, prevalence, health risks, and strategies for mitigation. Sci. World J. 2014;2014:304524. doi: 10.1155/2014/304524. - DOI - PMC - PubMed
    1. Mochizuki H., Phyu K.P., Aung M.N., Zin P.W., Yano Y., Myint M.Z., Thit W.M., Yamamoto Y., Hishikawa Y., Thant K.Z., et al. Peripheral neuropathy induced by drinking water contaminated with low-dose arsenic in Myanmar. Environ. Health Prev. Med. 2019;24:23. doi: 10.1186/s12199-019-0781-0. - DOI - PMC - PubMed
    1. Naujokas M.F., Anderson B., Ahsan H., Aposhian H.V., Graziano J.H., Thompson C., Suk W.A. The broad scope of health effects from chronic arsenic exposure: Update on a worldwide public health problem. Environ. Health Perspect. 2013;121:295–302. doi: 10.1289/ehp.1205875. - DOI - PMC - PubMed
    1. Smith A.H., Arroyo A.P., Mazumder D.N., Kosnett M.J., Hernandez A.L., Beeris M., Smith M.M., Moore L.E. Arsenic-induced skin lesions among Atacameno people in Northern Chile despite good nutrition and centuries of exposure. Environ. Health Perspect. 2000;108:716–720. - PMC - PubMed
    1. Bhattacharya P., Hossain M., Rahman S.N., Robinson C., Nath B., Rahman M., Islam M.M., Von Bromssen M., Ahmed K.M., Jacks G., et al. Temporal and seasonal variability of arsenic in drinking water wells in Matlab, southeastern Bangladesh: A preliminary evaluation on the basis of a 4 year study. J. Environ. Sci. Health A Tox. Hazard. Subst. Environ. Eng. 2011;46:1177–1184. doi: 10.1080/10934529.2011.598768. - DOI - PubMed

LinkOut - more resources