

Do Orthopaedic Virtual Clinic Visits Demonstrate Cost and Time Efficiencies Compared With In-person Visits?
- PMID: 37624757
- PMCID: PMC10566797
- DOI: 10.1097/CORR.0000000000002813
Do Orthopaedic Virtual Clinic Visits Demonstrate Cost and Time Efficiencies Compared With In-person Visits?
Abstract
Background: There are numerous reasons for the increased use of telemedicine in orthopaedic surgery, one of which is the perception that virtual visits are more cost-effective than in-person visits. However, to our knowledge, no studies have compared the cost and time investment of virtual versus in-person visits using the time-driven activity-based costing (TDABC) method. Unlike methods that estimate cost based on charges for services rendered, TDABC provides a more precise measurement of costs, which is essential for assessing cost-effective innovations and moving to value-based healthcare.
Questions/purposes: (1) Are virtual visits less costly than analogous in-person visits, as measured by TDABC? (2) Does TDABC yield cost estimates that are lower or higher than the ratio of costs to charges (RCC), which is a simple, frequently used costing method? (3) Do the total time commitments of healthcare personnel, and that of the surgeon specifically, vary between the virtual and in-person settings?
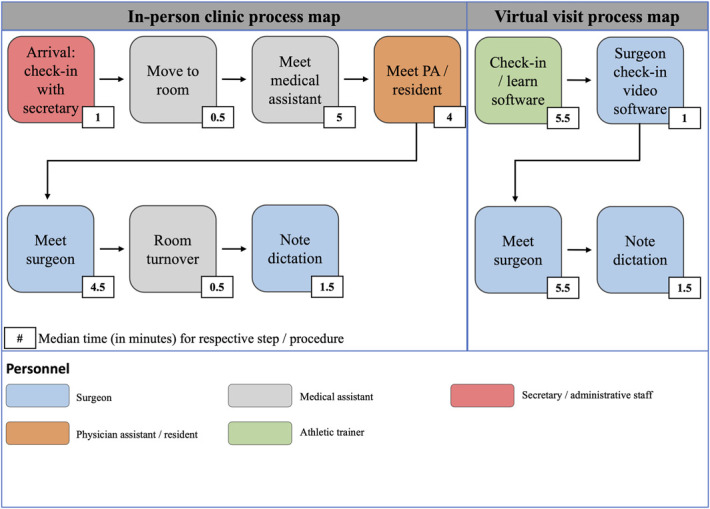
Methods: Patients for this prospective, observational study were recruited from the practices of the highest-volume virtual-visit surgeons of three subspecialties (joints, hand, and sports) in a multihospital, tertiary-care academic institution in a metropolitan area in the Midwestern United States. Each surgeon had at least 10 years of clinical practice. Between June 2021 and September 2021, we analyzed both in-person and virtual return visits with patients who had an established relationship with the surgeon, because this represented the most frequent type of virtual visits and enabled a direct comparison between the two settings. New patients were not included in the study because of the limited availability of new-patient virtual visits; such patients often benefit from in-person physical examinations and on-site imaging. Additionally, patients seen for routine postoperative care were excluded because they were primarily seen in person by a physician assistant. Data were acquired during this period until 90 in-person and 90 virtual visits were collected according to selection criteria; no patients were lost to follow-up. Distinct process maps, which represent the steps involved in a clinic visit used to measure healthcare personnel time invested, were constructed for in-person and virtual clinic visits and used to compare total personnel and surgeon time spent. To calculate TDABC-derived costs, time allocated by personnel to complete each step was measured and used to calculate cost based on each personnel member's yearly salary. From the accounting department of our hospital, we acquired RCC cost data according to the level of service for a return visit.
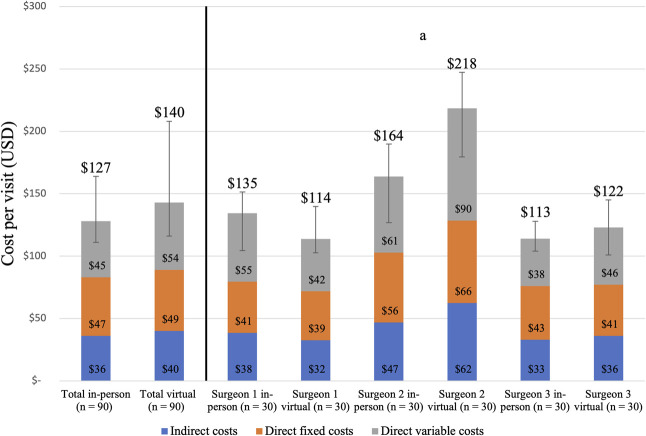
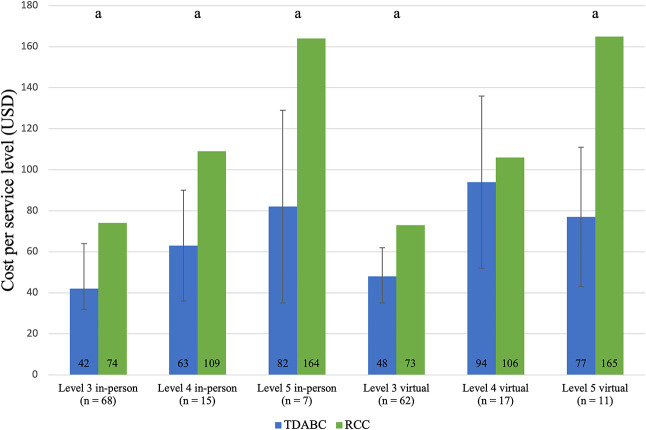
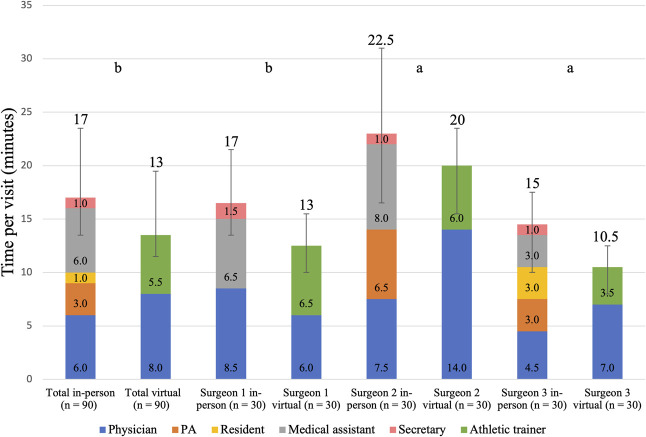
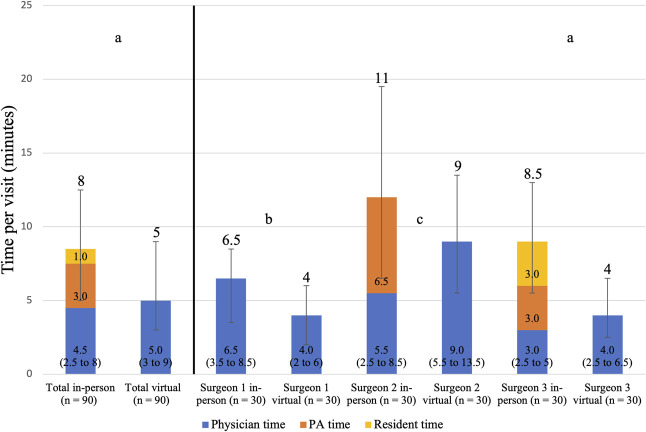
Results: The total median cost, as measured by TDABC, was USD 127 (IQR USD 111 to 163) for an in-person visit and USD 140 (IQR USD 113 to 205) for a virtual visit (median difference USD 13; p = 0.16). RCC overestimated TDABC-calculated direct variable cost in five of six service levels (in-person levels 3, 4, and 5 and virtual levels 3 and 5) by a range of USD 25 to 88. Additionally, we found that virtual visits consumed 4 minutes less of total personnel time (in-person: 17 minutes [IQR 13.5 to 23.5 minutes], virtual: 13 minutes [IQR 11 to 19 minutes]; p < 0.001); however, this difference in personnel time did not equate to cost savings because surgeons spent 2 minutes longer on virtual visit activities than they did on in-person activities (in-person: 6 minutes [IQR 4.5 to 9.5 minutes], virtual: 8 minutes [IQR 5.5 to 13 minutes]; p = 0.003).
Conclusion: Orthopaedic virtual visits did not deliver cost savings compared with in-person visits because surgeons spent more time on virtual visits and participated in virtual visits at the clinical site. Additionally, as anticipated, RCC overestimated costs as calculated by TDABC. These findings suggest that cost is not a primary advantage of transitioning to virtual visits, and that factors such as patient preference and satisfaction should be considered instead.
Level of evidence: Level II, economic and decision analysis.
Copyright © 2023 by the Association of Bone and Joint Surgeons.
Conflict of interest statement
Each author certifies that there are no funding or commercial associations (consultancies, stock ownership, equity interest, patent/licensing arrangements, etc.) that might pose a conflict of interest in connection with the submitted article related to the author or any immediate family members. All ICMJE Conflict of Interest Forms for authors and Clinical Orthopaedics and Related Research ® editors and board members are on file with the publication and can be viewed on request.
Figures
Comment in
-
Editor's Spotlight/Take 5: Do Orthopaedic Virtual Clinic Visits Demonstrate Cost and Time Efficiencies Compared With In-person Visits?Clin Orthop Relat Res. 2023 Nov 1;481(11):2076-2079. doi: 10.1097/CORR.0000000000002883. Epub 2023 Sep 28. Clin Orthop Relat Res. 2023. PMID: 37772962 Free PMC article. No abstract available.
References
-
- Centers for Medicare and Medicaid Services. Evaluation and management services guidelines. Available at: https://www.cms.gov/outreach-and-education/medicare-learning-network-mln.... Accessed December 19, 2022.
Publication types
MeSH terms
LinkOut - more resources
Full Text Sources
Medical
Research Materials
