. 2023 Aug 25;9(34):eadh5598.
doi: 10.1126/sciadv.adh5598. Epub 2023 Aug 25.

Transcriptional regulation by the NSL complex enables diversification of IFT functions in ciliated versus nonciliated cells

Affiliations

Transcriptional regulation by the NSL complex enables diversification of IFT functions in ciliated versus nonciliated cells

Tsz Hong Tsang et al. Sci Adv. .

Abstract

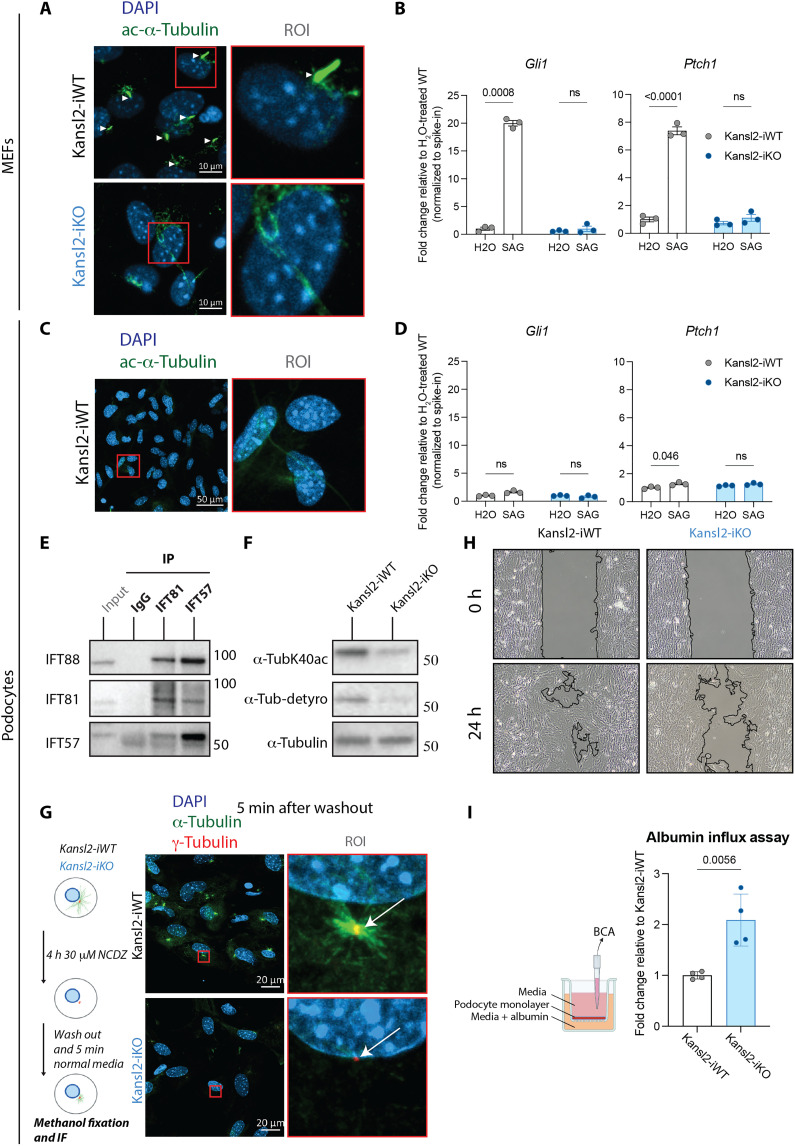
Members of the NSL histone acetyltransferase complex are involved in multiorgan developmental syndromes. While the NSL complex is known for its importance in early development, its role in fully differentiated cells remains enigmatic. Using a kidney-specific model, we discovered that deletion of NSL complex members KANSL2 or KANSL3 in postmitotic podocytes led to catastrophic kidney dysfunction. Systematic comparison of two primary differentiated cell types reveals the NSL complex as a master regulator of intraciliary transport genes in both dividing and nondividing cells. NSL complex ablation led to loss of cilia and impaired sonic hedgehog pathway in ciliated fibroblasts. By contrast, nonciliated podocytes responded with altered microtubule dynamics and obliterated podocyte functions. Finally, overexpression of wild-type but not a double zinc finger (ZF-ZF) domain mutant of KANSL2 rescued the transcriptional defects, revealing a critical function of this domain in NSL complex assembly and function. Thus, the NSL complex exhibits bifurcation of functions to enable diversity of specialized outcomes in differentiated cells.


Figures

Fig. 1.
Fig. 1.. KANSL2 and KANSL3 depletion causes severe glomerulopathy.
(A) Kansl2fl/fl and Kansl3fl/fl mice were crossed to nCre mice to generate podocyte-specific Kansl2 (Kansl2-pKO) or Kansl3 (Kansl3-pKO) KO mice. When necessary, mice were further crossed with mTmG mice to genetically label podocytes. (B) Urinary albumin:creatinine ratios from nCre, Kansl2-pKO, and Kansl3-pKO mice (n = 3 to 15 per group per time point). Data are presented as means ± SEM and were analyzed using the Kruskal-Wallis test followed by Dunn’s multiple comparisons as post hoc test. (C) Body weight of nCre, Kansl2-pKO, and Kansl3-pKO mice (n = 3 to 20 per group per time point). Data are presented as means ± SEM and were analyzed using the ordinary one-way analysis of variance (ANOVA) followed by Tukey’s multiple-comparison test. (D) Kaplan-Meier survival curve of nCre, Kansl2-pKO, and Kansl3-pKO mice (n = 10 to 13). Data were analyzed by the log-rank (Mantel-Cox) test. (E) Representative photo of kidney (top) and body (bottom) from 6-week-old littermate control (left) and Kansl2-pKO (right) mice (scale bar, 1 cm). (F and G) PAS (F) and Sirius red (G) staining of kidney sections from 6-week-old nCre, Kansl2-pKO, and Kansl3-pKO mice [glomerulosclerosis (asterisks), tubular protein casts with tubular dilatation (arrows); scale bar, 100 μm]. (H) SEM (top) and TEM (bottom) of nCre, Kansl2-pKO, and Kansl3-pKO kidneys. (Top) Simplification of the secondary foot process pattern was evident in both Kansl2-pKO and Kansl3-pKO glomeruli by 3 weeks of age [podocyte cell body (asterisk), primary foot process (+), secondary foot process (cyan and magenta; −), slit diaphragms (yellow); scale bar, 1 μm]. (Bottom) Foot process effacement results in a reduction of slit diaphragms in both Kansl2-pKO and Kansl3-pKO glomeruli [secondary foot process (cyan and magenta, −), slit diaphragms (arrows); scale bar, 250 nm]. (I) Quantification of TEM in (H) (n = 90 micrographs quantified, n = 3 glomeruli per mouse per genotype). Data were analyzed using the ordinary one-way ANOVA followed by Tukey’s multiple-comparison test.
Fig. 2.
Fig. 2.. NSL complex depletion leads to down-regulation of genes in cilia- and microtubule-related pathways.
(A) Model for isolation of podocytes genetically tagged with mTmG. (B) Volcano plot showing the number of differentially expressed genes in Kansl2-pKO versus nCre podocytes [false discovery rate (FDR) < 0.05, log2[fold change] > |0.5|]. (C) Heatmap of normalized expression score (NES) from all cilia- and microtubule-related GO-BP terms that appear in the GSEA analysis of either Kansl2-pKO or Kansl3-pKO podocytes. (D) Heatmap of z scores from genes in the GO term intraciliary transport in podocytes. (E) Western blot of KANSL2, KANSL3, and IFT proteins on lysates of podocytes. The red arrowhead points to the specific KANSL3 band. The same Western blot is shown in fig. S1F. (F) Model for isolation and culture of MEFs. (G) Volcano plot showing the number of differentially expressed genes in Kansl2-iKO MEFs versus the Kansl2-iWT controls (FDR < 0.05, log2[fold change] > |0.5|). (H) Heatmap of NES from all cilia- and microtubule-related GO-BP terms that appear in the GSEA analysis of either Kansl2-iKO or Kansl3-iKO MEFs. (I) Heatmap of z scores from genes in the GO term intraciliary transport in MEFs. (J) Western blot of KANSL2, KANSL3, and IFT proteins on MEF lysates. The red arrowhead points to the specific KANSL3 band. (K and L) Venn diagram showing down-regulated genes (FDR < 0.05, log2[fold change] < 0) in both Kansl2-pKO mouse podocytes and KANSL2-KD human THP-1 cells (K), or in both Kansl3-pKO podocytes and KANSL3-KD THP-1 cells (L). (M) Heatmap of z scores from genes in the GO term intraciliary transport in THP-1 cells. (N) Volcano plot of proteomics data comparing KANSL2-KD versus control THP-1 cells. Proteins within the GO term intraciliary transport as well as KANSL2 are annotated and highlighted in red. (O) qRT-PCR of intraciliary transport genes in HK-2 cells transfected with siCTRL or siKANSL2 siRNA (n = 3 per group). Data are presented as means ± SEM and were analyzed using a two-tailed Student’s t test.
Fig. 3.
Fig. 3.. Microtubule-related defects caused by KANSL2 depletion in ciliated and nonciliated cells.
(A) Immunofluorescence of ac-α-tubulin as a readout of cilia in MEFs. Arrowheads point to cilia. See fig. S3H for quantification. (B) qRT-PCR of shh pathway genes in Kansl2-iWT and Kansl2-iKO MEFs (n = 3 per group). Data are presented as means ± SEM and were analyzed using two-way ANOVA followed by Tukey’s multiple-comparison test. (C) Immunofluorescence of ac-α-tubulin in podocyte culture. No obvious cilia structures were observed. (D) qRT-PCR of shh pathway genes in Kansl2-iWT and Kansl2-iKO podocytes. SAG treatments failed to induce the shh response even in Kansl2-iWT podocytes (n = 3 per group). Data are presented as means ± SEM and were analyzed using two-way ANOVA followed by Tukey’s multiple-comparison test. (E) Western blot showing immunoprecipitation of IFT81 and IFT57 in WT podocytes. (F) Western blot of tubulin modifications in Kansl2-iWT and Kansl2-iKO podocytes. See fig. S5E for quantification. (G) Experimental model (left) and immunofluorescence (right) of tubulin repolymerization assay after 5 min of recovery in Kansl2-iWT and Kansl2-iKO podocytes. (H) Migration assay of Kansl2-iWT and Kansl2-iKO podocytes. See fig. S5G for quantification. (I) Experimental model (left) and albumin influx assay (right) in Kansl2-iWT and Kansl2-iKO podocytes (n = 4 per group). Data are presented as means ± SEM and were analyzed using a two-tailed Student’s t test.
Fig. 4.
Fig. 4.. Ift genes are direct target of NSL complex and show loss of H4K5 and H4K12 acetylations upon KANSL2 depletion.
(A) Metagene profile (top) and heatmap (bottom) showing TSS binding of MOF and KANSL3 at a group of commonly down-regulated genes in both Kansl2-pKO and Kansl3-pKO (n = 1585) versus a control group of randomly selected genes (n = 1582). (B) Metagene profile (top) and heatmap (bottom) showing TSS binding of MOF and KANSL3 at genes in the GO term intraciliary transport (n = 55) versus a control group of random genes (n = 55). (C) IGV snapshot of MOF and KANSL3 binding at TSS of Ift genes. (D to I) Box plots showing enrichment of H4K5ac (D), H4K12ac (E), H4K16ac (F), H3K9ac (G), H3K4me3 (H), and H3K27ac (I) at intraciliary transport genes (n = 55) (top) versus a control group of random genes (n = 55) (bottom) in nCre and Kansl2-pKO podocytes. ChIP signals of individual histone modifications were normalized to H3 (data are presented as minimum to maximum and were analyzed using a two-tailed Student’s t test).
Fig. 5.
Fig. 5.. The second zinc finger of KANSL2 is required for NSL-mediated transcriptional regulation of intraciliary transport genes.
(A) Constructs used for lentivirus-based overexpression experiments. (B) Schematic of lentivirus-based overexpression experiments. (C) qRT-PCR of Ift genes in podocytes with the indicated genotypes and overexpression constructs (n = 3 per group). Data are presented as means ± SEM and were analyzed using the ordinary one-way ANOVA followed by Tukey’s multiple-comparison test. (D and E) Box plots showing enrichment of H4K5ac (D) and H4K12ac (E) at intraciliary transport genes (n = 55) (top) versus a control group of random genes (n = 55) (bottom) in MEFs with the indicated genotype and lentiviral constructs. ChIP signals of individual histone modifications were normalized to H3 (data are presented as minimum to maximum and were analyzed using the ordinary one-way ANOVA followed by Tukey’s multiple-comparison test.) (F) Western blot of IFT proteins in podocytes with the indicated genotypes and overexpression constructs. See fig. S6B for quantification. (G) Immunoprecipitation of FLAG in nuclear extract of WT podocytes with the indicated overexpression constructs. The KANSL2-Δ2nd ZF mutant failed to bind to the other NSL complex members. (H) Western blot of NSL complex proteins in WT and Kansl2-iKO podocytes. See fig. S6C for quantification. (I) Western blot of the NSL complex proteins in podocytes with the indicated genotypes and overexpression constructs. See fig. S6D for quantification. (J) Western blot of tubulin modifications in podocytes with the indicated genotypes and overexpression constructs. See fig. S6G for quantification.
Fig. 6.
Fig. 6.. NSL complex–mediated regulation of Ift genes exhibits a bifurcation of functions to enable diversity of specialized outcomes in two differentiated cell types.
The evolutionary conserved NSL complex mediates transcriptional regulation of Ift genes via histone acetylations in both mouse and human cells. Depletion of the NSL complex members KANSL2 or KANSL3, or expression of the KANSL2-Δ2nd ZF mutant, results in the loss of Ift gene expression. In ciliated cells, this leads to the loss of cilia and the failure to induce shh pathways, while in nonciliated cells such as podocytes, this leads to altered microtubule dynamics, reduced albumin filtration and decreased cell migration in vitro, as well as podocyte foot process effacement in vivo. Mice with podocyte-specific deletion of Kansl2 or Kansl3 suffer from glomerulosclerosis and kidney failure, eventually leading to early lethality.

Similar articles

Cited by

References

    1. B. N. Sheikh, A. Akhtar, The many lives of KATs—Detectors, integrators and modulators of the cellular environment. Nat. Rev. Genet. 20, 7–23 (2018). - PubMed
    1. X.-J. Yang, E. Seto, HATs and HDACs: From structure, function and regulation to novel strategies for therapy and prevention. Oncogene 26, 5310–5318 (2007). - PubMed
    1. S. Timmermann, H. Lehrmann, A. Polesskaya, A. Harel-Bellan, Histone acetylation and disease. Cell. Mol. Life Sci. 58, 728–736 (2001). - PMC - PubMed
    1. L. Li, M. Ghorbani, M. Weisz-Hubshman, J. Rousseau, I. Thiffault, R. E. Schnur, C. Breen, R. Oegema, M. M. Weiss, Q. Waisfisz, S. Welner, H. Kingston, J. A. Hills, E. M. Boon, L. Basel-Salmon, O. Konen, H. Goldberg-Stern, L. Bazak, S. Tzur, J. Jin, X. Bi, M. Bruccoleri, K. McWalter, M. T. Cho, M. Scarano, G. B. Schaefer, S. S. Brooks, S. S. Hughes, K. L. I. van Gassen, J. M. van Hagen, T. K. Pandita, P. B. Agrawal, P. M. Campeau, X.-J. Yang, Lysine acetyltransferase 8 is involved in cerebral development and syndromic intellectual disability. J. Clin. Invest. 130, 1431–1445 (2020). - PMC - PubMed
    1. J. H. Roelfsema, S. J. White, Y. Ariyürek, D. Bartholdi, D. Niedrist, F. Papadia, C. A. Bacino, J. T. den Dunnen, G.-J. B. van Ommen, M. H. Breuning, R. C. Hennekam, D. J. M. Peters, Genetic heterogeneity in Rubinstein-Taybi syndrome: Mutations in both the CBP and EP300 genes cause disease. Am. J. Hum. Genet. 76, 572–580 (2005). - PMC - PubMed

Substances