. 2023 Aug 4;8(86):eadg0878.
doi: 10.1126/sciimmunol.adg0878. Epub 2023 Aug 25.

Sustained CD28 costimulation is required for self-renewal and differentiation of TCF-1+ PD-1+ CD8 T cells

Affiliations

Sustained CD28 costimulation is required for self-renewal and differentiation of TCF-1+ PD-1+ CD8 T cells

Etienne Humblin et al. Sci Immunol. .

Abstract

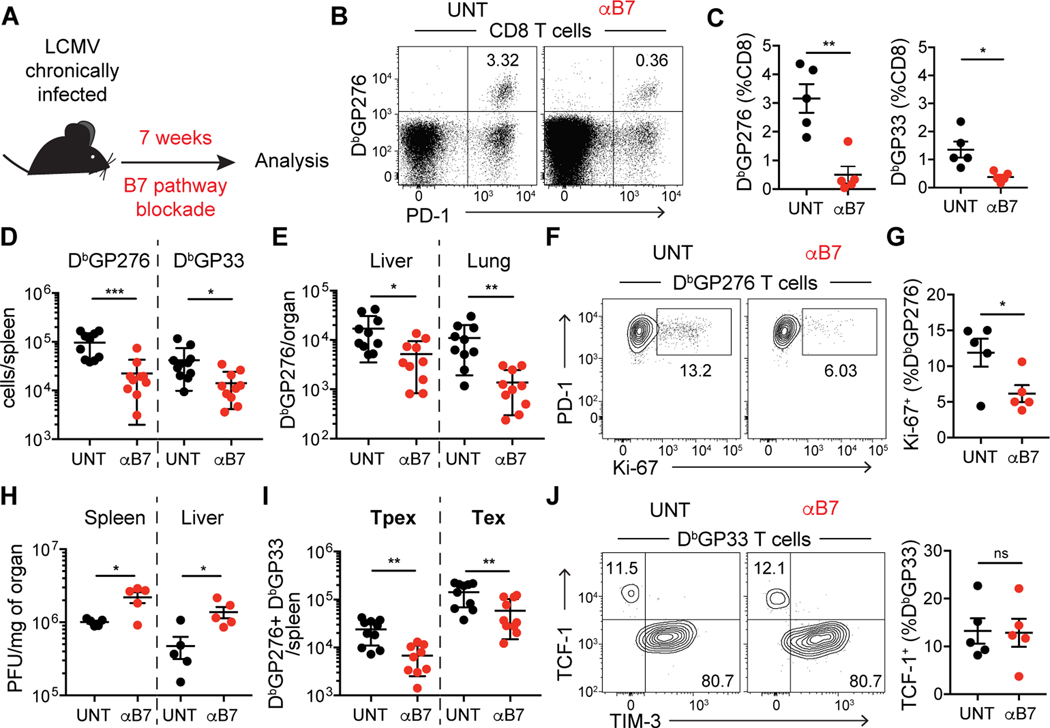
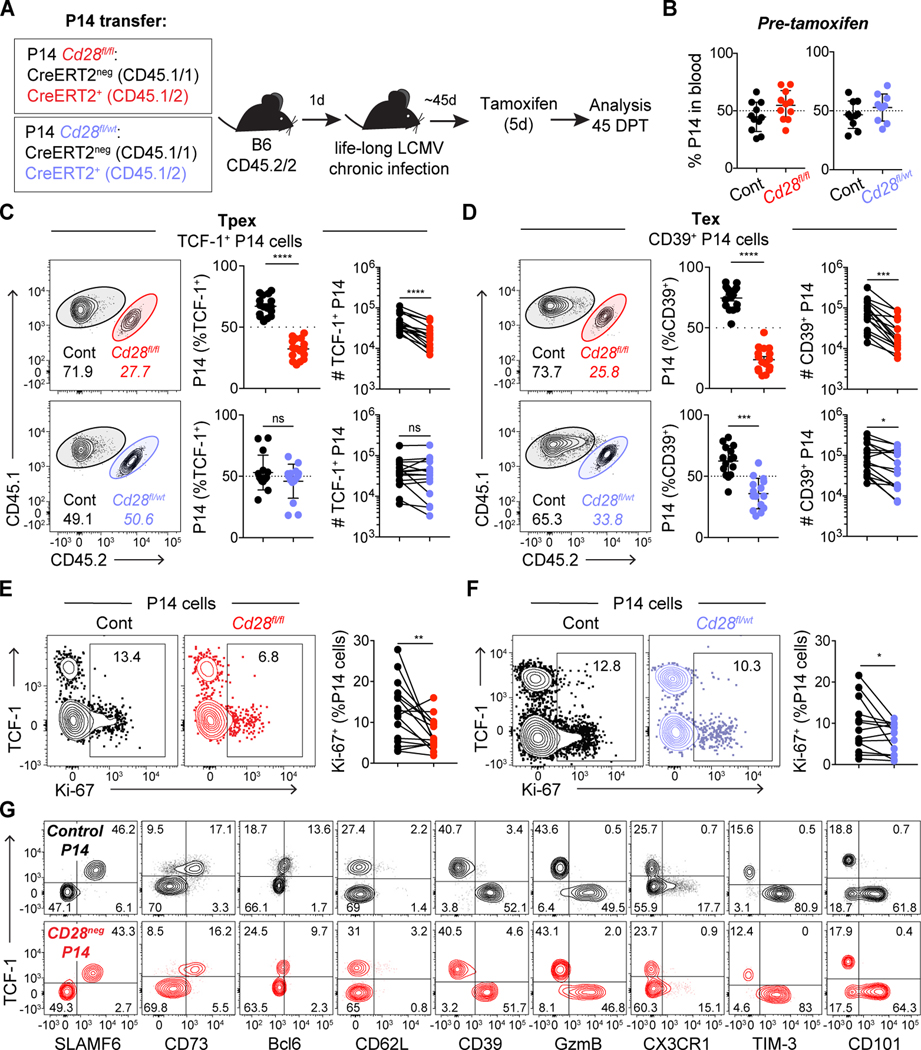
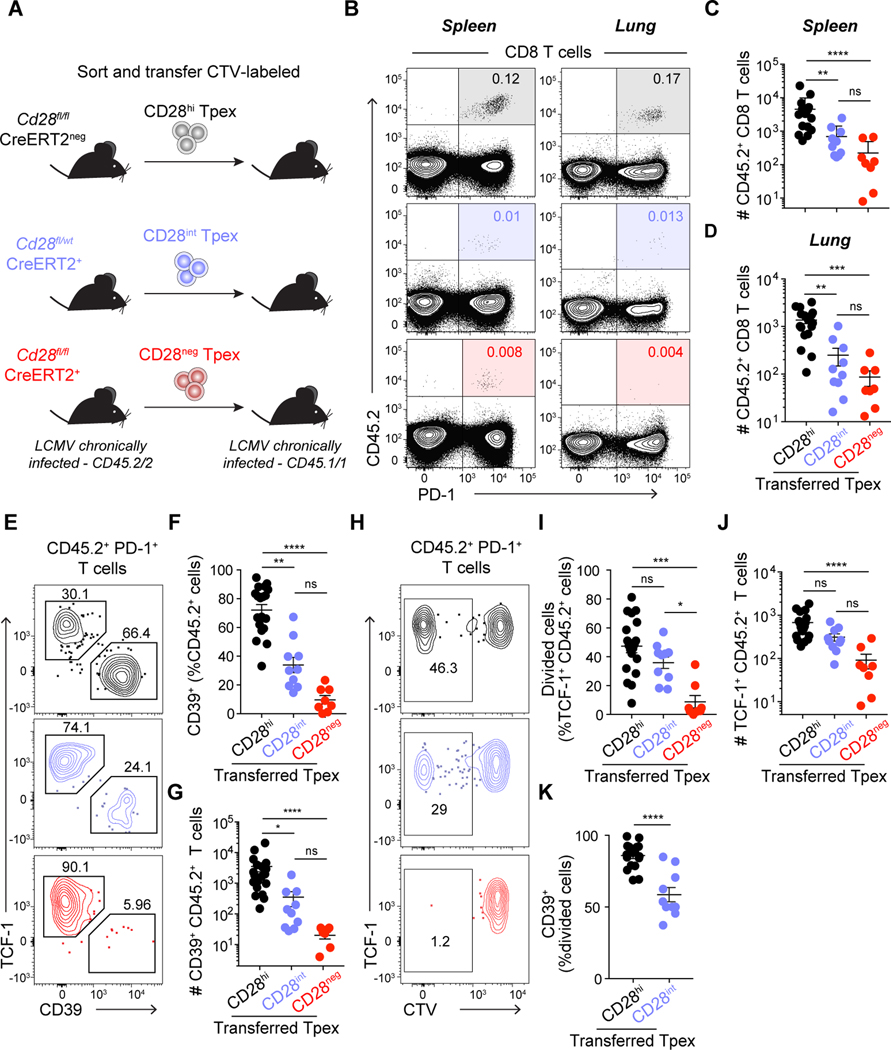
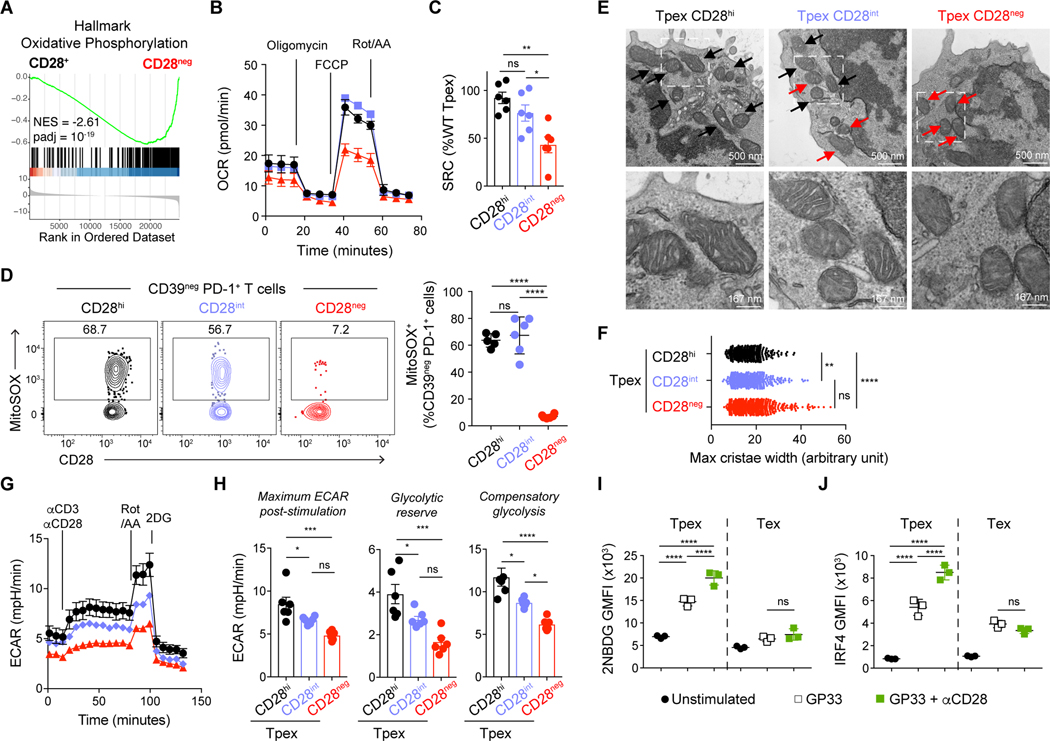
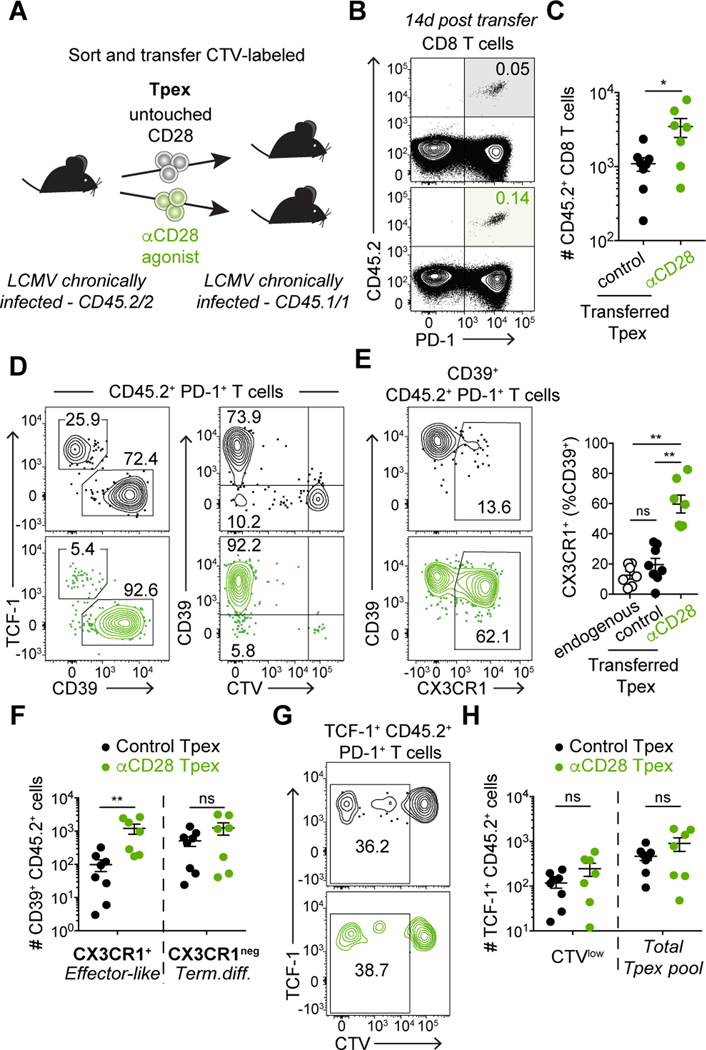
During persistent antigen stimulation, such as in chronic infections and cancer, CD8 T cells differentiate into a hypofunctional programmed death protein 1-positive (PD-1+) exhausted state. Exhausted CD8 T cell responses are maintained by precursors (Tpex) that express the transcription factor T cell factor 1 (TCF-1) and high levels of the costimulatory molecule CD28. Here, we demonstrate that sustained CD28 costimulation is required for maintenance of antiviral T cells during chronic infection. Low-level CD28 engagement preserved mitochondrial fitness and self-renewal of Tpex, whereas stronger CD28 signaling enhanced glycolysis and promoted Tpex differentiation into TCF-1neg exhausted CD8 T cells (Tex). Furthermore, enhanced differentiation by CD28 engagement did not reduce the Tpex pool. Together, these findings demonstrate that continuous CD28 engagement is needed to sustain PD-1+ CD8 T cells and suggest that increasing CD28 signaling promotes Tpex differentiation into more functional effector-like Tex, possibly without compromising long-term responses.


Conflict of interest statement

Competing interests:

The other authors declare that they have no competing interests.

Figures

Fig. 1:
Fig. 1:. B7 costimulation is required for the maintenance of virus-specific CD8 T cells during chronic LCMV infection.
(A) Experimental layout: C57BL/6J mice were transiently depleted of CD4 T cells and infected with LCMV clone 13. Mice with established life-long chronic infection (>40 days post infection) remained untreated (UNT) or received anti-B7–1 and anti-B7–2 blocking antibodies (αB7) during 7 weeks (wks). (B and C) Frequency of LCMV-specific CD8 T cells in spleen. (D and E) Number of LCMV-specific CD8 T cells in different organs. (F and G) Ki-67 expression on LCMV-specific CD8 T cells in the spleen. (H) Viral titer in organs, as quantified by plaque assay. PFU, plaque-forming units. (I) Number of splenic LCMV-specific Tpex and Tex. (J) Frequency of Tpex (TCF-1+) and Tex (TIM-3+) virus–specific CD8 T cells in spleen. Data in (B, C, F, G, H and J) are representative of 3 independent experiments with 4–5 mice/group. Data in (D, E, and I) show combined data from two of three independent experiments. Symbols represent individual mice, bars show mean value of all animals analyzed and error bars indicate SEM. Significance was determined using unpaired Student’s t-test *P < 0.05, **P < 0.01, ***P < 0.001. ns, not significant.
Fig. 2:
Fig. 2:. Level of CD28 expression differentially impacts Tpex and Tex.
(A) Experimental layout: Cd28fl/fl CreERT2neg (control, black), Cd28fl/wt CreERT2+ (heterozygous, blue) and Cd28fl/fl CreERT2+ (homozygous, red) P14 T cells were co-transferred 50:50 (1,000 cells each) to C57BL/6J mice (depleted of CD4 T cells) the day before LCMV clone 13 infection. Mice that had been adoptively transferred with P14 T cells received tamoxifen 45 days post infection (DPI) and analyses in C-F were performed in spleen 45 days post tamoxifen (DPT). Analyses in C-F are on the entire population of transferred P14 T cells, without prior gating according to CD28 level. (B) Frequency of co-transferred P14 cells, 45 days post infection (DPI). (C) Frequency and absolute number of each P14 T cell population among Tpex (TCF-1+) and (D) Tex (CD39+). (E-F) Ki-67 expression. (G) Representative flow cytometry plots showing phenotypic characterization of P14 T cells: control (black) and Cd28fl/fl CreERT2+ gated on CD28neg (red) as shown in Fig S6A. Data in (B-G) are representative of 3 independent experiments with four to six mice per group. Data in (B) show combined data from two of three independent experiments; (C-F) show combined data of all three independent experiments. Symbols represent individual mice, bars show mean value of all animals analyzed and error bars indicate SEM. Connecting lines between symbols link cells analyzed from the same mouse. Significance in (C-F) was determined using a paired Student’s t-test. *P < 0.05, **P < 0.01, ***P < 0.001, ****P < 0.0001.
Fig. 3:
Fig. 3:. Level of CD28 expression impacts Tpex self-renewal and differentiation.
(A) Experimental layout: control Cd28fl/fl CreERT2neg, heterozygous Cd28fl/wt CreERT2+ and homozygous Cd28fl/fl CreERT2+ mice with established life-long LCMV chronic infection received tamoxifen treatment. 15–21 days post tamoxifen, CD28hi (black), CD28int (blue) and CD28neg (red) CD45.2 Tpex were sorted, CellTrace Violet (CTV)-labeled and transferred into infection matched CD45.1 recipients. Analysis was performed 4–5 weeks post-transfer. (B) Representative flow cytometry plots showing the frequency of CD45.2+ donor cells among CD8 T cells in spleen (left) and lung (right) of CD45.1 recipient mice. (C) Total number of CD45.2+ donor CD8 T cells recovered in spleen and (D) lung. (E) Representative CD39 and TCF-1 expression on donor CD45.2+ cells in spleen. (F) Frequency and (G) total number of differentiated donor CD39+ Tex in spleen. (H-I) Frequency of divided cells (CTVlow) among TCF-1+ CD45.2+ T cells in spleen. (J) Total number of donor TCF-1+ Tpex in spleen. (K) Frequency of CD39+ differentiated cells among divided (CTVlow) transferred cells in spleen. Data in (B-K) are representative of 4 independent experiments with two to five mice per group. Data in (C-D, F-G and I-K) show combined data from all experiments. Symbols represent individual mice, bars show mean value of all animals analyzed and error bars indicate SEM. Significance was determined using (C-D, F-G and I-J) Kruskall-Wallis with Dunn’s correction for multiple comparisons, (K) Mann-Whitney. *P < 0.05, **P < 0.01, ***P < 0.001, ****P < 0.0001.
Fig. 4:
Fig. 4:. CD28 regulates Tpex metabolism.
(A) P14 Tpex (CD73+ CD39neg) and P14 Tex (CD39+) control (Cd28fl/fl CreERT2neg) or CD28neg (homozygous Cd28fl/fl CreERT2) were sorted from life-long LCMV chronically infected mice 2-weeks post tamoxifen for RNA sequencing analysis. Gene set enrichment analysis (GSEA) shows Hallmark Oxidative Phosphorylation gene set in CD28+ versus CD28neg Tpex. (B-H) Tpex control, CD28int and CD28neg were sorted as described in Fig. 3A and S7A and used for metabolic analysis by seahorse (B, C, G and H) or electron microscopy (E and F). (B) Extracellular flux analysis showing oxygen consumption rate (OCR) of sorted CD28hi (control), CD28int and CD28neg Tpex 15 days post tamoxifen. (C) Spare respiratory capacity (SRC) calculated as difference between maximal and basal OCR normalized to the mean of control CD28hi Tpex. (D) MitoSOX (mitochondrial reactive oxygen species) staining in CD28hi (black, from Cd28fl/fl CreERT2neg mice), CD28int (blue, from Cd28fl/wt CreERT2+ mice) and CD28neg (red, from Cd28fl/fl CreERT2+) splenic Tpex from life-long LCMV chronically infected animals, 15 days post tamoxifen. (E) Electron microscopy of CD28hi, CD28int and CD28neg sorted Tpex 15 days post tamoxifen. Black arrows highlight healthy mitochondria with organized cristae, red arrows point to disorganized mitochondria. Manification 50000X, scale bar is 500 nm, bottom images are an enlargement (x3) of the field highlighted on top images, scale bar is 167 nm. (F) Maximal cristae width, symbols represent measurements for individual crista. (G) Extracellular acidification rate (ECAR) of sorted CD28hi (black), CD28int (blue) and CD28neg (red) Tpex 15 days post tamoxifen. (H) Maximum ECAR post-stimulation, glycolytic reserve and compensatory glycolysis of CD28hi (black), CD28int (blue) and CD28neg (red) Tpex. (I-J) Splenocytes from life-long LCMV chronically infected P14-chimera mice were stimulated with GP33 peptide with or without αCD28. (I) 2-NBDG uptake by P14 after 6h of stimulation. (J) IRF4 expression on P14 stimulated for 24h. Data in (B and G) are representative of 3 independent experiments with two to three samples per group, symbol represent mean value of all replicates analyzed and error bars indicate SEM. Data in (D, I, and J) are representative of 3 independent experiments with three to five mice per group. Data in (C and H) show combined data from three independent experiments. Symbols show individual replicates (C, H, I and J) or mice (D), bars show mean value of all samples analyzed and error bars indicate SEM. (C, D, F, H, I, and J) Significance was determined using ANOVA with Sidak’s correction for multiple comparisons *P < 0.05, **P < 0.01, ***P < 0.001, ****P < 0.0001.
Fig. 5:
Fig. 5:. Enhancing CD28 signaling improves effector-like Tex differentiation.
(A) Experimental layout: CellTrace Violet (CTV)-labeled CD45.2 CD39neg PD-1+ Tpex sorted from life-long LCMV chronically infected animals were transferred into infection-matched CD45.1 recipient mice. Tpex were sorted without CD28 staining (control, untouched CD28) or with anti-CD28 antibody. (B-H) show data in spleen of recipient mice 14 days post-transfer. (B) Frequency and (C) Number of CD45.2+ donor cells. (D) Expression of TCF-1, CD39 and CTV among CD45.2+ donor CD8 T cells. (E) Frequency of CX3CR1+ effector-like Tex among CD39+ Tex cells; endogenous PD-1+ Tex (open circles), CD28-untouched donor cells (black) and CD28-stimulated donor cells (green). (F) Number of effector-like Tex (CX3CR1+ CD39+) and terminally differentiated Tex (CX3CR1neg CD39+) CD45.2+ CD8 T cells. (G) Representative frequency of divided (CTVlow) cells among TCF-1+ CD45.2+ CD8 T cells. (H) Number of divided (CTVlow) and total CD45.2+ Tpex. Data in (B-H) are representative of 2 independent experiments with three to five mice per group. Data in (C, E, F and H) show combined data from two independent experiments. Symbols represent individual mice, bars show mean value of all animals analyzed and error bars indicate SEM. Significance was determined using (C, F and H) Mann-Whitney, (E) Kruskall-Wallis with Dunn’s correction for multiple comparisons *P < 0.05, **P < 0.01.

References

    1. Hashimoto M, Kamphorst AO, Im SJ, Kissick HT, Pillai RN, Ramalingam SS, Araki K, Ahmed R, CD8 T Cell Exhaustion in Chronic Infection and Cancer: Opportunities for Interventions. Annu Rev Med 69, 301–318 (2018). - PubMed
    1. McLane LM, Abdel-Hakeem MS, Wherry EJ, CD8 T Cell Exhaustion During Chronic Viral Infection and Cancer. Annu Rev Immunol 37, 457–495 (2019). - PubMed
    1. Wu T, Ji Y, Moseman EA, Xu HC, Manglani M, Kirby M, Anderson SM, Handon R, Kenyon E, Elkahloun A, Wu W, Lang PA, Gattinoni L, McGavern DB, Schwartzberg PL, The TCF1-Bcl6 axis counteracts type I interferon to repress exhaustion and maintain T cell stemness. Sci Immunol 1, eaai8593 (2016). - PMC - PubMed
    1. Utzschneider DT, Charmoy M, Chennupati V, Pousse L, Ferreira DP, Calderon-Copete S, Danilo M, Alfei F, Hofmann M, Wieland D, Pradervand S, Thimme R, Zehn D, Held W, T Cell Factor 1-Expressing Memory-like CD8(+) T Cells Sustain the Immune Response to Chronic Viral Infections. Immunity 45, 415–427 (2016). - PubMed
    1. He R, Hou S, Liu C, Zhang A, Bai Q, Han M, Yang Y, Wei G, Shen T, Yang X, Xu L, Chen X, Hao Y, Wang P, Zhu C, Ou J, Liang H, Ni T, Zhang X, Zhou X, Deng K, Chen Y, Luo Y, Xu J, Qi H, Wu Y, Ye L, Follicular CXCR5- expressing CD8(+) T cells curtail chronic viral infection. Nature 537, 412–428 (2016). - PubMed

Publication types

MeSH terms

Substances