. 2023 Sep 11;41(9):1606-1620.e8.
doi: 10.1016/j.ccell.2023.07.002. Epub 2023 Aug 24.

KRASG12D inhibition reprograms the microenvironment of early and advanced pancreatic cancer to promote FAS-mediated killing by CD8+ T cells

Affiliations

KRASG12D inhibition reprograms the microenvironment of early and advanced pancreatic cancer to promote FAS-mediated killing by CD8+ T cells

Krishnan K Mahadevan et al. Cancer Cell. .

Abstract

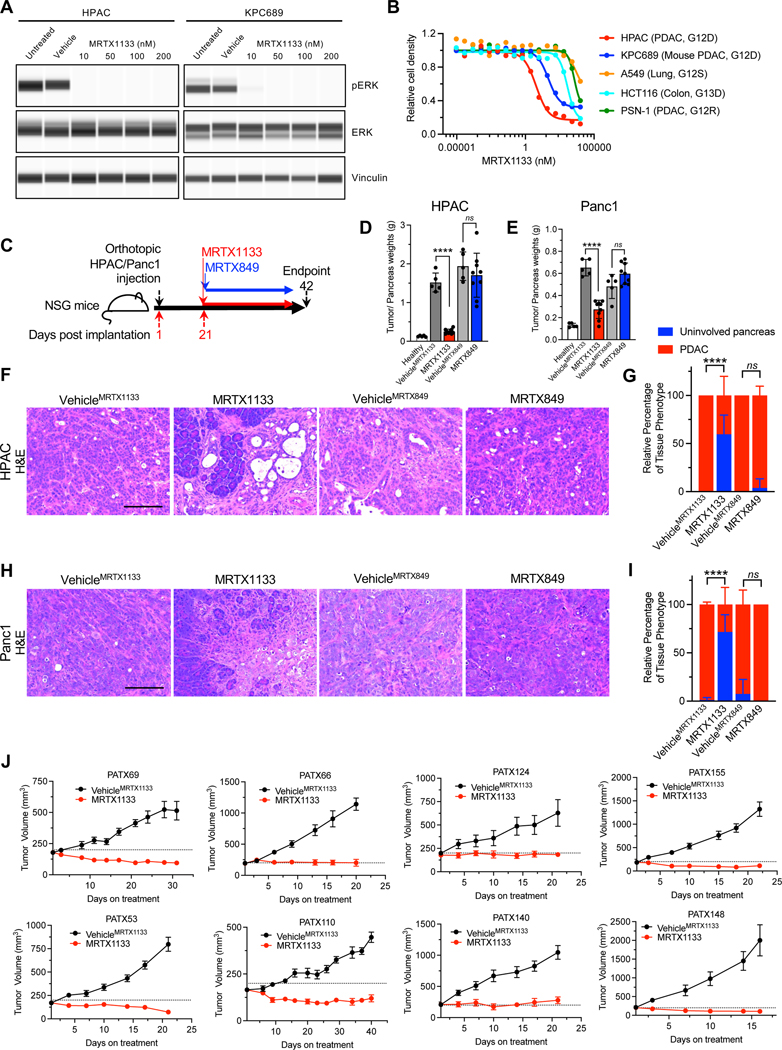
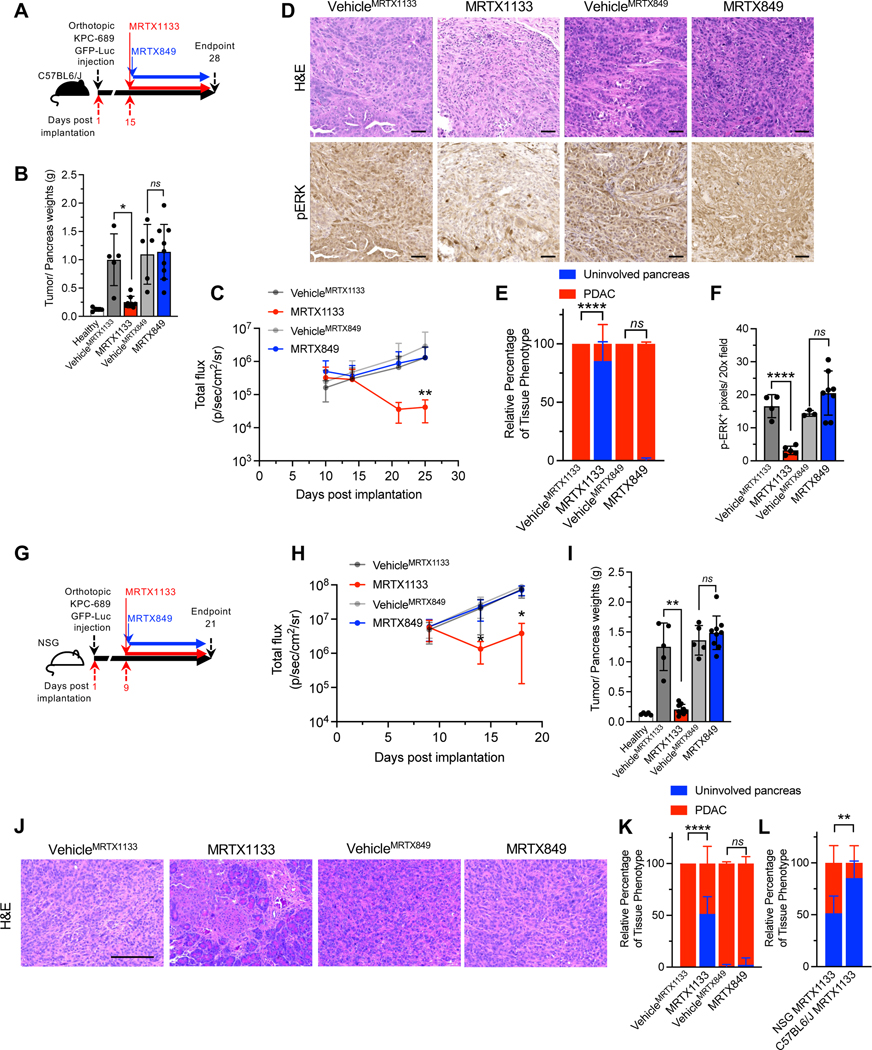
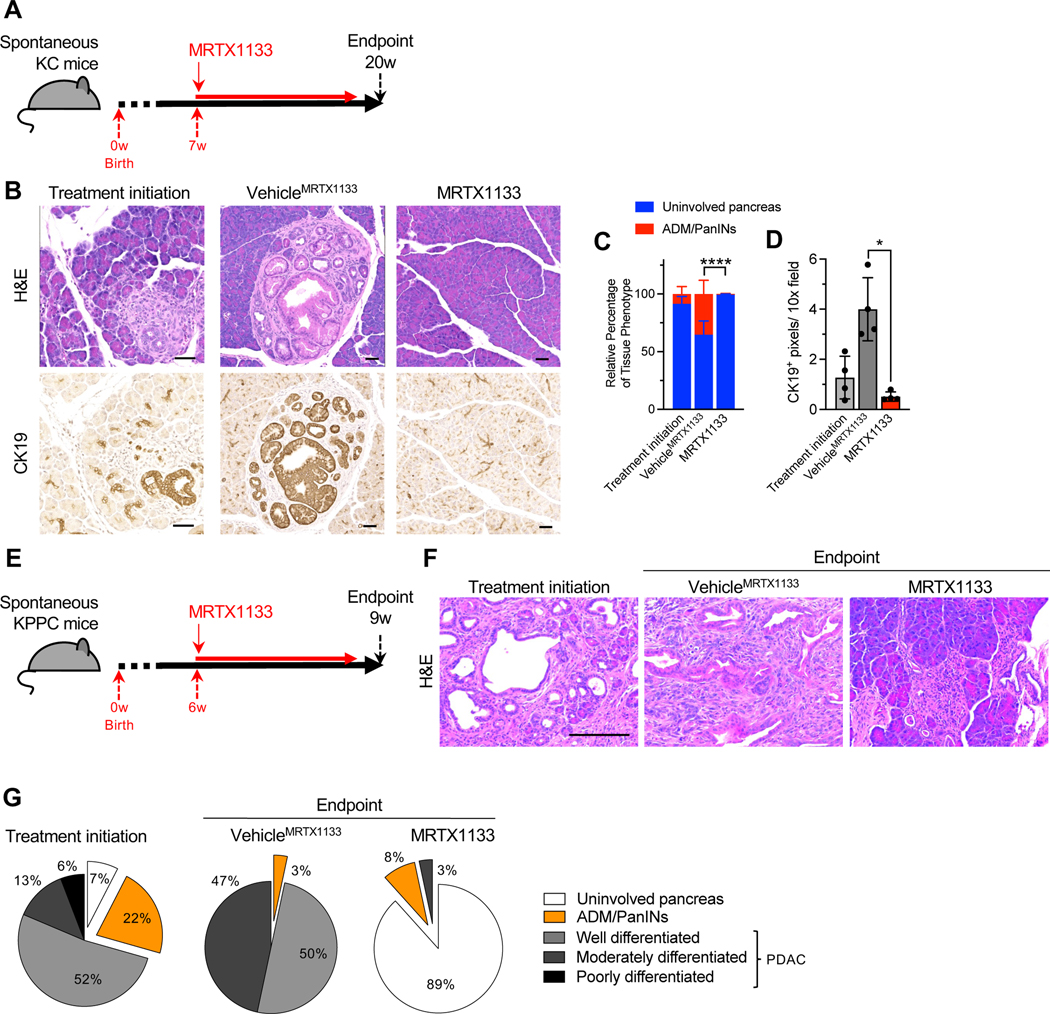
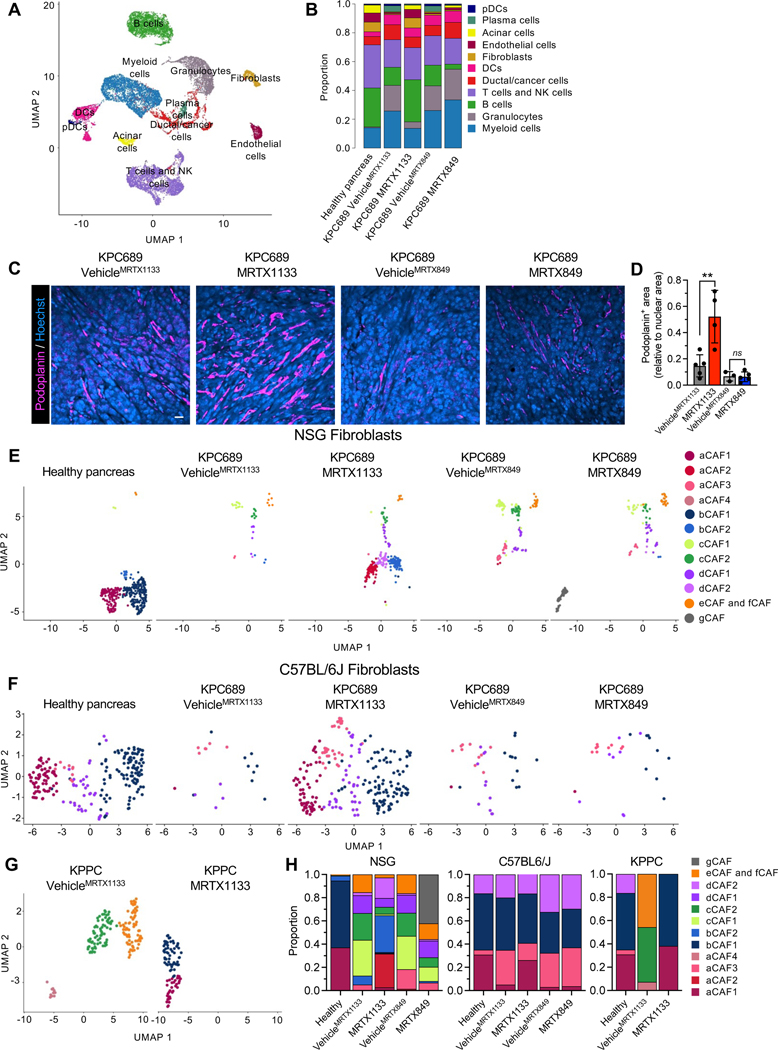
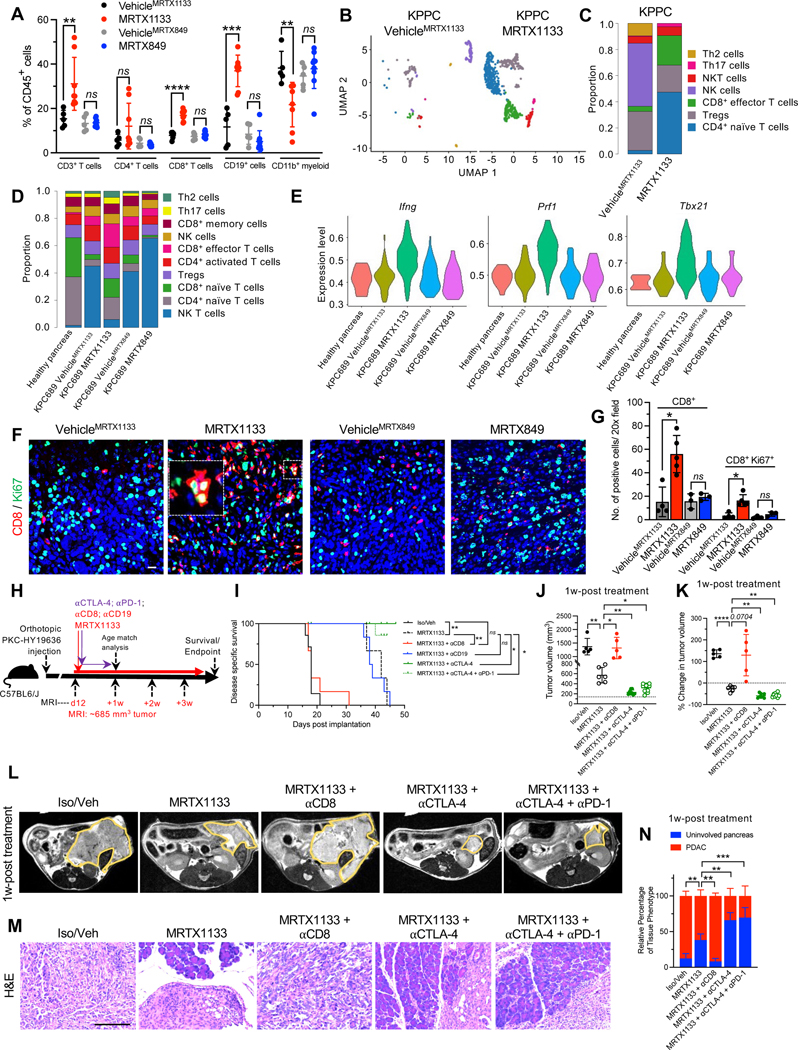
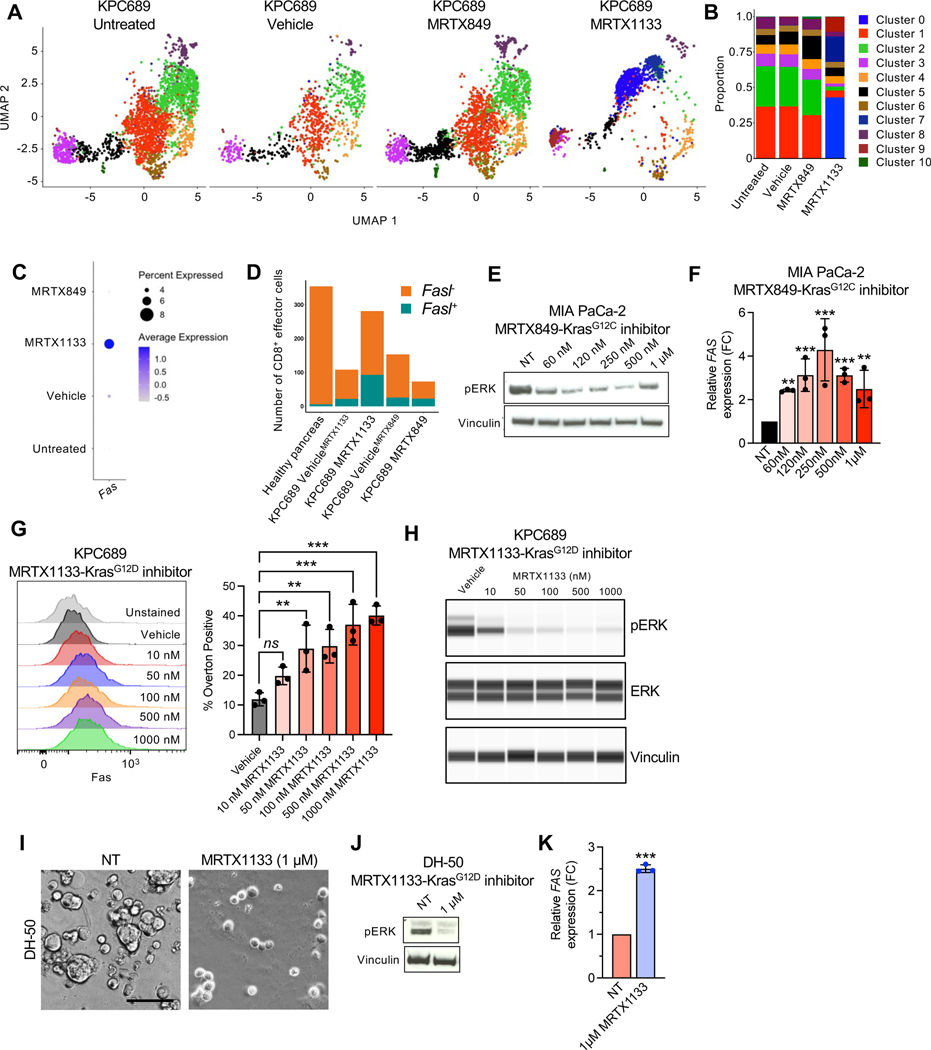
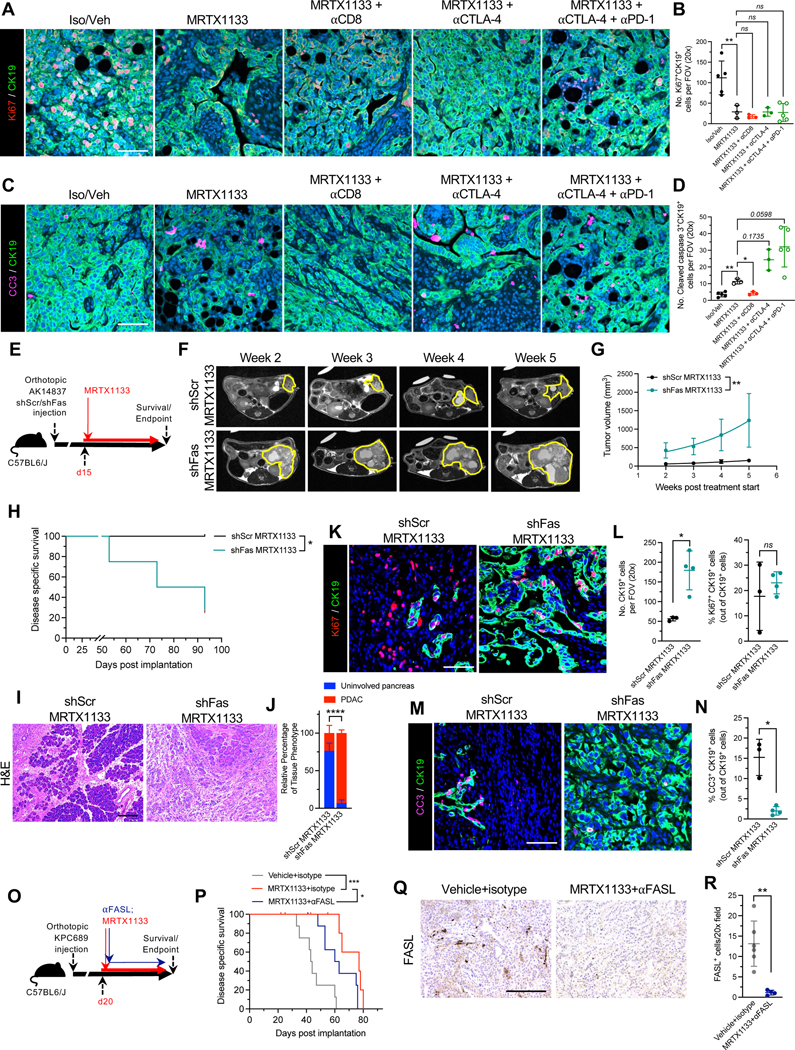
The KRASG12D mutation is present in nearly half of pancreatic adenocarcinomas (PDAC). We investigated the effects of inhibiting the KRASG12D mutant protein with MRTX1133, a non-covalent small molecule inhibitor of KRASG12D, on early and advanced PDAC and its influence on the tumor microenvironment. Employing 16 different models of KRASG12D-driven PDAC, we demonstrate that MRTX1133 reverses early PDAC growth, increases intratumoral CD8+ effector T cells, decreases myeloid infiltration, and reprograms cancer-associated fibroblasts. MRTX1133 leads to regression of both established PanINs and advanced PDAC. Regression of advanced PDAC requires CD8+ T cells and immune checkpoint blockade (ICB) synergizes with MRTX1133 to eradicate PDAC and prolong overall survival. Mechanistically, inhibition of KRASG12D in advanced PDAC and human patient derived organoids induces FAS expression in cancer cells and facilitates CD8+ T cell-mediated death. Collectively, this study provides a rationale for a synergistic combination of MRTX1133 with ICB in clinical trials.


Conflict of interest statement

Declaration of interests A.M. receives royalties for a pancreatic cancer biomarker test from Cosmos Wisdom Biotechnology, and this financial relationship is managed and monitored by the UTMDACC Conflict of Interest Committee. A.M. is also listed as an inventor on a patent that has been licensed by Johns Hopkins University to Thrive Earlier Detection and serves as a consultant for Freenome and Tezcat Biosciences.

Figures

Figure 1:
Figure 1:. KRAS* inhibition controls the growth of human cell lines and PDXs.
(A) Capillary immunoassay for pERK and vinculin abundance in HPAC and KPC689 cells in response to MRTX1133. Vehicle: DMSO. (B) Cell proliferation in response to MRTX1133. Cell lines and tissue of origin, and mutational status of KRAS/Kras are listed in parentheses (n=3 biological replicates/group). (C) Schematic of orthotopic experiments in NSG mice with HPAC and Panc1. Treatment started at day 21, and mice were euthanized at day 42. (D-E) Tumor/pancreas weights at endpoint for orthotopic HPAC (Healthy: n=5, VehicleMRTX1133: n=5, MRTX1133: n=9, VehicleMRTX849: n=5, MRTX849: n=9) (D) and Panc1 (Healthy: n=5, VehicleMRTX1133: n=5, MRTX1133: n=9, VehicleMRTX849: n=5, MRTX849: n=9) (E). The same pancreas weights for healthy are presented in both (D) and (E). (F-I) Histological analyses of orthotopic HPAC (VehicleMRTX1133: n=4, MRTX1133: n=5, VehicleMRTX849: n=4, MRTX849: n=6) and Panc1 (VehicleMRTX1133: n=5, MRTX1133: n=4, VehicleMRTX849: n=4, MRTX849: n=5) tumors. (F) Representative H&E images of orthotopic HPAC tumors with the indicated treatments. (G) Histological scoring of orthotopic HPAC tumors. (H) Representative H&E images of orthotopic Panc1 tumors with the indicated treatments. (I) Histological scoring of orthotopic Panc1 tumors. (J) Tumor growth curves of PDXs implanted subcutaneously into athymic nude mice. PATX148: n=5 mice per group; PATX140: VehicleMRTX1133 n=6 mice per group, MRTX1133 n=5 mice per group; PATX124: n=6 mice per group; PATX155: n=6 mice per group; PATX110: n=6 mice per group; PATX53: VehicleMRTX1133 n=5 mice per group, MRTX1133 n=6 mice per group; PATX66: n=6 mice per group; PATX69: n=6 mice per group. In D, E, G, I and J data are presented as mean ± SD. Significance was determined by unpaired t-test in D, E and by two-way ANOVA with Tukey’s multiple comparisons test in G and I. **** P<0.0001, ns: not significant. Scale bars: 100 μm. See also figures S1–S3.
Figure 2:
Figure 2:. The efficacy of KRAS* inhibition in immunocompetent and immunodeficient backgrounds.
(A) Schematic of experiments with C57BL6/J mice orthotopically implanted with KPC689. Treatment started at day 15, and mice were euthanized at day 28. (B) Tumor/pancreas weights of orthotopic KPC689 tumors in C57BL6/J mice at endpoint (Healthy: n=5, VehicleMRTX1133: n=5, MRTX1133: n=8, VehicleMRTX849: n=5, MRTX849: n=9). (C) Bioluminescence of orthotopic KPC689 tumors in C57BL6/J mice over time. Treatment was initiated at day 15 (VehicleMRTX1133: n=5, MRTX1133: n=9 , VehicleMRTX849: n=5, MRTX849: n=9). (D-F) Representative H&E (VehicleMRTX1133: n=4, MRTX1133: n=6, VehicleMRTX849: n=5, MRTX849: n=8) and pERK (VehicleMRTX1133: n=4, MRTX1133: n=5 , VehicleMRTX849: n=3, MRTX849: n=8) immunostaining images of the pancreata of C57BL6/J mice orthotopically implanted with KPC689 (D) and quantification (E-F). Scale bar, 50 μm. (G) Schematic of experiments with NSG mice orthotopically implanted with KPC689. Treatment started at day 9, and mice were euthanized at day 21. (H) Bioluminescence of orthotopic KPC689 tumors in NSG mice over time. Treatment was initiated at day 9 (VehicleMRTX1133: n=5, MRTX1133: n=9 , VehicleMRTX849: n=5, MRTX849: n=10) (I) Tumor/pancreas weights of orthotopic KPC689 tumors in NSG mice at endpoint (VehicleMRTX1133: n=5, MRTX1133: n=9, VehicleMRTX849: n=5, MRTX849: n=9). Healthy pancreas weights are presented in Fig. 1D and 1E. (J-K) Representative H&E images of the pancreata of NSG mice orthotopically implanted with KPC689 (J) and quantification (VehicleMRTX1133: n=5, MRTX1133: n=6 , VehicleMRTX849: n=4, MRTX849: n=9) (K). Scale bar: 100 μm. (L) Histological scoring of the pancreata of MRTX1133 treated NSG and C57BL6/J mice orthotopically implanted with KPC689 at endpoint. Data included in this plot are also presented in panel (K) and (E). In B, C, E, F, H, I, K and L data are presented as mean ± SD. In B and I, unpaired t-test was used for comparison of VehicleMRTX849 and MRTX849 and Welch’s correction was used for VehicleMRTX1133 and MRTX1133 comparisons. In E and K, two-way ANOVA with Tukey’s multiple comparisons test was used. In L, two-way ANOVA with Sidak’s multiple comparison test was used. In C and H, significance was determined by one-way ANOVA with Sidak’s multiple comparison test and Kruskall-Wallis with Dunn’s multiple comparison test, respectively (VehicleMRTX1133 vs. MRTX1133 total flux comparisons). Significance was determined by unpaired t-test in F. * P<0.05, ** P<0.01, *** P<0.001, **** P<0.0001, ns: not significant. See also figure S3.
Figure 3:
Figure 3:. KRAS* inhibition reverses precancerous and established cancerous lesions.
(A) Schematic of spontaneous KC treatment experiments. Treatment was initiated at 7 weeks and mice euthanized at 20 weeks post-birth. (B-D) Representative H&E and CK19 immunostaining images of the pancreata of KC mice (B) and histological (Treatment initiation: n=4, VehicleMRTX1133: n=4 and MRTX1133: n=4) and CK19 immunostaining quantification (n=4 per group) (C-D). ADM: acinar to ductal metaplasia. (E) Schematic of spontaneous KPPC treatment experiments. Treatment was initiated at 6 weeks and mice euthanized at 9 weeks post-birth. (F-G) Representative H&E images of the pancreata of KPPC mice (F) and quantification (Treatment initiation: n=4, VehicleMRTX1133: n=1 and MRTX1133: n=1) (G). In C and D, data are presented as mean ± SD. Significance was determined by two-way ANOVA with Sidak’s multiple comparisons test in C and by Welch’s t-test in D. Scale bars: 100 μm. ** P<0.01, **** P<0.0001. See also Figure S4.
Figure 4:
Figure 4:. Fibroblast composition is altered in an immune-dependent manner in response to KRAS* inhibition.
Fib (A-B) UMAP (A) and relative proportions of cell types (B) of orthotopic KPC689 tumors in C57BL6/J mice determined by scRNA-seq. (C-D) Representative immunofluorescent images of podoplanin stained orthotopic KPC689 tumors in C57BL6/J mice (C) and quantification of podoplanin+ area relative to nuclear area (D). Scale bar, 25 μm. (E-G) UMAP of fibroblasts in orthotopic KPC689 tumors in NSG mice (E) and C57BL6/J mice (F) and spontaneous KPPC tumors (G) determined by scRNA-seq. (H) Relative proportions of fibroblast subsets in orthotopic KPC689 tumors in NSG mice and C57BL6/J mice, and spontaneous KPPC tumors. Data are presented as mean in B, H and as mean ± SD in D. Significance was determined by unpaired t-test in D. ** P<0.01, ns: not significant. See also Figures S5 and S6.
Figure 5:
Figure 5:. The efficacy of KRAS* inhibition is dependent on CD8+ T cells.
(A) Immunotyping by flow cytometry of orthotopic KPC689 tumors in C57BL6/J mice (VehicleMRTX1133: n=5, MRTX1133: n=8, VehicleMRTX849: n=5, MRTX849: n=9). (B-C) UMAPs and relative abundance of T cell subsets (C) of spontaneous KPPC tumors determined by scRNA-seq. (D) Relative abundance of T cell subsets of orthotopic KPC689 tumors in C57BL6/J mice determined by scRNA-seq. (E) Violin plots for Ifng, Prf1, and Txb21 expression in tumor infiltrating CD8+ effector T cells in orthotopic KPC689 C57BL6/J mice determined by scRNA-seq. (F-G) Representative immunofluorescent images (F) and quantification (G) of CD8+ and Ki67+ T cells in orthotopic KPC689 tumors in C57BL6/J mice. Scale bar: 25 μm. (VehicleMRTX1133: n=4, MRTX1133: n=5, VehicleMRTX849: n=3, MRTX849: n=3). (H) Schematic of experiments with C57BL6/J mice orthotopically implanted with PKC-HY19636. Treatment started when tumors were 685 mm3 by MRI. (I) Survival of mice with PKC-HY19636 orthotopic tumors with the indicated treatment groups (Iso/veh (n=7), MRTX1133 (n=3), MRTX1133+αCD8 (n=6), MRTX1133+αCTLA-4 (n=5), MRTX1133+αCTLA-4+αPD-1 (n=9), MRTX1133+αCD19 (n=6)) (J) Tumor volumes at 1 week post treatment initiation in the indicated treatment groups by MRI (Iso/veh (n=5), MRTX1133 (n=6), MRTX1133+αCD8 (n=5), MRTX1133+αCTLA-4 (n=8), MRTX1133+αCTLA-4+αPD-1 (n=10)). (K) Change in tumor volumes of indicated groups compared to baseline by MRI (Iso/veh (n=5), MRTX1133 (n=6), MRTX1133+αCD8 (n=5), MRTX1133+αCTLA-4 (n=8), MRTX1133+αCTLA-4+αPD-1 (n=10)). (L) Representative MRI of tumor burden 1 week post treatment initiation. (M) Representative H&E of the pancreas in the indicated group and (N) associated histopathological scoring (Iso/veh (n=5), MRTX1133 (n=3), MRTX1133 + αCD8 (n=3), MRTX1133 + αCTLA-4 (n=3), MRTX1133+ αCTLA-4 + αPD-1(n=3)). Scale bar: 100 μm. Data are presented as mean + SD in A, G, J, K and N; as mean in C and D, and as violin plots in E. In A, Mann-Whitney test was used for CD4+ T cells comparisons, comparisons between VehicleMRTX1133 and MRTX1133 for CD3+ T cells, and comparisons between VehicleMRTX849 and MRTX849 for CD19+ cells. Unpaired t-test was used for all other comparisons in A. In G, Mann-Whitney test was used for the comparisons between VehicleMRTX1133 and MRTX1133 and unpaired t-test was used for all other comparisons. In J and K, Brown-Forsythe ANOVA with Dunnett’s T3 multiple comparisons test was used to determine significance. In N, two-way ANOVA with Dunnett’s multiple comparisons test was used to determine significance. In I, log rank test was used to determine significance. * P<0.05, ** P<0.01, *** P<0.001, **** P<0.0001, ns: not significant. See also Figures S7–S9.
Figure 6:
Figure 6:. KRAS* inhibition induces FAS expression in cancer cells.
(A) UMAP projections and relative proportions of each cluster (B) of KPC689 cells evaluated by scRNA-seq analysis. (C) Expression of Fas in KPC689 cells evaluated by scRNA-seq analysis. (D) Number of CD8+ effector cells with Fasl (Fasl+) or without Fasl (Fasl) expression in KPC689 tumors in C57BL6/J mice evaluated by scRNA-seq analysis. (E) Western blot analysis of pERK expression level in MIA PaCa-2 cells treated with KRASG12C inhibitor (MRTX849). (F) qPCR analysis of relative FAS expression in MIA PaCa-2 cells treated with KRASG12D inhibitor (MRTX1133) (n=3 biological replicates per group). (G) Representative flow plots and quantification of FAS expression at 24 hours post-treatment with vehicle (DMSO) or the indicated concentrations of MRTX1133 in KPC689 cells. n=3 biological replicates per group. (H) pERK and total ERK in KPC689 at 24 hours post-treatment with vehicle (DMSO) or the indicated concentrations of MRTX1133. (I) DH-50 organoids were treated with KRASG12D inhibitor (MRTX1133) (n=3 biological replicates per group). Representative phase-contrast microscope image. Scale bar, 50 μm. (J) Western blot analysis of pERK expression in DH-50 organoids treated with KRASG12D inhibitor (MTX1133). (K) qPCR analysis of relative FAS expression in DH-50 organoids treated with KRASG12D inhibitor (MRTX1133) (n=3 biological replicates per group). Data are presented as mean + SD in F, G, and K. Significance was determined by one-way ANOVA with Dunnett’s multiple comparisons test in F and G and by unpaired t-test in K. *P<0.05, **P<0.01, ***P<0.001, ****P<0.0001, ns: not significant. See also Figure S10.
Figure 7:
Figure 7:. FAS-FASL engagement contributes to the clearance of cancer cells following MRTX1133 treatment.
(A-B) Representative images of Ki67 (red) and CK19 (green) immunostained PKC-HY19636 tumors (A) and quantification of Ki67+CK19+ cells (B) (Iso/Veh, n=5; MRTX1133, n=3; MRTX1133 + αCD8, n=3; MRTX1133 + αCTLA-4, n=3; MRTX1133 + αCTLA-4 + αPD-1, n=5). (C-D) Representative images of cleaved caspase 3 (CC3, pink) and CK19 (green) immunostained PKC-HY19636 tumors (C) and quantification of CC3+CK19+ cells (D) (Iso/Veh, n=5; MRTX1133, n=3; MRTX1133 + αCD8, n=3; MRTX1133 + αCTLA-4, n=3; MRTX1133 + αCTLA-4 + αPD-1, n=5). (E) Schematic of treatment of AK14837 shCtrl and shFas with MRTX1133. (F-G) Representative MRI images (F) and quantification of tumor volume (G) (shCtrl, n=4; shFas, n=4). (H) Survival curve of mice with orthotopic KPC689 tumors treated with the indicated groups (shScr MRTX1133, n=4; shFas MRTX1133, n=4). (I-J) Representative H&E images (I) and associated histological scoring (J) (shScr MRTX1133, n=4; shFas MRTX1133, n=4). (K-L) Representative images of Ki67 (red) and CK19 (green) immunostained AK14837 tumors (K) and quantification (L) (shScr MRTX1133, n=3; shFas MRTX1133, n=4). (M-N) Representative images of cleaved caspase 3 (CC3, pink) and CK19 (green) immunostained AK14837 tumors (M) and quantification (N) (shScr MRTX1133, n=3; shFas MRTX1133, n=4). (O) Schematic of treatment of KPC689 with MRTX1133 and αFASL. (P) Survival curve of mice with orthotopic KPC689 tumors treated with the indicated groups (Vehicle+isotype, n=8; MRTX1133+isotype, n=9; MRTX1133+αFASL, n=9). (Q-R) Representative FASL immunostaining images (Q) and quantification (R) of KPC689 tumors (Vehicle+isotype, n=6, MRTX+αFASL, n=4). Scale bars, 100 μm. One-way ANOVA with Bonferroni’s multiple comparison test performed for (B). Brown-Forsythe ANOVA with Dunnett’s multiple comparison test performed for (D). The fits of exponential growth equations were compared for (G). Log-rank test performed for (H) and (P). Two-way ANOVA with Sidak’s multiple comparison test performed for (J). Unpaired t-test performed for right panel of (L) and unpaired Welch’s t-test performed for left panel of (L), (N), and (R). * P<0.05, ** P<0.01, *** P<0.001, ****, P<0.0001, ns: not significant. See also Figure S11.

References

    1. Raphael BJ, Hruban RH, Aguirre AJ, Moffitt RA, Yeh JJ, Stewart C, Robertson AG, Cherniack AD, Gupta M, Getz G, et al. (2017). Integrated Genomic Characterization of Pancreatic Ductal Adenocarcinoma. Cancer Cell 32, 185–203.e113. 10.1016/j.ccell.2017.07.007. - DOI - PMC - PubMed
    1. Hingorani SR, Petricoin EF, Maitra A, Rajapakse V, King C, Jacobetz MA, Ross S, Conrads TP, Veenstra TD, Hitt BA, et al. (2003). Preinvasive and invasive ductal pancreatic cancer and its early detection in the mouse. Cancer Cell 4, 437–450. 10.1016/s1535-6108(03)00309-x. - DOI - PubMed
    1. Hingorani SR, Wang L, Multani AS, Combs C, Deramaudt TB, Hruban RH, Rustgi AK, Chang S, and Tuveson DA (2005). Trp53R172H and KrasG12D cooperate to promote chromosomal instability and widely metastatic pancreatic ductal adenocarcinoma in mice. Cancer Cell 7, 469–483. 10.1016/j.ccr.2005.04.023. - DOI - PubMed
    1. Ying H, Kimmelman AC, Lyssiotis CA, Hua S, Chu GC, Fletcher-Sananikone E, Locasale JW, Son J, Zhang H, Coloff JL, et al. (2012). Oncogenic Kras maintains pancreatic tumors through regulation of anabolic glucose metabolism. Cell 149, 656–670. 10.1016/j.cell.2012.01.058. - DOI - PMC - PubMed
    1. Collins MA, Bednar F, Zhang Y, Brisset JC, Galban S, Galban CJ, Rakshit S, Flannagan KS, Adsay NV, and Pasca di Magliano M. (2012). Oncogenic Kras is required for both the initiation and maintenance of pancreatic cancer in mice. J Clin Invest 122, 639–653. 10.1172/JCI59227. - DOI - PMC - PubMed

Publication types

MeSH terms

Substances