

Elimination of oncogenic KRAS in genetic mouse models eradicates pancreatic cancer by inducing FAS-dependent apoptosis by CD8+ T cells
- PMID: 37625403
- PMCID: PMC10810082
- DOI: 10.1016/j.devcel.2023.07.025
Elimination of oncogenic KRAS in genetic mouse models eradicates pancreatic cancer by inducing FAS-dependent apoptosis by CD8+ T cells
Abstract
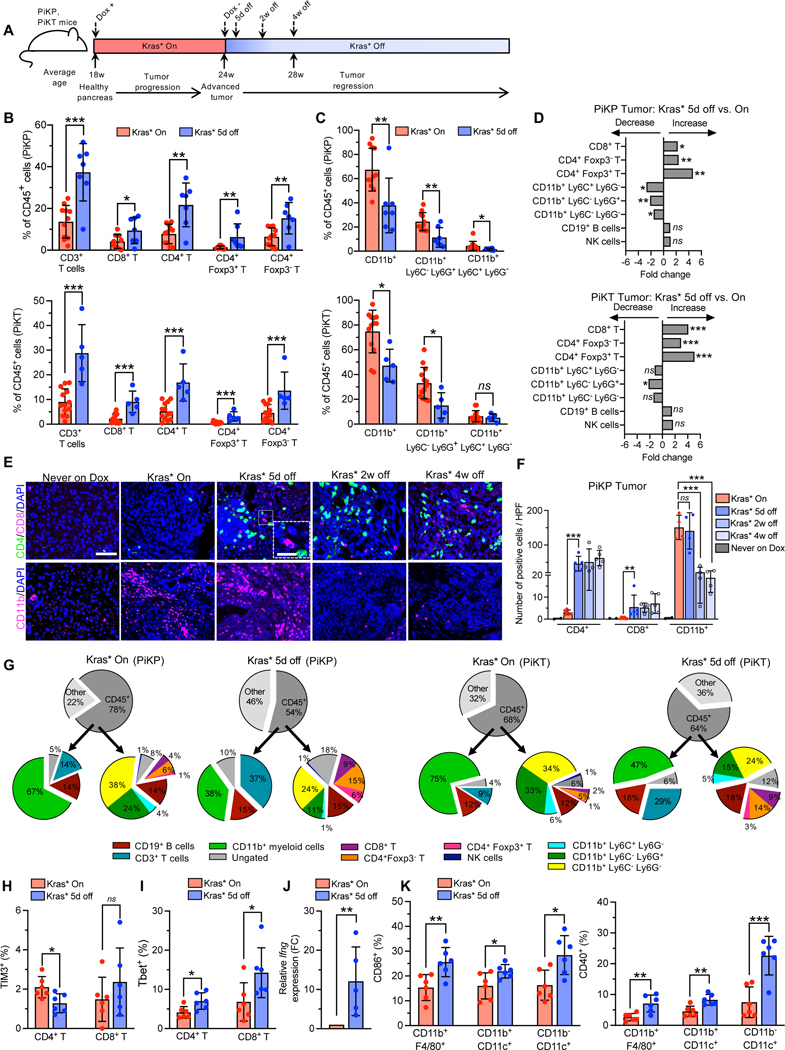
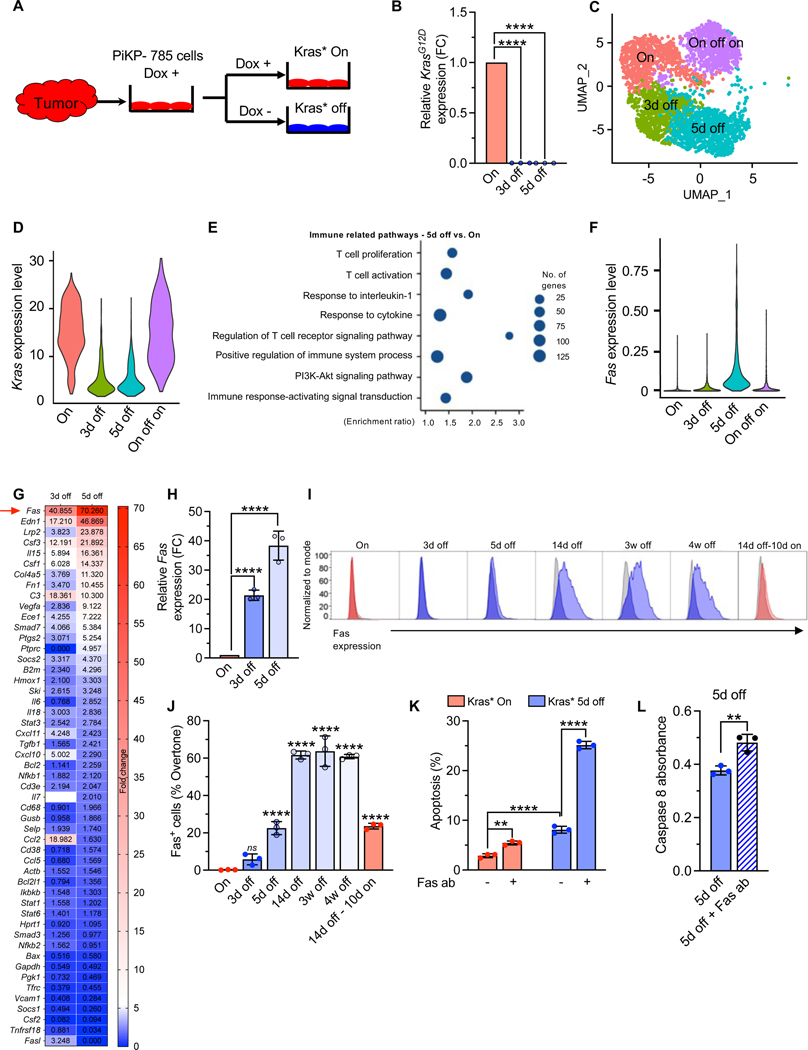
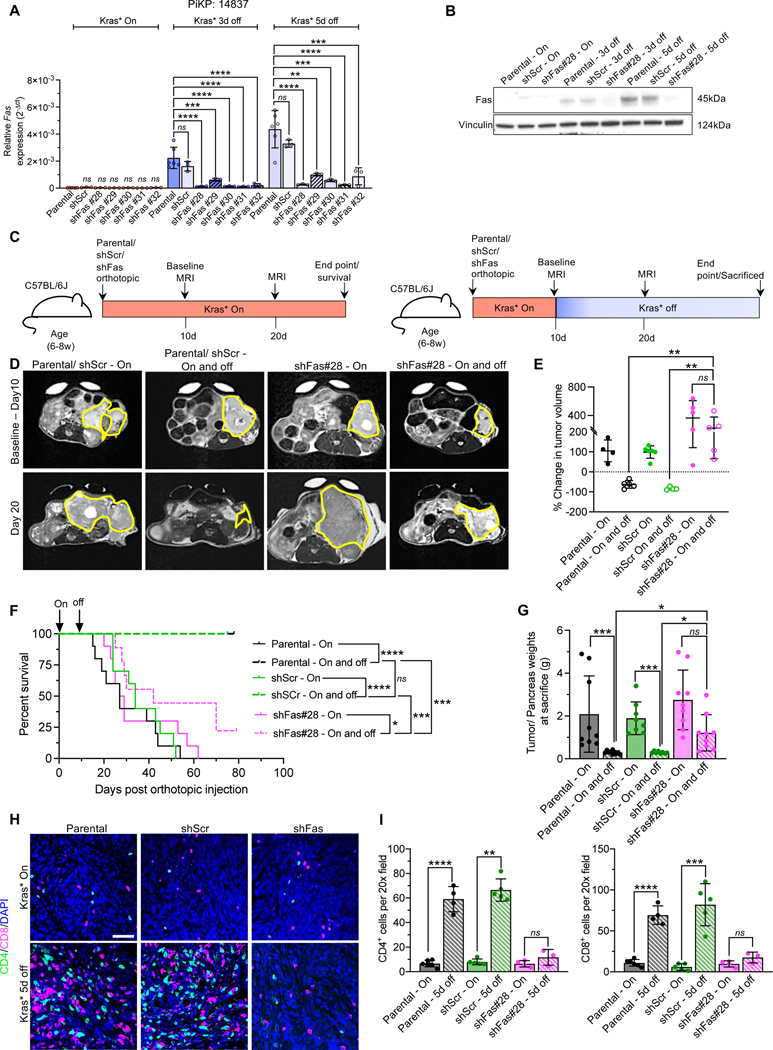
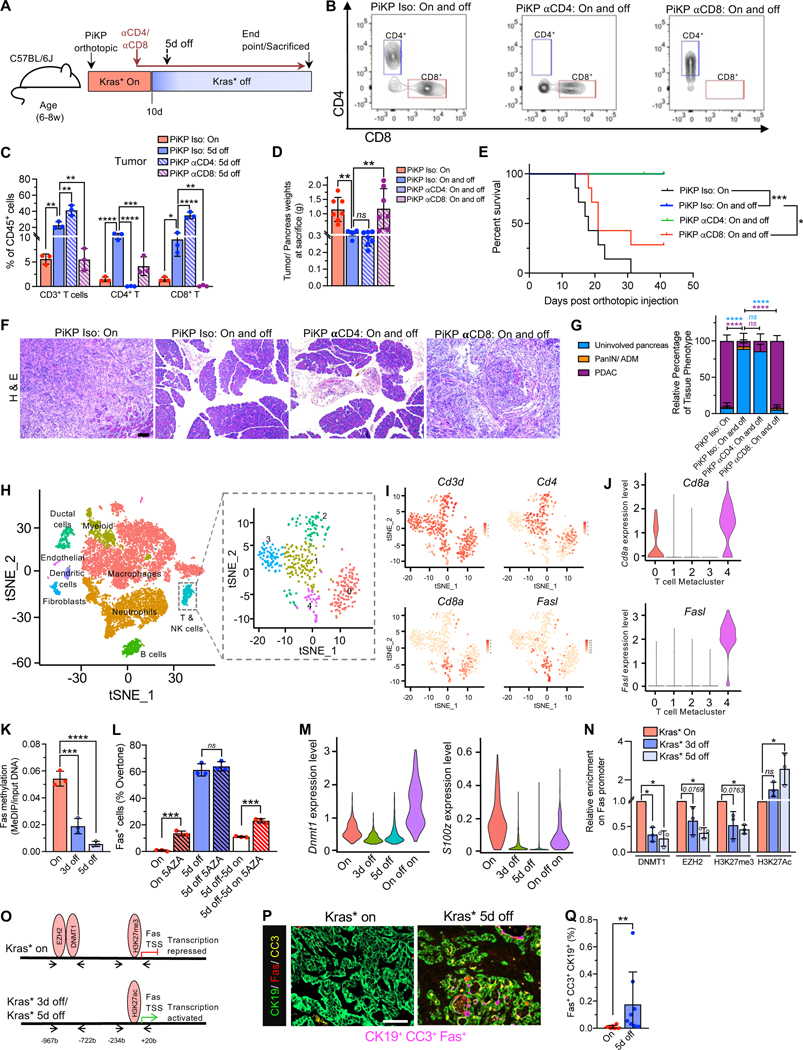
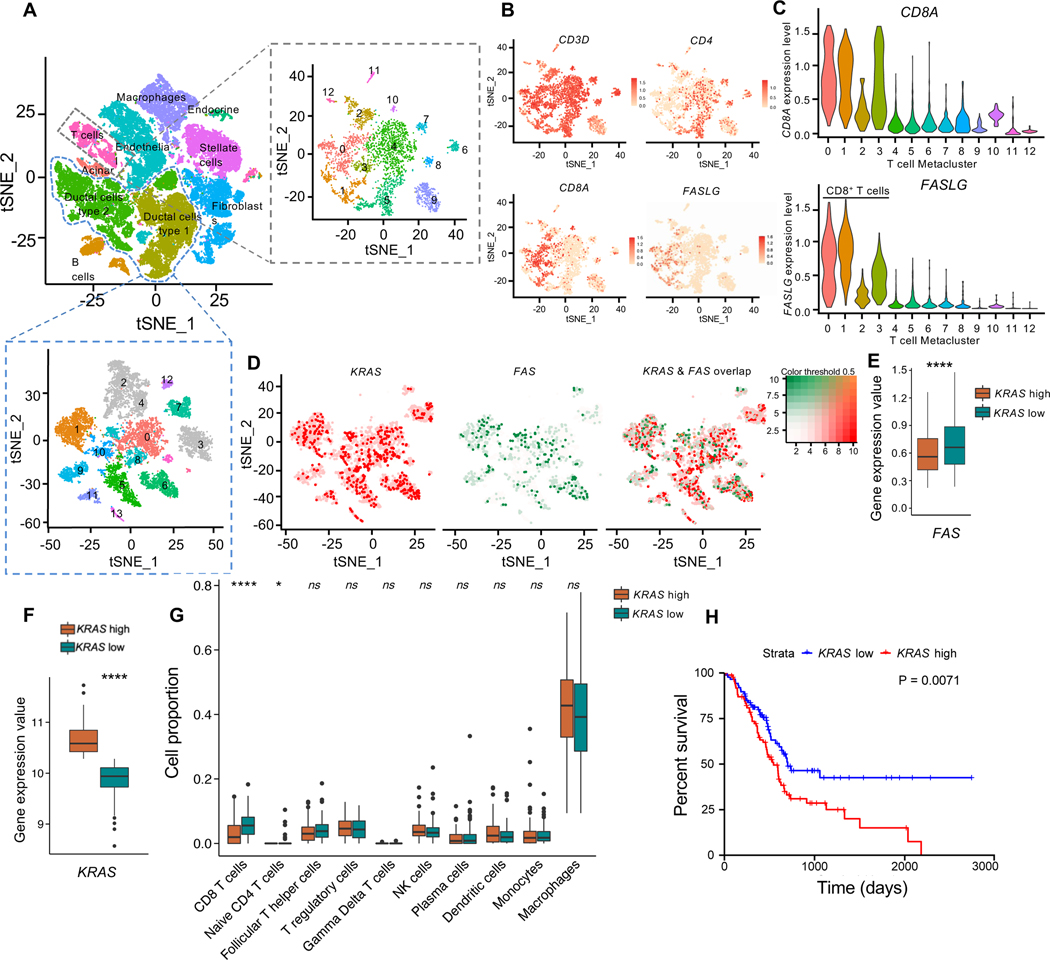
Oncogenic KRASG12D (KRAS∗) is critical for the initiation and maintenance of pancreatic ductal adenocarcinoma (PDAC) and is a known repressor of tumor immunity. Conditional elimination of KRAS∗ in genetic mouse models of PDAC leads to the reactivation of FAS, CD8+ T cell-mediated apoptosis, and complete eradication of tumors. KRAS∗ elimination recruits activated CD4+ and CD8+ T cells and promotes the activation of antigen-presenting cells. Mechanistically, KRAS∗-mediated immune evasion involves the epigenetic regulation of Fas death receptor in cancer cells, via methylation of its promoter region. Furthermore, analysis of human RNA sequencing identifies that high KRAS expression in PDAC tumors shows a lower proportion of CD8+ T cells and demonstrates shorter survival compared with tumors with low KRAS expression. This study highlights the role of CD8+ T cells in the eradication of PDAC following KRAS∗ elimination and provides a rationale for the combination of KRAS∗ targeting with immunotherapy to control PDAC.
Keywords: CD8(+) T cells; FAS-FASL; KRAS(G12D); oncogenic KRAS; pancreatic cancer.
Copyright © 2023 Elsevier Inc. All rights reserved.
Conflict of interest statement
Declaration of interests Y.C. and K.M.M. received speaker honorarium from Stellanova Therapeutics. V.S.L. is a Scientific Advisory Board member and stockholder of Stellanova Therapeutics. R.A.D. is a founder, advisor, and director of Tvardi Therapeutics, Inc., cofounder and advisor to Asylia Therapeutics, Nirogy Therapeutics, Stellanova Therapeutics, and Sporos Bioventures. A.M. receives royalties from Cosmos Wisdom Biotechnology and is listed as an inventor of a patent licensed to Thrive Earlier Detection, an Exact Sciences Company. A.M. is a consultant for Freenome and Tezcat Biotechnology.
Figures
Comment in
-
KRASG12D inhibition in pancreatic cancer: Fas expression facilitates immune clearance.Dev Cell. 2023 Sep 11;58(17):1515-1516. doi: 10.1016/j.devcel.2023.08.020. Dev Cell. 2023. PMID: 37699334
References
-
- Liudahl SM, Betts CB, Sivagnanam S, Morales-Oyarvide V, da Silva A, Yuan C, Hwang S, Grossblatt-Wait A, Leis KR, Larson W, et al. (2021). Leukocyte Heterogeneity in Pancreatic Ductal Adenocarcinoma: Phenotypic and Spatial Features Associated with Clinical Outcome. Cancer Discov 11, 2014–2031. 10.1158/2159-8290.CD-20-0841. - DOI - PMC - PubMed
-
- Lamm DL., Blumenstein BA., Crawford ED., Montie JE., Scardino P., Grossman HB., Stanisic TH., Smith JA Jr., Sullivan J., Sarosdy MF., and et al. (1991). A randomized trial of intravesical doxorubicin and immunotherapy with bacille Calmette-Guerin for transitional-cell carcinoma of the bladder. N Engl J Med 325, 1205–1209. 10.1056/NEJM1991102432. - DOI - PubMed
-
- Royal RE, Levy C, Turner K, Mathur A, Hughes M, Kammula US, Sherry RM, Topalian SL, Yang JC, Lowy I, and Rosenberg SA (2010). Phase 2 trial of single agent Ipilimumab (anti-CTLA-4) for locally advanced or metastatic pancreatic adenocarcinoma. J Immunother 33, 828–833. 10.1097/CJI.0b013e3181eec14c. - DOI - PMC - PubMed
Publication types
MeSH terms
Substances
Grants and funding
LinkOut - more resources
Full Text Sources
Medical
Molecular Biology Databases
Research Materials
Miscellaneous
