. 2023 Sep 5;35(9):1661-1671.e6.
doi: 10.1016/j.cmet.2023.08.001. Epub 2023 Aug 24.

Deciphering the decline of metabolic elasticity in aging and obesity

Affiliations

Deciphering the decline of metabolic elasticity in aging and obesity

Qiuzhong Zhou et al. Cell Metab. .

Abstract

Organisms must adapt to fluctuating nutrient availability to maintain energy homeostasis. Here, we term the capacity for such adaptation and restoration "metabolic elasticity" and model it through ad libitum-fasting-refeeding cycles. Metabolic elasticity is achieved by coordinate versatility in gene expression, which we call "gene elasticity." We have developed the gene elasticity score as a systematic method to quantify the elasticity of the transcriptome across metabolically active tissues in mice and non-human primates. Genes involved in lipid and carbohydrate metabolism show high gene elasticity, and their elasticity declines with age, particularly with PPARγ dysregulation in adipose tissue. Synchronizing PPARγ activity with nutrient conditions through feeding-timed agonism optimizes their metabolic benefits and safety. We further broaden the conceptual scope of metabolic and gene elasticity to dietary challenges, revealing declines in diet-induced obesity similar to those in aging. Altogether, our findings provide a dynamic perspective on the dysmetabolic consequences of aging and obesity.

Keywords: adipocyte; adipose tissue; aging; gene elasticity; liver; metabolic decline; metabolic elasticity; muscle; nutrient challenge; obesity.


Conflict of interest statement

Declaration of interests The authors declare no competing interests.

Figures

Figure 1.
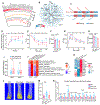
Figure 1.. Gene elasticity is connected to major metabolism pathways.
(A) Elastic changes of metabolic parameters including glucose, insulin, FFA, body weight, lean mass, and fat mass. The dots indicate the median values. The boxes cover the range from 25% (Q1) to 75% (Q3) quantile. (* p-value < 0.05, ** p-value < 0.01, One-way ANOVA with Tukey’s test). (B) A schematic diagram of RNA-seq samples of metabolic organs harvested at different nutrient states. (C) Gene Elasticity Score (GElaS) is integrated from expression dynamics, restoration extent, and statistical significance during an AL-F-R cycle. AL: Ad libitum, F: Fasting, R: Refeeding. (D) Dynamic changes of the high (top 500) and low (bottom 500) GElaS genes in eWAT during an AL-F-R cycle. Each group of genes is further divided into fasting_up-refeeding_down (Up_Dw) and fasting_down-refeeding-up (Dw_Up) regulated subgroups. The distribution of gene expression (log2FPKM) for each subgroup is plotted across AL, F, and R states. The violin plot indicates the distribution of gene expression. The dot is the median value of gene expression. The box covers an expression range from 25% (Q1) to 75% (Q3) quantile. The p-value was calculated by Mann-Whitney test (* p-value < 0.05, ** p-value < 0.01). (E) The relationship between dynamic changes (log2FC of expression) upon fasting (FvsAL) and GElaS in eWAT. (F) The numbers of enriched GO (biological processes category) in a 500-genes window sliding across the GElaS rank in eWAT. The window slides with a 100-genes step length from high to low GElaS. (G) GOs enriched in genes with high (top 500) and low (bottom 500) GElaS are plotted across each examined metabolic organ. The criterion of enrichment is FDR < 0.1. The lipid and carbohydrate biological pathways are enriched in high GElaS but not low GElaS genes. (H) Top 20 elastic genes in each metabolic organ. (I) The gene expression distribution of genes with high (top 500) and low GElaS (bottom 500) across different cell populations in eWAT. The color indicates the average expression of the high or low elastic genes in each cell type in the visualization of Uniform Manifold Approximation and Projection (UMAP).
Figure 2.
Figure 2.. Gene elasticity in the non-human primate Crab-eating macaques.
(A) Elastic changes of metabolic parameters including glucose, insulin, and FFA during the AL-F-R cycle in Crab-eating macaques. The dots indicate the median values. The boxes cover the range from 25% (Q1) to 75% (Q3) quantile. (* p-value < 0.05, ** p-value < 0.01, One-way ANOVA with Tukey’s test). (B) A schematic diagram for RNA-seq samples in the metabolic organs from the non-human primate Crab-eating macaques. (C) Dynamic changes in an AL-F-R cycle between the high (top 500) and low (bottom 500) GElaS genes in vWAT of Crab-eating macaques. Up_Dw and Dw_Up indicate the fasting_up-refeeding_down and fasting_down-refeeding-up regulated subgroups, respectively. The distribution of gene expression (log2FPKM) for each subgroup is plotted across AL, F, and R states. The violin plot indicates the distribution of gene expression. The dot is the median value of gene expression. The box covers an expression range from 25% (Q1) to 75% (Q3) quantile. The p-value was calculated by Mann-Whitney test (* p-value < 0.05, ** p-value < 0.01). (D) The numbers of enriched GO (biological processes category) in a 500-genes window sliding from the high to low GElaS in vWAT. The step length is 100bp for slide-window analysis. (E) Number of the gene in association with the lipid, glucose, and carbohydrate metabolism in the high (top 500) and low (bottom 500) GElaS genes in vWAT. (F) Several key metabolic regulators such as PCK1, APOLD1, and SREBF1 are in the top of GElaS rank in vWAT. Circle color indicates the GElaS rank. Y axis represents the Expression (Log2FPKM). p-value was calculated by limma and adjusted by Benjamini & Hochberg method (* FDR < 0.05, ** FDR < 0.01). (G) Scatter plot for elastic genes (GElaS > 0.5) in monkey and mouse. X axis is the log2(GElaS) for monkey, while Y axis represents the log2(GElaS) for mouse. The correlation analysis was performed by Pearson's correlation. (H and I) The gene expression distribution of genes with high (top 500) and low GElaS (bottom 500) across different cell populations in vWAT and liver, separately. The color indicates the average expression of the high or low elastic genes in each cell type in the UMAP visualization.
Figure 3.
Figure 3.. Gene elasticity is impaired during aging.
(A) The relative values of body weight, fat mass, and lean mass, insulin, plasma glucose, and FFA in one AL-F-R cycle. The values are normalized to the fasting state of young and aged mice, respectively. (B) The biological pathways in association with the elastic genes (blue) and the genes down-regulated during aging (red). (C) The GElaS distribution in young and aged samples. The box covers an GElaS range from 25% (Q1) to 75% (Q3) quantile. The black line in the box represents the median value of GElaS. The statistical significance of GElaS average was conducted by Mann-Whitney test. (D) The number of differential elastic genes between the young and aged mice. Up: up-regulated genes, Dw: down-regulated genes. (E) Relative expression determined by Real-Time PCR for the differential elastic genes in eWAT. The gene expression is normalized to and scaled by the expression of fasting state in both young and aged samples. (F) Relative expression by Real-Time PCR for the differential elastic genes in liver. (G) Functional enrichment (top 30) for the differential elastic genes with decreased GElaS during aging (eWAT). Data are represented as mean ± SEM (A, E, F). * p-value < 0.05, ** p-value < 0.01, p-value was calculated by the two-sided Student’s t-test (A, E, F) or by Mann-Whitney test (C).
Figure 4.
Figure 4.. PPARγ agonist treatment in different nutrient status results in distinct metabolic consequences.
(A) The TFs enriched in the genes with down-regulated GElaS in WAT during aging. The rank is according to the average ranking score (yellow line) between eWAT and sWAT. A smaller score represents a stronger enrichment. The red line indicates the number of tissues where TFs are significantly enriched. (B) Gene network of PPARγ’s target genes. The color indicates the ΔGElaS between the young and aged mice. (C) A schematic diagram of workflows for Rosi treatment in IF treatment. Aged mice were subjected to IF and Rosi treatment (as the method description). (D) Body weight changes during the treatment. n=18 (Veh), 18 (Rosi_Fast), 15/17 (Rosi_Feed). The low asterisk indicates the statistical significance between Rosi_Fast and Veh. (E) ITT for the Veh (n=17), Rosi_Fast (n=18), and Rosi_Feed (n=14) groups. The high and low asterisk indicate the statistical significance for Rosi_Fast vs. Veh and Rosi_Feed vs. Veh, respectively. (F) Area under the curve (AUC) of ITT (%). (G and H) GTT and its AUC in the three groups of mice. n=10/group. The high and low asterisk indicate the statistical significance for Rosi_Fast vs. Veh and Rosi_Feed vs. Veh, respectively. (I) The global gene expression changes induced by Rosi_Fast and Rosi_Feed treatment in eWAT and sWAT (Mann-Whitney test). The box covers a range of fold-changes from 25% (Q1) to 75% (Q3) quantile. The dot in the box indicates the median value of gene expression changes. (J) The biological processes influenced by Rosi-treatment were analyzed by GSEA (Gene Set Enrichment Analysis). The selected pathways are plotted in heatmap. These pathways are with higher NES (normalized enrichment score) in Rosi_Feed group (NES > 2.5 and FDR < 0.05). (k) The elastic scores of top-changed PPARγ’s target genes in eWAT were derived from the qPCR results. (L) Representative images of bone marrow adiposity of the femurs from the Veh, Rosi_Fast, and Rosi_Feed group mice. (M) Quantification of bone marrow adiposity in veh (n=18), Rosi_Fast (n=17), and Rosi_Feed (n=15) groups. (N) The expression of markers of cardiac hypertrophy and lipotoxicity in the heart of these mice (n = 6). Rpl23 was used as the reference gene. Data are shown as mean±SEM (D-H, M, N). * p-value < 0.05, ** p-value < 0.01 by one-way ANOVA with Tukey’s test (D-H, M, N) or by Mann-Whitney test (I).
Figure 5.
Figure 5.. Gene elasticity is impaired during high-fat diet-induced obesity.
(A) The relative values of metabolic parameters including body weight, fat mass, and lean mass, insulin, plasma glucose, and FFA in one AL-F-R cycle between chow and high-fat diet mice. The values are normalized to the fasting state of young and aged mice, respectively. Chow: chow diet, HFD: high-fat diet. Data are shown as mean±SEM. p-value was calculated by the two-sided Student’s t-test (* p-value < 0.05, ** p-value < 0.01). (B) The gene expression distribution of genes with high (top 500) and low GElaS (bottom 500) across different cell populations in high-fat diet eWAT. (C) The GElaS distribution in chow and high-fat diet samples. The black line in the box indicates the median value of GElaS. The statistical significance of GElaS average was performed by Mann-Whitney test (* p-value < 0.05, ** p-value < 0.01). (D) The number of genes with up- and down-regulated GElaS between chow and high-fat diet samples. Up: up-regulated gene, Dw: down-regulated gene. (E) Functional enrichment (top 30) for the differential elastic genes with decreased GElaS during high-fat diet (eWAT). (F and G) Scatter plot for ΔGElaS of AgedvsYoung and HFDvsChow in (F) eWAT and (G) Liver. X axis is the ΔGElaS for AgedvsYoung, while Y axis represents the ΔGElaS for HFDvsChow. The correlation analysis was conducted by Pearson's correlation.

Comment in

References

    1. Barzilai N, Huffman DM, Muzumdar RH, and Bartke A (2012). The critical role of metabolic pathways in aging. Diabetes 61, 1315–1322. - PMC - PubMed
    1. Smith HJ, Sharma A, and Mair WB (2020). Metabolic Communication and Healthy Aging: Where Should We Focus Our Energy? Dev. Cell 54, 196–211. - PMC - PubMed
    1. Lopez-Otin C, Blasco MA, Partridge L, Serrano M, and Kroemer G (2013). The hallmarks of aging. Cell 153, 1194–1217. - PMC - PubMed
    1. Goodpaster BH, and Sparks LM (2017). Metabolic Flexibility in Health and Disease. Cell Metab. 25, 1027–1036. - PMC - PubMed
    1. Riera CE, and Dillin A (2015). Tipping the metabolic scales towards increased longevity in mammals. Nat. Cell Biol 17, 196–203. - PubMed

Publication types

LinkOut - more resources