. 2023 Sep 7;30(9):1199-1216.e7.
doi: 10.1016/j.stem.2023.07.014. Epub 2023 Aug 24.

Airway stem cell reconstitution by the transplantation of primary or pluripotent stem cell-derived basal cells

Affiliations

Airway stem cell reconstitution by the transplantation of primary or pluripotent stem cell-derived basal cells

Liang Ma et al. Cell Stem Cell. .

Abstract

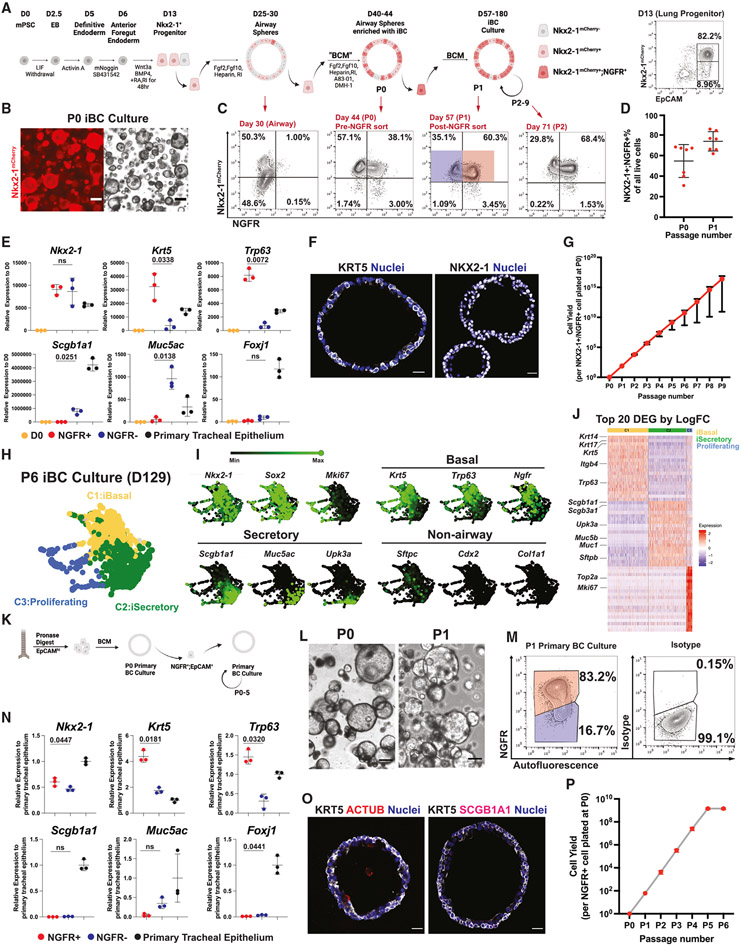
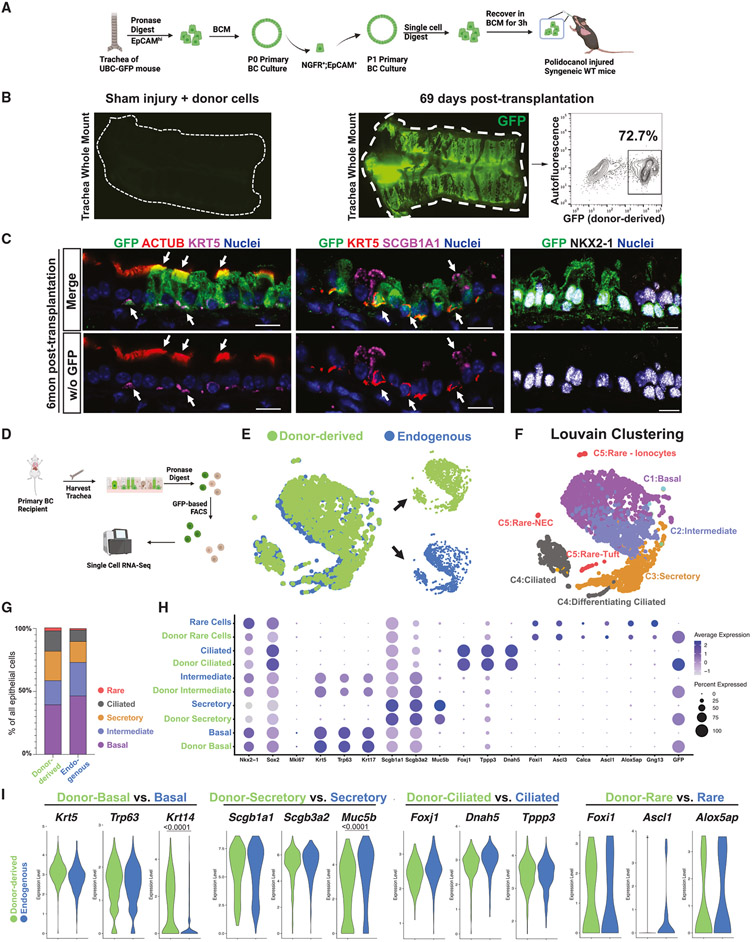
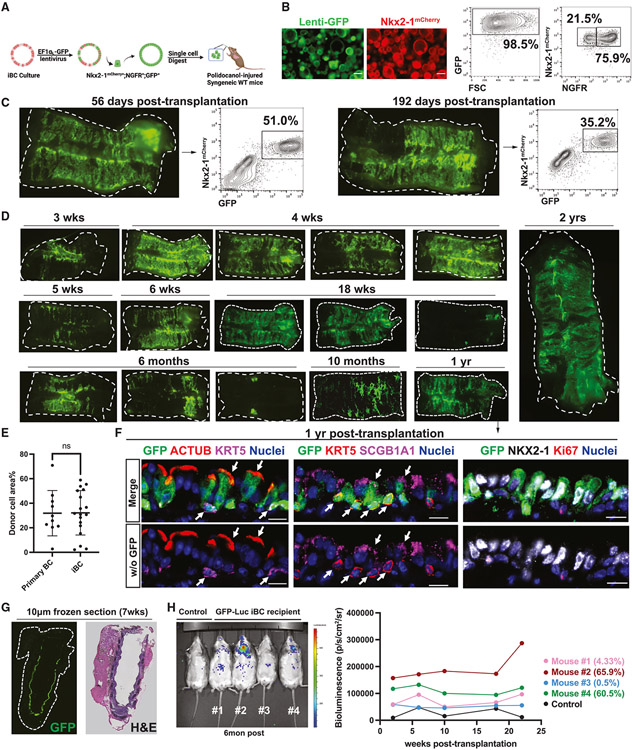
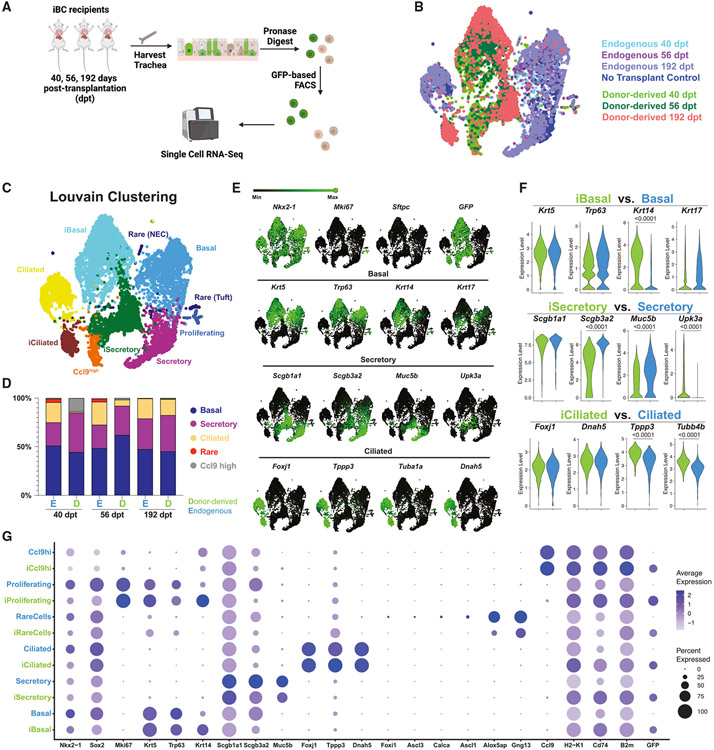
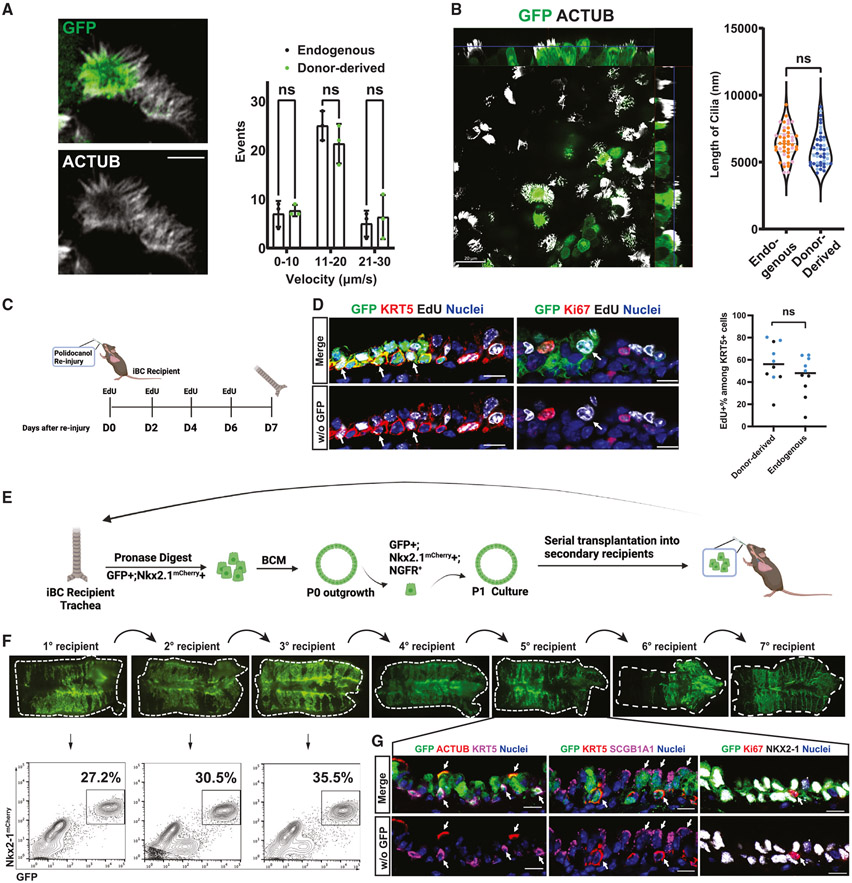
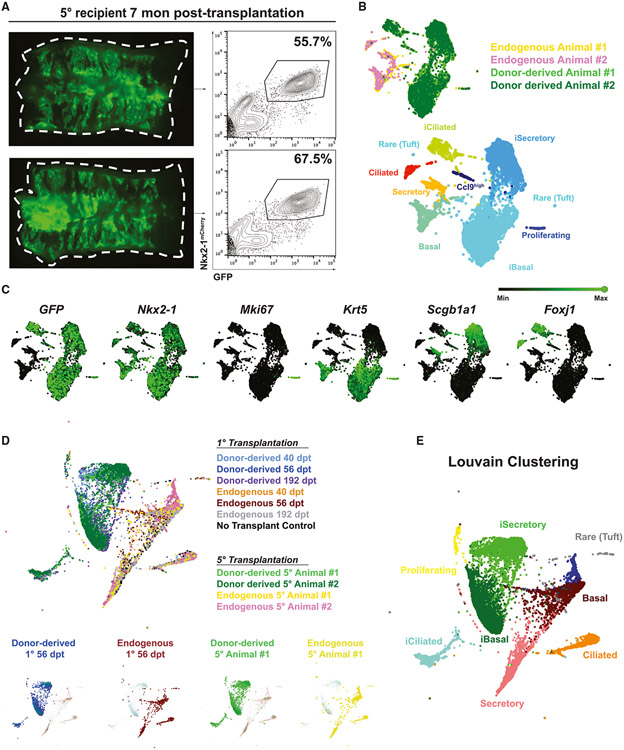
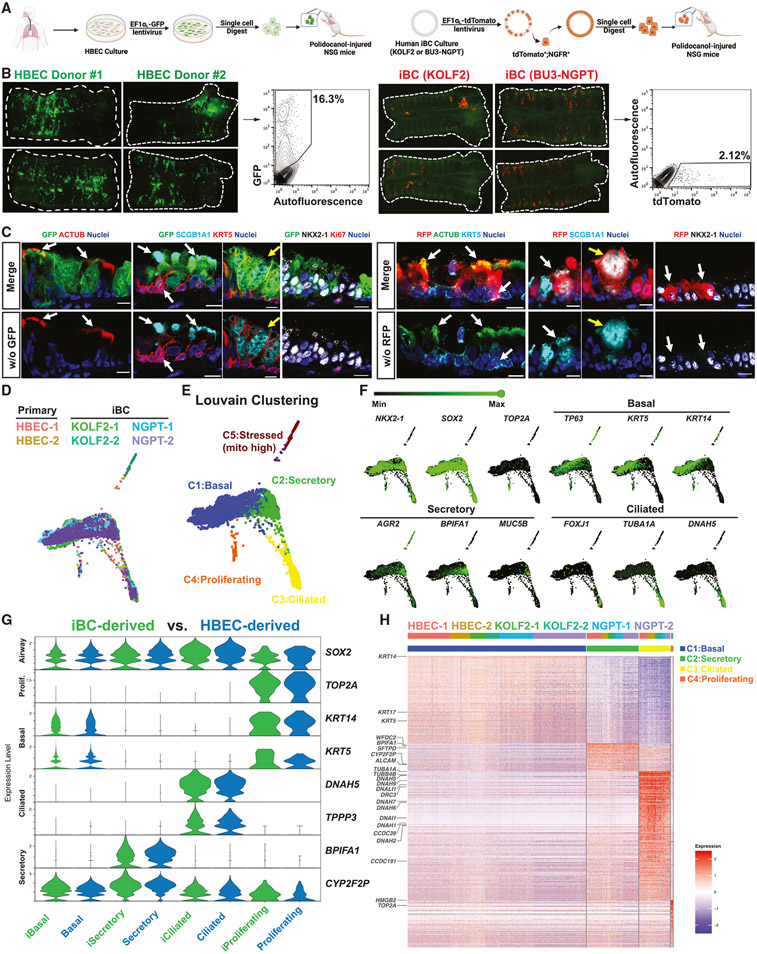
Life-long reconstitution of a tissue's resident stem cell compartment with engrafted cells has the potential to durably replenish organ function. Here, we demonstrate the engraftment of the airway epithelial stem cell compartment via intra-airway transplantation of mouse or human primary and pluripotent stem cell (PSC)-derived airway basal cells (BCs). Murine primary or PSC-derived BCs transplanted into polidocanol-injured syngeneic recipients give rise for at least two years to progeny that stably display the morphologic, molecular, and functional phenotypes of airway epithelia. The engrafted basal-like cells retain extensive self-renewal potential, evident by the capacity to reconstitute the tracheal epithelium through seven generations of secondary transplantation. Using the same approach, human primary or PSC-derived BCs transplanted into NOD scid gamma (NSG) recipient mice similarly display multilineage airway epithelial differentiation in vivo. Our results may provide a step toward potential future syngeneic cell-based therapy for patients with diseases resulting from airway epithelial cell damage or dysfunction.

Keywords: airway basal cells; airway epithelial stem cell transplantation; directed differentiation; pluripotent stem cells; regeneration.


Conflict of interest statement

Declaration of interests The authors have filed a patent application related to the engraftment approach presented in this manuscript.

Figures

Figure 1.
Figure 1.. Generation and expansion in culture of murine iBC and primary BC culture in defined serum-free medium
(A) Schematic of in vitro directed differentiation of murine pluripotent stem cells (PSCs) carrying an Nkx2-1mCherry reporter into airway basal epithelial-like cells (iBC), followed by their expansion as monolayered epithelial spheres in serially passaged 3D serum-free, feeder-free Matrigel cultures. RA, retinoic acid; RI, ROCK inhibitor Y27632; BCM, basal cell medium. Representative day 13 fluorescence-activated cell sorting (FACS) plot is shown. (B) Representative iBC culture (day 52) at passage 1 (P1) after sorting NGFR+/Nkx2-1mCherry+ cells. Scale bars, 200 μm. (C) Representative FACS plots at different stages of the iBC-directed differentiation protocol shown in (A). Day 57 (P1 iBC) samples were analyzed by RT-qPCR in (E), with red sorting gate representing NGFR+ samples and blue sorting gate representing NGFR− samples. (D) Quantification of percent of cells co-expressing Nkx2-1mCherry and NGFR+ cells out of all live cells analyzed by FACS at P0 and P1, respectively. Bars indicate mean ± SD. n = 7 biological replicates. (E) Reverse-transcription quantitative PCR (RT-qPCR) analysis of P1 iBC culture. Statistical analysis performed by paired, two-tailed Student’s t test. Bars indicate mean ± SD. n = 3 biological replicates. (F) Immunofluorescence confocal microscopy of paraffin-embedded tissue sections of representative iBC epithelial spheres stained for NKX2-1 and KRT5 proteins. Scale bars, 20 μm. Blue nuclei are counterstained with Hoechst33342. (G) Quantification of iBC cell yield and growth kinetics over nine passages. Mean ± SD are shown for three replicated differentiations separated at day 0. (H) Dimensionality reduction visualization by SPRING plots of iBC global transcriptomes profiled by scRNA-seq. Outgrowth of iBC cultures after six serial passages (P6; day 129) were analyzed by Louvain clustering (resolution = 0.5), and cell clusters were annotated based on canonical markers. iBasal, PSC-derived basal-like cell; iSecretory, PSC-derived secretory-like cell. (I) Selected canonical marker gene expression levels for each indicated marker shown overlaid on the SPRING plot from (H). (J) Heatmap of the top 20 differentially expressed genes (DEGs) ranked by log fold change (logFC) in each of the three cell clusters (C1–C3) annotated in (H): iBasal, iSecretory, and Proliferating cluster. (K) Schematic of generation and maintenance of primary BC cultures in basal cell medium (BCM). (L) Representative live whole-mount microscopy of P0 and P1 primary BC cultures. Scale bars, 200 μm. (M) Representative FACS plot of P1 primary BC culture. Samples were analyzed by RT-qPCR in (N), with red sorting gate representing NGFR+ samples and blue sorting gate representing NGFR− samples. (N) RT-qPCR analysis of P1 primary BC cultures, sorted based on the gates shown in (M). Statistical analysis performed by paired, two-tailed Student’s t test. Bars indicate mean ± SD. n = 3 biological replicates. (O) Immunofluorescence confocal microscopy of paraffin-embedded tissue sections of primary BC sphere cultures for KRT5, ACTUB, and SCGB1A1 proteins. Nuclei are counterstained with Hoechst33342. Scale bars, 20 μm. (P) Quantification of cell yield and growth kinetics of primary BC over six serial passages in BCM. Bars indicate mean ± SD. n = 3 biological replicates.
Figure 2.
Figure 2.. Transplantation of mouse primary BCs into syngeneic immunocompetent recipient mice
(A) Schematic summary of experimental approach for transplantation of cultured primary BC from UBC-GFP mice into polidocanol-injured syngeneic immunocompetent mice. (B) Tracheal whole-mount fluorescence microscopy and corresponding FACS of GFP (gated from all live cells harvested from the digest) to quantify donor-derived (GFP+) cells present in a representative recipient of primary BCs 69 days post-transplantation. Negative control tracheal whole-mount fluorescence microscopy of a primary recipient exposed to sham (PBS) injury and cell delivery 2 weeks post-transplantation is shown. (C) Immunofluorescence confocal microscopy for GFP, ACTUB, SCGB1A1, KRT5, and NKX2-1 proteins in a representative primary BC recipient trachea 6 months post-transplantation. White arrows indicate GFP+ (donor-derived) cells co-expressing the indicated canonical airway epithelial markers. Upper panels show all indicated fluorescence channels, and lower panels (“w/o GFP”) have the GFP channel removed. Nuclei are counterstained with Hoechst33342. Scale bars, 10 μm. (D) Schematic for cell capture and scRNA-seq analysis of endogenous (GFP−) and donor-derived (GFP+) tracheal epithelial cells from recipients of primary BCs. (E) SPRING visualization of single-cell transcriptomic profiles from primary BC recipient trachea; 69 days post-transplantation. Cells are colored by sample origin. Separated view of donor-derived and endogenous cell clusters are shown (also in Figure S2D). (F) Louvain clustering and annotation of cells from the SPRING shown in (G) (resolution = 0.2). (G) Lineage frequency of donor-derived vs. endogenous tracheal epithelial cells. (H) Dot plot comparing canonical gene expression levels and frequencies between donor-derived cell lineages and their endogenous counterparts. (I) Violin plot comparing selected canonical gene expression between donor-derived lineages and their endogenous counterparts. Statistical analysis is done with Wilcoxon signed-rank test with adjusted p values shown only for significantly different expression levels.
Figure 3.
Figure 3.. Transplantation of mouse iBCs into syngeneic immunocompetent recipient mice
(A) Schematic summary of experimental approach for transplantation of cultured iBC, tagged with lentiviral GFP, into polidocanol-injured syngeneic immunocompetent mice. (B) Representative whole-mount live fluorescence microscopy and FACS of donor cell population, quantifying NGFR, GFP, Nkx2-1mCherry expression, and forward scatter (FSC). Scale bars, 200 μm. (C) Whole-mount fluorescence and corresponding FACS quantification (gated from all live cells harvested from the digest) of iBC recipient 56 and 192 days post-transplantation. (D) Tracheal whole-mount fluorescence microscopy of GFP+ iBCs, shown at various time points (3 weeks to 2 year) post-transplantation. (E) Quantification of primary BC (n = 10) and iBC (n = 19) transplantation efficiency, calculated by GFP+% area over total recipient trachea area in epifluorescence image. Bars indicate mean ± SD. Comparison between epifluorescence imaging quantification and corresponding FACS transplantation efficiency quantification is shown in Figure S4C. (F) Immunofluorescence confocal microscopy for GFP, ACTUB, SCGB1A1, KRT5, and NKX2-1 in iBC recipient trachea 1 year post-transplantation. Nuclei are counterstained with Hoechst33342. White arrows indicate GFP+ donor-derived cells co-expressing indicated canonical airway epithelial markers. Lower panels have GFP channel removed. Scale bars, 10 μm. (G) Tracheal GFP fluorescence in an unfixed, unstained frozen tissue section and H&E staining of the immediately adjacent tissue section of a recipient of GFP+ iBCs, 7 weeks post-transplantation. (H) In vivo bioluminescence imaging of four recipients and an untransplanted control followed for 6 months after receiving transplanted iBCs tagged with GFP− luciferase-expressing lentivirus. Transplantation efficiency of each recipient (quantified by FACS in Figure S4C) is shown.
Figure 4.
Figure 4.. Characterization of iBC donor-derived vs. endogenous epithelial cells in recipient tracheas by single-cell transcriptomic profiling
(A) Schematic of experimental approach for cell capture and scRNA-seq profiling of epithelial cells from tracheas of three recipients of GFP+ iBCs at 40, 56, and 192 days post-transplantation. One “no transplant” control animal (no transplant, no injury) was included in the experiment as shown in (B). (B) SPRING visualization of single-cell transcriptomic profiles of tracheal cells from recipients of iBC transplants as shown in (A). Cells are colored either by sample origin. (C) SPRING visualization of single-cell transcriptomic profiles of tracheal cells from recipients of iBC transplants as shown in (A). Cells are colored by annotated Louvain clustering (resolution = 0.2). (D) Lineage frequency of donor-derived vs. endogenous tracheal cells for each recipient. (E) Selected canonical gene expression shown as green overlays on SPRING plot. (F) Violin plots comparing expression levels of selected canonical marker genes between donor-derived lineages and their endogenous counterparts. Statistical analysis is done with Wilcoxon signed-rank test with adjusted p values shown only for significantly different expression levels. (G) Dot plot comparing canonical gene expression between donor-derived lineages and their endogenous counterparts.
Figure 5.
Figure 5.. In vivo stem cell self-renewal and differentiated cell function of engrafted murine iBC-derived cells
(A) Representative screen capture of live GFP fluorescence by high content video confocal microscopy imaging, indicating GFP+ (donor-derived) and GFP− (endogenous) multiciliated cells (cilia labeled with wheat germ agglutinin in white); graph shows quantification of cilia beating frequency (events per unit time) of donor-derived and endogenous cells. Bars indicate mean ± SD. Scale bars, 5 μm. (B) Whole-mount immunofluorescence microscopy of GFP and acetylated tubulin (ACTUB) proteins in recipient trachea 310 days after transplantation of GFP+ iBCs, indicating donor-derived (GFP+) multiciliated cells; graph shows quantification of cilia length in donor-derived and endogenous multiciliated cells. n = 44 cells per condition. Scale bars, 20 μm. (C) Schematic summary of experimental approach for assessing response of donor iBC-derived engrafted cells to in vivo re-injury from repeated polidocanol exposure. (D) Immunofluorescence confocal microscopy of representative tracheal tissue section for GFP, KRT5, EdU, and Ki67 in iBC recipient trachea 1 week post-second polidocanol injury and corresponding quantification. Nuclei are counterstained with Hoechst33342. White arrows indicate donor-derived (GFP+) cells that co-label with EdU. Lower panels have GFP channel removed. Scale bars, 10 μm. n = 2 animals (411 donor-derived KRT5+ cells and 262 endogenous KRT5+ cells). Statistical analysis performed by unpaired, two-tailed Student’s t test. (E) Schematic summary of experimental approach for serial transplantations of GFP+-tagged iBCs into secondary recipients to measure self-renewal capacity. (F) Tracheal whole-mount fluorescence microscopy and corresponding FACS analysis (gated from all live cells harvested from the digest) of secondary recipients of GFP+ iBCs, characterizing seven generations of serial iBC transplants. 7th generation (7°) recipient trachea was also shown in analysis in Figure S6A. (G) Immunofluorescence confocal microscopy for GFP, ACTUB, SCGB1A1, KRT5, and NKX2-1 in a 5th generation (5°) iBC recipient trachea. Nuclei are counterstained with Hoechst33342. White arrows indicate GFP+ donor-derived cells co-expressing indicated canonical airway epithelial markers. Lower panel have GFP channel removed. Scale bars, 10 μm.
Figure 6.
Figure 6.. Characterization of iBC donor-derived vs. endogenous epithelial cells in 5th generation recipient tracheas by single-cell transcriptomic profiling
(A) Whole-mount epifluorescence imaging and corresponding FACS analysis of 5° generation recipient animals profiled by scRNA-seq. (B) SPRING visualization of scRNA-seq of 5th generation recipients, colored by sample or by Louvain clustering (resolution = 0.2). (C) Selected canonical gene expression shown as green overlays on SPRING plot. (D) SPRING visualization of merged scRNA-seq dataset of 1° recipients (Figure 4) and 5° recipients without harmonization. Selected samples are highlighted in the lower small panels. (E) SPRING visualization of merged scRNA-seq dataset of 1° recipients (Figure 4) and 5° recipients without harmonization, colored by Louvain clustering (resolution = 0.2).
Figure 7.
Figure 7.. Characterization of putative engrafted human primary BCs or iBCs in injured NSG mouse recipient tracheas
(A) Schematic of transplantation of human primary BCs (human bronchial epithelial cells, HBECs) or iBCs into polidocanol-injured NSG mouse trachea. Note lentiviral GFP or tdTomato tagging of cultured cells prior to transplantation. (B) Whole-mount fluorescence and corresponding FACS quantification (gated from all live cells harvested from the digest) of derivatives of either GFP+ human primary BCs or tdTomato+ human iBCs in mouse recipient tracheas 6 weeks post-transplantation. (C) Immunofluorescence confocal microscopy for GFP, tdTomato (RFP), ACTUB, SCGB1A1, KRT5, and NKX2-1 in mouse recipient tracheas 6 weeks post-transplantation of human cells. Nuclei are counterstained with Hoechst33342. White arrows indicate GFP+ or RFP+ human donor-derived cells co-expressing canonical airway epithelial markers. Yellow arrows indicate human donor-derived cells with goblet cell morphology. Lower panels have GFP or RFP channel removed, as indicated. Scale bars, 10 μm. (D) Single-cell transcriptomic profiling of human donor-derived cells in recipient mouse tracheas; SPRING visualization representing scRNA-seq of human cells in mouse recipient tracheas profiled 6 weeks post-transplantation. Cells are colored by sample origin. (E) Louvain clustering and annotations of human cells in each recipient from (D) (resolution = 0.1). (F) Selected canonical marker gene expression (green) overlayed on SPRING plots. (G) Violin plots comparing selected canonical gene expression levels between putatively engrafted human primary BC-derived lineages vs. human iBC-derived lineages. (H) Heatmap of the top 532 most variable genes (filtered by logFC > 0.5 and FDR-adjusted p < 0.05; across Louvain clusters from (E). Stressed population (C5) is excluded from this heatmap analysis.

Comment in

Similar articles

Cited by

References

    1. Michalopoulos GK, and DeFrances MC (1997). Liver regeneration. Science 276, 60–66. 10.1126/science.276.5309.60. - DOI - PubMed
    1. Barkauskas CE, Cronce MJ, Rackley CR, Bowie EJ, Keene DR, Stripp BR, Randell SH, Noble PW, and Hogan BLM (2013). Type 2 alveolar cells are stem cells in adult lung. J. Clin. Invest 123, 3025–3036. 10.1172/JCI68782. - DOI - PMC - PubMed
    1. Barker N, Es J.H. van, Kuipers J, Kujala P, Born M. van den, Cozijnsen M, Haegebarth A, Korving J, Begthel H, Peters PJ, et al. (2007). Identification of stem cells in small intestine and colon by marker gene Lgr5. Nature 449, 1003–1007. 10.1038/nature06196. - DOI - PubMed
    1. Dor Y, Brown J, Martinez OI, and Melton DA (2004). Adult pancreatic β-cells are formed by self-duplication rather than stem-cell differentiation. Nature 429, 41–46. 10.1038/nature02520. - DOI - PubMed
    1. Blanpain C, Lowry WE, Geoghegan A, Polak L, and Fuchs E (2004). Self-renewal, multipotency, and the existence of two cell populations within an epithelial stem cell niche. Cell 118, 635–648. 10.1016/j.cell.2004.08.012. - DOI - PubMed

Publication types