. 2023 Sep 1;15(9):evad157.
doi: 10.1093/gbe/evad157.

The Genomic Basis of Adaptation to High Elevations in Africanized Honey Bees

Affiliations

The Genomic Basis of Adaptation to High Elevations in Africanized Honey Bees

Turid Everitt et al. Genome Biol Evol. .

Abstract

A range of different genetic architectures underpin local adaptation in nature. Honey bees (Apis mellifera) in the Eastern African Mountains harbor high frequencies of two chromosomal inversions that likely govern adaptation to this high-elevation habitat. In the Americas, honey bees are hybrids of European and African ancestries and adaptation to latitudinal variation in climate correlates with the proportion of these ancestries across the genome. It is unknown which, if either, of these forms of genetic variation governs adaptation in honey bees living at high elevations in the Americas. Here, we performed whole-genome sequencing of 29 honey bees from both high- and low-elevation populations in Colombia. Analysis of genetic ancestry indicated that both populations were predominantly of African ancestry, but the East African inversions were not detected. However, individuals in the higher elevation population had significantly higher proportions of European ancestry, likely reflecting local adaptation. Several genomic regions exhibited particularly high differentiation between highland and lowland bees, containing candidate loci for local adaptation. Genes that were highly differentiated between highland and lowland populations were enriched for functions related to reproduction and sperm competition. Furthermore, variation in levels of European ancestry across the genome was correlated between populations of honey bees in the highland population and populations at higher latitudes in South America. The results are consistent with the hypothesis that adaptation to both latitude and elevation in these hybrid honey bees are mediated by variation in ancestry at many loci across the genome.

Keywords: admixture; honey bee; introgression; local adaptation; natural selection.


Figures

Fig. 1.
Fig. 1.
Sampling locations for Africanized honey bee colonies. 1 = location for highland bees (Pamplona, 2,400 m asl); 2 = location for lowland bees (Carmen de Tonchalá, 317 m asl).
Fig. 2.
Fig. 2.
A) PCA-plot and B) neighbor-joining tree based on 372,205 SNPs. The samples are colored by ancestry type: A = Kenyan bees from the A group; C = East European bees from the C group; M = Iberian bees from the M group; X_HL = Colombian highland bees (mixed ancestry); X_LL = Colombian lowland bees (mixed ancestry). C) Genome-wide ancestries per individual for different numbers of ancestral populations (K). The major mode from eight different runs of ADMIXTURE, identified with pong (Behr et al. 2016) is shown for each value of K. For K = 2 and K = 3, the results from all runs support the same mode but for higher values of K, multiple modes appear in the results. D) CV errors for eight different runs of ADMIXTURE and different values of K. Diamonds show the mean CV-error for each K-value.
Fig. 3.
Fig. 3.
A) FST of Colombian highland population versus Colombian lowland population estimated in 10 kbp windows. Shaded grey areas mark the putative pericentromeric regions. The shaded pink region on chromosome 11 denotes a region previously identified by Nelson et al. (2017). The quantile corresponding to 99.8% of the FST -values is shown as a dashed yellow line. FST peaks colored in maroon fulfill the criteria described in Materials and Methods and are described in more detail in supplementary tables S2 and S3, Supplementary Material online. B) Mean probability of A ancestry per SNP in lowland population minus the mean probability of A ancestry per SNP in highland population. The FST-peak regions are also marked in the ancestry plots for comparison.
Fig. 4.
Fig. 4.
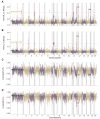
A) FST of Colombian highland population versus Kenyan samples. B) FST of Colombian lowland population versus Kenyan samples. C) Mean probability of ancestry from the A group per SNP in Colombian highland population. D) Mean probability of ancestry from the A group per SNP in Colombian lowland population. FST is estimated in 10 kbp windows. Shaded gray areas mark the putative pericentromeric regions. The shaded pink region on chromosome 11 denotes a region previously identified by Nelson et al. (2017). The quantile corresponding to 99.8% of the FST -values is shown as a dashed yellow line. FST -peaks colored in maroon fulfill the criteria described in Materials and Methods and are described in more detail in supplementary tables S2 and S3, Supplementary Material online. FST -peaks are also marked in the ancestry plots for comparison.
Fig. 5.
Fig. 5.
Pearson correlations of ancestry probabilities from the A group per site across the genome, between each of the Argentinian populations and the Colombian highland population (HL), and the Colombian lowland population (LL). The correlation coefficients (y-axis) are plotted against the genome-wide A ancestry of the Argentinian populations on the x-axis, as estimated with the ADMIXTURE software. The dashed vertical lines show the genome-wide A ancestry of the Colombian highland population (HL) and Colombian lowland population (LL). For Argentinian populations where the correlation to the Colombian highland population is highly significantly different (P < 0.0001) from the correlation to the Colombian lowland population, the data points are marked with a black border around the diamond. Vertical lines connect comparisons of the highland (HL) and lowland (LL) Colombian samples with the same Argentinian sample.

References

    1. Adrion JR, Hahn MW, Cooper BS. 2015. Revisiting classic clines in Drosophila melanogaster in the age of genomics. Trends Genet. 31:434–444. - PMC - PubMed
    1. Alexander DH, Novembre J, Lange K. 2009. Fast model-based estimation of ancestry in unrelated individuals. Genome Res. 19:1655–1664. - PMC - PubMed
    1. Barghi N, Hermisson J, Schlötterer C. 2020. Polygenic adaptation: a unifying framework to understand positive selection. Nat Rev Genet. 21:769–781. - PubMed
    1. Barrier M, Baldwin BG, Robichaux RH, Purugganan MD. 1999. Interspecific hybrid ancestry of a plant adaptive radiation: allopolyploidy of the Hawaiian silversword alliance (Asteraceae) inferred from floral homeotic gene duplications. Mol Biol Evol. 16:1105–1113. - PubMed
    1. Behr AA, Liu KZ, Liu-Fang G, Nakka P, Ramachandran S. 2016. pong: fast analysis and visualization of latent clusters in population genetic data. Bioinformatics 32:2817–2823. - PMC - PubMed

Publication types