

Worth the Work? Monkeys Discount Rewards by a Subjective Adapting Effort Cost
- PMID: 37625854
- PMCID: PMC10552939
- DOI: 10.1523/JNEUROSCI.0115-23.2023
Worth the Work? Monkeys Discount Rewards by a Subjective Adapting Effort Cost
Abstract
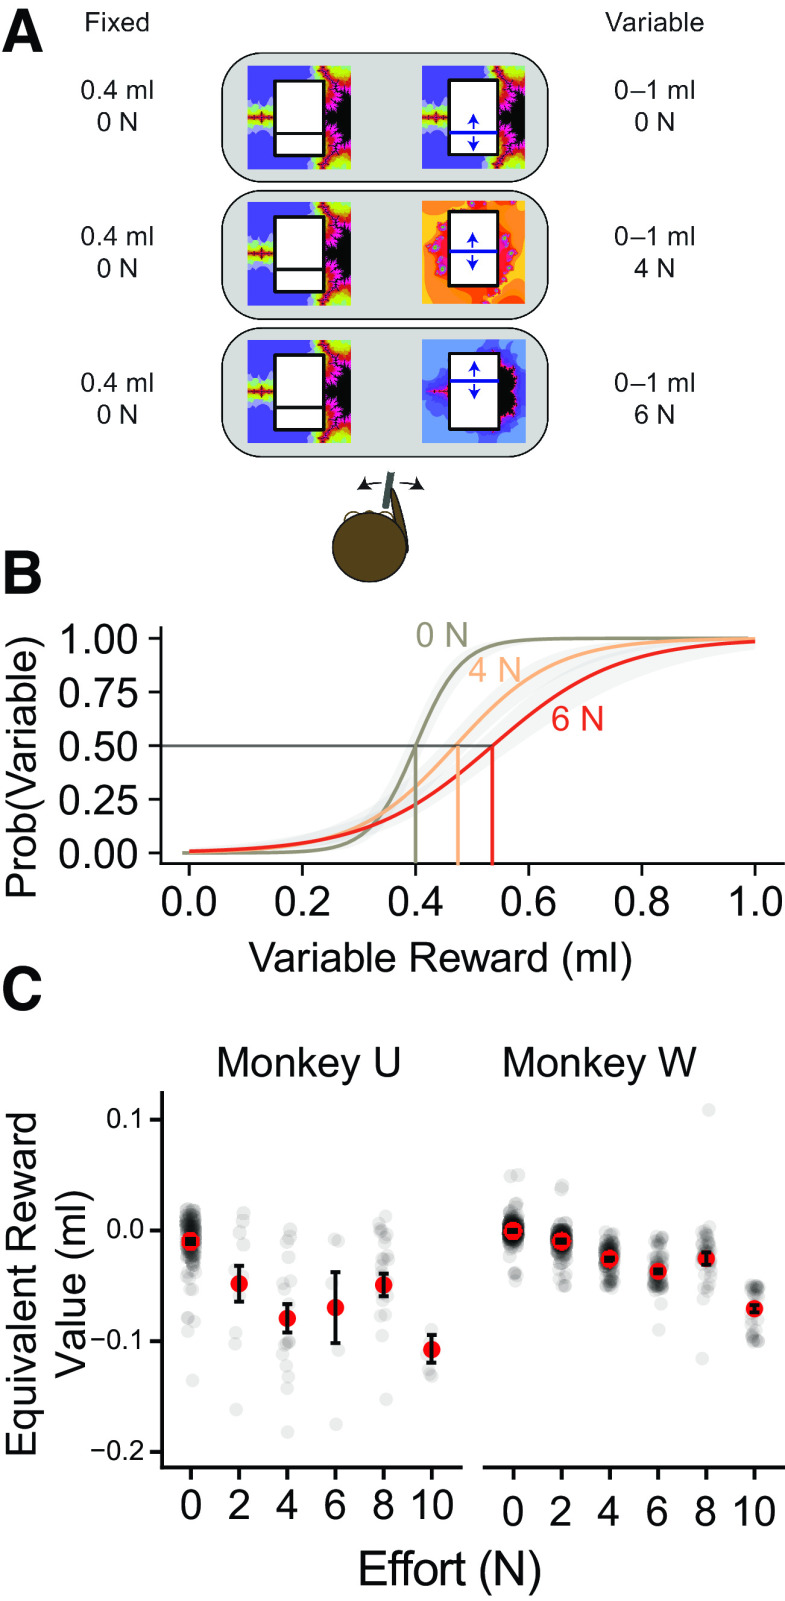
All life must solve how to allocate limited energy resources to maximize benefits from scarce opportunities. Economic theory posits decision makers optimize choice by maximizing the subjective benefit (utility) of reward minus the subjective cost (disutility) of the required effort. While successful in many settings, this model does not fully account for how experience can alter reward-effort trade-offs. Here, we test how well the subtractive model of effort disutility explains the behavior of two male nonhuman primates (Macaca mulatta) in a binary choice task in which reward quantity and physical effort to obtain were varied. Applying random utility modeling to independently estimate reward utility and effort disutility, we show the subtractive effort model better explains out-of-sample choice behavior when compared with parabolic and exponential effort discounting. Furthermore, we demonstrate that effort disutility depends on previous experience of effort: in analogy to work from behavioral labor economics, we develop a model of reference-dependent effort disutility to explain the increased willingness to expend effort following previous experience of effortful options in a session. The result of this analysis suggests that monkeys discount reward by an effort cost that is measured relative to an expected effort learned from previous trials. When this subjective cost of effort, a function of context and experience, is accounted for, trial-by-trial choices can be explained by the subtractive cost model of effort. Therefore, in searching for net utility signals that may underpin effort-based decision-making in the brain, careful measurement of subjective effort costs is an essential first step.SIGNIFICANCE STATEMENT All decision-makers need to consider how much effort they need to expend when evaluating potential options. Economic theories suggest that the optimal way to choose is by cost-benefit analysis of reward against effort. To be able to do this efficiently over many decision contexts, this needs to be done flexibly, with appropriate adaptation to context and experience. Therefore, in aiming to understand how this might be achieved in the brain, it is important to first carefully measure the subjective cost of effort. Here, we show monkeys make reward-effort cost-benefit decisions, subtracting the subjective cost of effort from the subjective value of rewards. Moreover, the subjective cost of effort is dependent on the monkeys' experience of effort in previous trials.
Keywords: adaptation; choice; preference; utility; value.
Copyright © 2023 the authors.
Figures


Update of
-
Worth the work? Monkeys discount rewards by a subjective adapting effort cost.bioRxiv [Preprint]. 2023 Jan 10:2023.01.10.523384. doi: 10.1101/2023.01.10.523384. bioRxiv. 2023. Update in: J Neurosci. 2023 Oct 4;43(40):6796-6806. doi: 10.1523/JNEUROSCI.0115-23.2023. PMID: 36712043 Free PMC article. Updated. Preprint.
Similar articles
-
Worth the work? Monkeys discount rewards by a subjective adapting effort cost.bioRxiv [Preprint]. 2023 Jan 10:2023.01.10.523384. doi: 10.1101/2023.01.10.523384. bioRxiv. 2023. Update in: J Neurosci. 2023 Oct 4;43(40):6796-6806. doi: 10.1523/JNEUROSCI.0115-23.2023. PMID: 36712043 Free PMC article. Updated. Preprint.
-
Neural Signatures of Value Comparison in Human Cingulate Cortex during Decisions Requiring an Effort-Reward Trade-off.J Neurosci. 2016 Sep 28;36(39):10002-15. doi: 10.1523/JNEUROSCI.0292-16.2016. Epub 2016 Sep 28. J Neurosci. 2016. PMID: 27683898 Free PMC article.
-
Nonhuman Primates Satisfy Utility Maximization in Compliance with the Continuity Axiom of Expected Utility Theory.J Neurosci. 2021 Mar 31;41(13):2964-2979. doi: 10.1523/JNEUROSCI.0955-20.2020. Epub 2021 Feb 4. J Neurosci. 2021. PMID: 33542082 Free PMC article.
-
Quantity versus quality: Convergent findings in effort-based choice tasks.Behav Processes. 2019 Jul;164:178-185. doi: 10.1016/j.beproc.2019.05.009. Epub 2019 May 11. Behav Processes. 2019. PMID: 31082477 Free PMC article. Review.
-
Neuronal Reward and Decision Signals: From Theories to Data.Physiol Rev. 2015 Jul;95(3):853-951. doi: 10.1152/physrev.00023.2014. Physiol Rev. 2015. PMID: 26109341 Free PMC article. Review.
Cited by
-
The amygdala and the pursuit of future rewards.Front Neurosci. 2025 Jan 22;18:1517231. doi: 10.3389/fnins.2024.1517231. eCollection 2024. Front Neurosci. 2025. PMID: 39911407 Free PMC article. Review.
References
-
- Abeler J, Falk A, Goette L, Huffman D (2011) Reference points and effort provision. Am Econ Rev 101:470–492. 10.1257/aer.101.2.470 - DOI
-
- Akerlof GA, Yellen JL (1990) The fair wage-effort hypothesis and unemployment. Q J Econ 105:255–283. 10.2307/2937787 - DOI
-
- Allen EJ, Dechow PM, Pope DG, Wu G (2017) Reference-dependent preferences: evidence from Marathon runners. Management Sci 63:1657–1672. 10.1287/mnsc.2015.2417 - DOI
-
- Arkes HR, Hirshleifer D, Jiang D, Lim S (2008) Reference point adaptation: tests in the domain of security trading. Organ Behav Hum Decis Process 105:67–81. 10.1016/j.obhdp.2007.04.005 - DOI
Publication types
MeSH terms
Grants and funding
LinkOut - more resources
Full Text Sources