. 2023 Aug 25;14(1):5214.
doi: 10.1038/s41467-023-40857-y.

Glycerol 3-phosphate phosphatase/PGPH-2 counters metabolic stress and promotes healthy aging via a glycogen sensing-AMPK-HLH-30-autophagy axis in C. elegans

Affiliations

Glycerol 3-phosphate phosphatase/PGPH-2 counters metabolic stress and promotes healthy aging via a glycogen sensing-AMPK-HLH-30-autophagy axis in C. elegans

Elite Possik et al. Nat Commun. .

Abstract

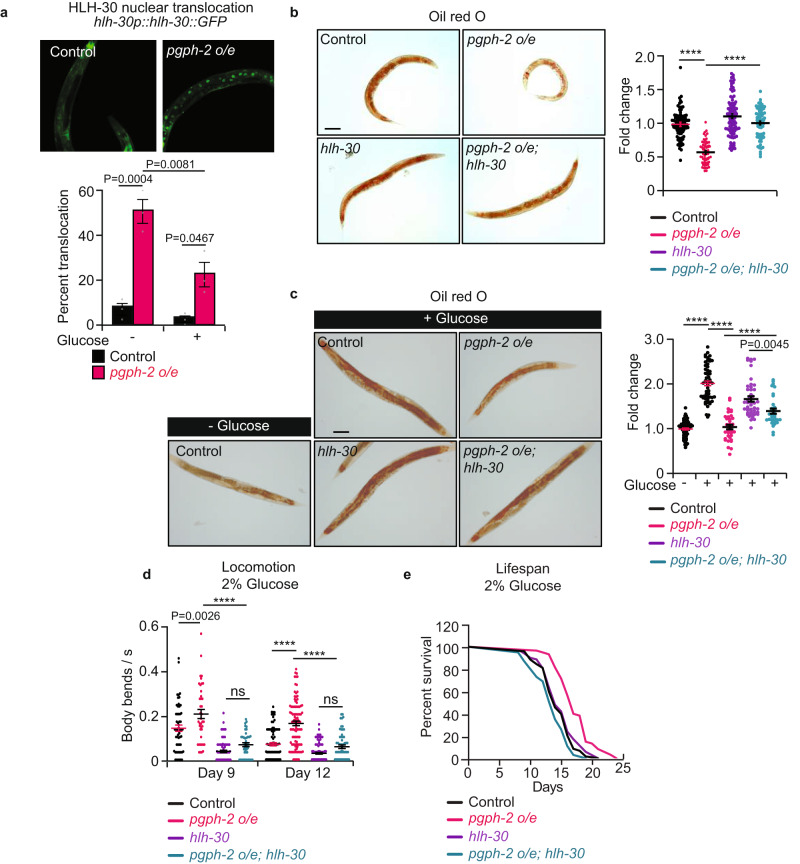
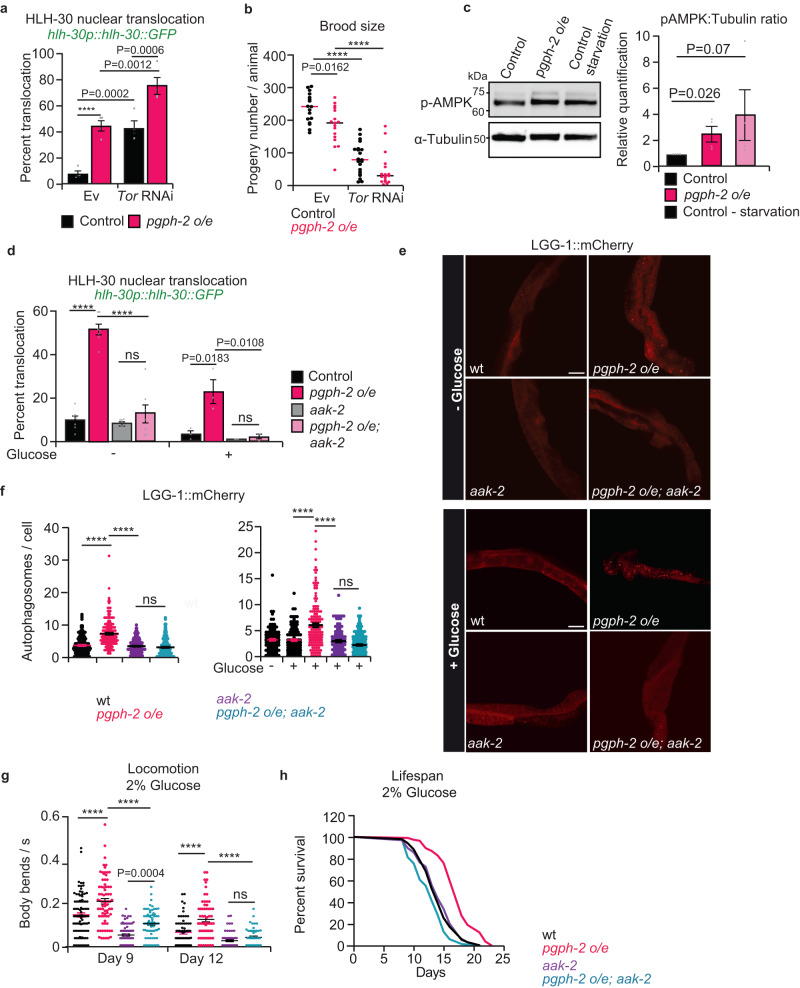
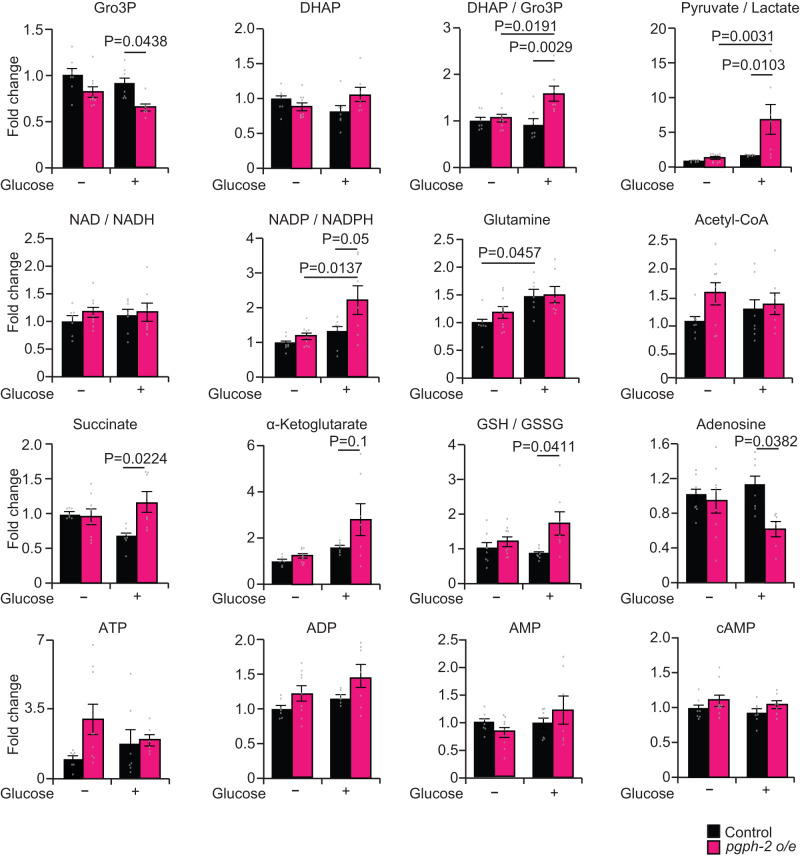
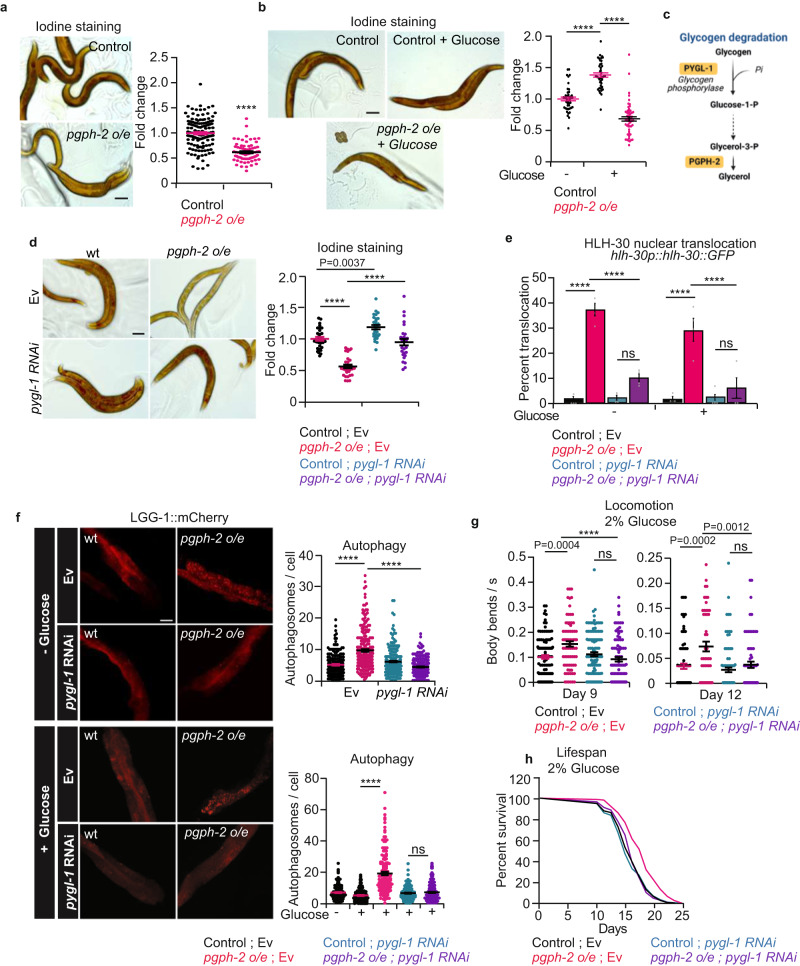
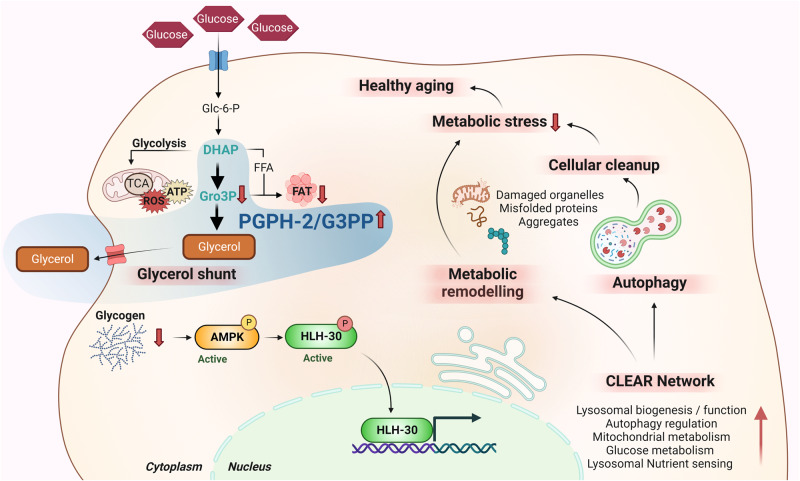
Metabolic stress caused by excess nutrients accelerates aging. We recently demonstrated that the newly discovered enzyme glycerol-3-phosphate phosphatase (G3PP; gene Pgp), which operates an evolutionarily conserved glycerol shunt that hydrolyzes glucose-derived glycerol-3-phosphate to glycerol, counters metabolic stress and promotes healthy aging in C. elegans. However, the mechanism whereby G3PP activation extends healthspan and lifespan, particularly under glucotoxicity, remained unknown. Here, we show that the overexpression of the C. elegans G3PP homolog, PGPH-2, decreases fat levels and mimics, in part, the beneficial effects of calorie restriction, particularly in glucotoxicity conditions, without reducing food intake. PGPH-2 overexpression depletes glycogen stores activating AMP-activate protein kinase, which leads to the HLH-30 nuclear translocation and activation of autophagy, promoting healthy aging. Transcriptomics reveal an HLH-30-dependent longevity and catabolic gene expression signature with PGPH-2 overexpression. Thus, G3PP overexpression activates three key longevity factors, AMPK, the TFEB homolog HLH-30, and autophagy, and may be an attractive target for age-related metabolic disorders linked to excess nutrients.


Conflict of interest statement

The authors declare no competing interests.

Figures

Fig. 1
Fig. 1. Stable overexpression of pgph-2 decreases fat accumulation, extends healthspan and protects from glucotoxicity.
For all figure panels, **** represents P < 0.0001. a Oil red O staining and quantification in Control and pgph-2 o/e 1-day adult animals treated with or without 2% glucose. Data represent mean ± SEM, n = 3 independent experiments. Scale bar = 50 µm. P-values are obtained using one-way ANOVA with the Bonferroni test. b, c Bar plots showing pharyngeal pumping rates of control and pgph-2 overexpressing nematodes at indicated days of age at normal growth conditions (b) and 2% glucose conditions (c). Data represent mean ± SEM, n = 3 independent experiments. P-values are obtained by two-way ANOVA with Bonferroni correction. d, e Body bends per second of pgph-2 o/e animals in comparison to controls in normal growth (d) and 2% glucose conditions (e). Data is shown using dot plots with denoted mean ± SEM, n = 3 independent experiments. The number of tracks is shown in datasource. P-values are obtained by two-tailed unpaired Student’s t-test. f, g Lifespan of pgph-2 overexpressing animals in comparison to control nematodes in normal growth conditions (f) and on plates supplemented with 2% glucose (g). The number of separate lifespan experiments, animals and detailed statistics are shown in Supplementary Data 1. P-value is obtained using the two-sided Mantel–Cox test. h Brood size as measured by the number of progeny per animal in eat-2 (ad465); control; eat-2 (ad465), and pgph-2 o/e; eat-2 (ad465) grown on normal growth medium or plates supplemented with 2% glucose. Data are shown as dot plots representing mean ± SEM from three independent experiments. P-values are obtained by one-way ANOVA with the Bonferroni test. i Locomotion analysis on days 9 and 12 of age, measured by body bends per second in indicated strains grown on plates supplemented with 2% glucose. Data represent mean ± SEM, n = 3 independent experiments. P-values are obtained by one-way ANOVA with the Bonferroni test. j Lifespan of control, pgph-2 o/e, pgph-2 o/e; daf-16 (mu86), and daf-16 (mu86) overexpressing animals on plates supplemented with 2% glucose. The number of experiments, animals and detailed statistics are shown in Supplementary Data 1. P-values are obtained using the two-sided Mantel–Cox test.
Fig. 2
Fig. 2. PGPH-2 o/e activates the nuclear translocation of HLH-30 and promotes healthy aging under glucotoxic conditions.
For all panels, **** represents P < 0.0001. a Percent nuclear translocation of HLH-30 in young adult animals scored using the HLH-30::GFP expressing strain crossed to control and pgph-2 o/e animals under normal growth conditions or 2% glucose. Data represent mean ± SEM from three independent experiments. P-values are obtained by one-way ANOVA with the Bonferroni correction. b, c Oil red O staining and quantification in control, pgph-2 o/e, pgph-2 o/e; hlh-30 (tm1978), and hlh-30 (tm1978) strains on normal growth conditions at day 1 (b) and 2% glucose conditions at day 3 (c). Data is shown using dot plots with denoted mean ± SEM from three independent experiments. P-values are obtained by one-way ANOVA with the Bonferroni correction. The scale bar = 50 µm. d Locomotion analysis on days 9 and 12 of age, measured by body bends per second control, pgph-2 o/e, pgph-2 o/e; hlh-30 (tm1978), and hlh-30 (tm1978) strains grown on plates supplemented with 2% glucose. Data represent mean ± SEM from three independent experiments. P-values are obtained by one-way ANOVA with the Bonferroni correction. The number of tracks is shown in datasource. e Lifespan of control, pgph-2 o/e, pgph-2 o/e; hlh-30 (tm1978), and hlh-30 (tm1978) overexpressing animals on plates supplemented with 2% glucose. The number of separate lifespan experiments, animals and detailed statistics are shown in Supplementary Data 1. P-value is obtained using the two-sided Mantel–Cox test.
Fig. 3
Fig. 3. RNA-seq analysis reveals catabolic and longevity signatures specific to pgph-2 o/e and largely dependent on HLH-30.
a Schematic representation of the RNA-seq experimental design. Briefly, synchronized WT, pgph-2 o/e, pgph-2 o/e; hlh-30 and hlh-30 animals and grown on normal growth medium or plates supplemented with 2% glucose are harvested. Total RNA is extracted using trizol and purified and subjected to seq analysis. Scheme created with Biorender.com. b Volcano plots showing differentially expressed genes in WT vs pgph-2 o/e animals on normal growth medium. Genes with a fold change >2 and a P-value smaller than 0.05 were considered significantly changed. Red, green, and blue indicate genes that are significantly upregulated, significantly downregulated, or not significantly changed, respectively. c Gene ontology (GO) annotations of genes significantly upregulated in pgph-2 o/e animals in comparison to WT and belonging to the molecular function (MF), biological processes (BP), and cellular component (CC) categories. d Venn diagram and gene ontology annotations of the common genes that are upregulated in pgph-2 o/e animals in comparison to WT and downregulated in pgph-2 o/e; hlh-30 in comparison to pgph-2 o/e. e Heat map representing the differential expression of selected genes based on functions related to longevity in WT, pgph-2 o/e, pgph-2 o/e; hlh-30 and hlh-30 animals. Carbohydrate binding, innate immune response, hydrolase activity, lipid metabolism, longevity and reproduction are upregulated in pgph-2 o/e animals in an HLH-30-dependent manner.
Fig. 4
Fig. 4. PGPH-2 o/e activates autophagy in an HLH-30-dependent manner.
For all figure panels, **** represents P < 0.0001. a Representative confocal images and quantification of LGG-1::mCherry puncta in the intestines of day 1 WT and pgph-2 o/e animals under normal growth conditions. The scale bar = 20 µm. Data is shown using dot plots with denoted mean ± SEM from three independent experiments. P-values are obtained by unpaired two-tailed Student’s t-test. Graphical representation created using Biorender.com. b Representative confocal images and quantification of LGG-1::mCherry puncta in the intestines of day 1 WT and pgph-2 o/e animals grown on plates supplemented with 2% glucose. Data is shown using dot plots with denoted mean ± SEM from three independent experiments. P-values are obtained by one-way ANOVA with the Bonferroni correction. The scale bar = 20 µm. c Representative confocal images and quantification of LGG-1::mCherry puncta in the intestines of day 1 WT, pgph-2 o/e, pgph-2 o/e; hlh-30 (tm1978), and hlh-30 (tm1978) animals grown on normal growth condition or plates supplemented with 2% glucose. The scale bar = 20 µm. Data is shown using dot plots with denoted mean ± SEM from three independent experiments. P-values are obtained by one-way ANOVA with the Bonferroni test. d Locomotion analysis on day 9 of age, measured by body bends per second control, pgph-2 o/e, pgph-2 o/e; atg-18 (gk378), and atg-18 (gk378) strains grown on plates supplemented with 2% glucose. Data is shown using dot plots with denoted mean ± SEM from three independent experiments. P-values are obtained by one-way ANOVA with the Bonferroni correction. Number of tracks is shown in datasource. e Lifespan of control, pgph-2 o/e, pgph-2 o/e; atg-18 (gk378), and atg-18 (gk378) overexpressing animals on plates supplemented with 2% glucose. The number of separate lifespan experiments, animals and detailed statistics are shown in Supplementary Data 1. P-value is obtained using the two-sided Mantel–Cox test.
Fig. 5
Fig. 5. PGPH-2 o/e activates the AMPK-HLH-30-autophagy signaling cascade to promote healthy aging under glucotoxicity.
For all figure panels, **** represents P < 0.0001. a Percent nuclear translocation of HLH-30 in young adult control animals and pgph-2 o/e animals on EV or TOR RNAi conditions. Data represent mean ± SEM from four independent experiments. P-values are obtained by one-way ANOVA with Bonferroni correction. b Brood size as measured by the number of progeny per animal in control and pgph-2 o/e animals grown on Ev plates or TOR RNAi plates. Data represent mean ± SEM from four independent experiments. P-values are obtained by one-way ANOVA with Bonferroni correction. c Western blot analysis and quantification by Image J of pAMPK and Tubulin in control, pgph-2 o/e, and starved control animals. Data represent mean ± SEM from four independent experiments. P-value is obtained by unpaired one-tailed Student’s t-test. d Percent nuclear translocation of HLH-30 in young adult control, pgph-2 o/e, pgph-2 o/e; aak-2 (ok524), and aak-2 (ok524) animals, grown on normal growth conditions or plates supplemented with 2% glucose. Data represent mean ± SEM from more than three independent experiments. P-values are obtained by one-way ANOVA with the Bonferroni correction. e, f Representative confocal images (e) and quantification of LGG-1::mCherry puncta (f) in the intestines of day 1 WT, pgph-2 o/e, pgph-2 o/e; aak-2 (ok524), and aak-2 (ok524) animals grown on normal and 2% glucose conditions. Data is shown using dot plots with denoted mean ± SEM from three independent experiments. P-values are obtained by one-way ANOVA with the Bonferroni correction. The scale bar = 20 µm. g Locomotion analysis on days 9 and 12 of age in control, pgph-2 o/e, pgph-2 o/e; aak-2 (ok524), and aak-2 (ok524) strains grown on plates supplemented with 2% glucose. Data is shown using dot plots with denoted mean ± SEM from three independent experiments. P-values are obtained by one-way ANOVA with the Bonferroni correction. h Lifespan of control, pgph-2 o/e, pgph-2 o/e; aak-2 (ok524), and aak-2 (ok524) overexpressing animals on plates supplemented with 2% glucose. The number of separate lifespan experiments, animals and detailed statistics are shown in Supplementary Data 1. P-values are obtained using the two-sided Mantel–Cox test.
Fig. 6
Fig. 6. Metabolomics analysis in pgph-2 o/e animals.
Relative metabolite levels and ratios of some metabolites in synchronized L4/young adult control and pgph-2 o/e animals grown on NGM plates or plates supplemented with 2% glucose. Data represent mean ± SEM from two independent experiments (control; n = 7, pgph-2 o/e; n = 9, control—2% Glucose; n = 7, pgph-2 o/e—2% Glucose; n = 7). P-values are obtained by one-way ANOVA with the Bonferroni correction.
Fig. 7
Fig. 7. PGPH-2 o/e reduces glycogen stores to activate an AMPK-dependent/HLH-30/autophagy cascade.
For all figure panels, **** represents P < 0.0001. a, b Representative iodine staining images and quantification in control and pgph-2 o/e animals in normal growth conditions (a) and plates supplemented with 2% glucose (b). The scale bar = 50 µm. Data represent mean ± SEM from three independent repeats. P-values are obtained using two-sided unpaired Student’s t-test (a) and one-way ANOVA with Bonferroni correction (b). The scale bar = 50 µm. c Glycogen degradation pathway. d Representative iodine staining images and quantification in WT and pgph-2 o/e exposed to Ev and pygl-1 RNAi. Data represent mean ± SEM from three independent repeats. P-values are obtained using one-way ANOVA with Bonferroni correction. e HLH-30 nuclear translocation in WT and pgph-2 o/e animals expressing the HLH-30::GFP transgene exposed to Ev and pygl-1 RNAi for two generations and grown on normal conditions or excess glucose conditions. Data represent mean ± SEM from three independent experiments. P-values are obtained using one-way ANOVA with Bonferroni correction. f Representative confocal images and quantification of LGG-1::mCherry puncta in the intestines of day 1 WT and pgph-2 o/e exposed to Ev and pygl-1 RNAi for two generations and grown on normal or excess glucose conditions. Data represent mean ± SEM from three independent experiments. P-values are obtained using one-way ANOVA with Bonferroni correction. The scale bar = 20 μm. g Locomotion analysis on days 9 and 12 of age, measured by body bends per second in control and pgph- 2 o/e exposed to Ev and pygl-1 RNAi bacteria and grown on plates supplemented with 2% glucose. Data is shown using dot plots with denoted mean ± SEM from three independent experiments. P-values are obtained using one-way ANOVA with the Bonferroni correction and exact number of tracks is indicated in datasource. h Lifespan of control and pgph-2 o/e exposed to Ev and pygl-1 RNAi bacteria and grown on plates supplemented with 2% glucose. P-value is obtained using the two-sided Mantel–Cox test.
Fig. 8
Fig. 8. Graphical representation of the study findings.
In this work, we unveil the mechanism whereby G3PP activation mimics in part the beneficial effects of calorie restriction, without the caveats of calorie intake restriction and significant reduced fertility, to promote healthy aging and lifespan extension, particularly in glucose-excess conditions. Specifically, we demonstrate that the overexpression of the major worm G3PP homolog, PGPH-2, activates the AMPK-TFEB/HLH-30-autophagy axis, three key longevity factors and attractive therapeutic venues to treat metabolic diseases that appear with age. In addition, we show that the initial step that triggers the activation of this signaling cascade is the chronic depletion of glycogen stores mediated by pgph-2 o/e. Figure created using Biorender.com.

References

    1. Prentki M, Peyot ML, Masiello P, Madiraju SRM. Nutrient-induced metabolic stress, adaptation, detoxification, and toxicity in the pancreatic beta-cell. Diabetes. 2020;69:279–290. - PubMed
    1. Lee SJ, Murphy CT, Kenyon C. Glucose shortens the life span of C. elegans by downregulating DAF-16/FOXO activity and aquaporin gene expression. Cell Metab. 2009;10:379–391. - PMC - PubMed
    1. van Dam E, et al. Sugar-induced obesity and insulin resistance are uncoupled from shortened survival in Drosophila. Cell Metab. 2020;31:710–725.e717. - PMC - PubMed
    1. Mlekusch W, Lamprecht M, Ottl K, Tillian M, Reibnegger G. A glucose-rich diet shortens longevity of mice. Mech. Ageing Dev. 1996;92:43–51. - PubMed
    1. Prentki M, Madiraju SR. Glycerolipid metabolism and signaling in health and disease. Endocr. Rev. 2008;29:647–676. - PubMed

Publication types