. 2023 Aug 25;14(1):5197.
doi: 10.1038/s41467-023-40927-1.

Microglial REV-ERBα regulates inflammation and lipid droplet formation to drive tauopathy in male mice

Affiliations

Microglial REV-ERBα regulates inflammation and lipid droplet formation to drive tauopathy in male mice

Jiyeon Lee et al. Nat Commun. .

Erratum in

Abstract

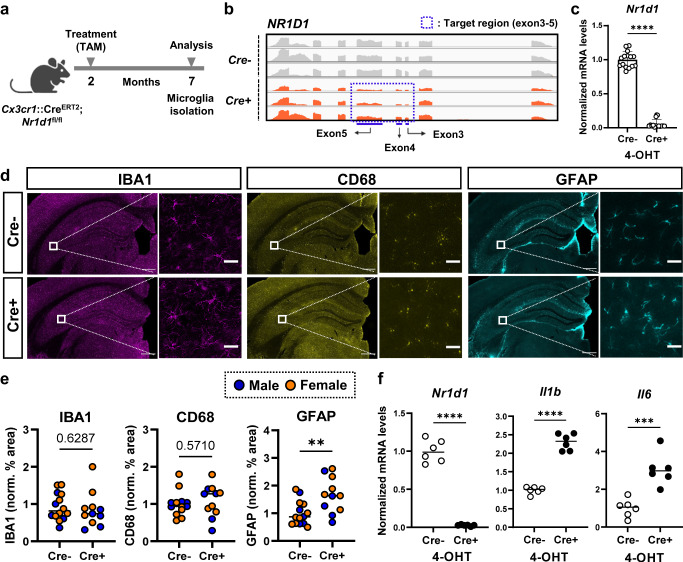
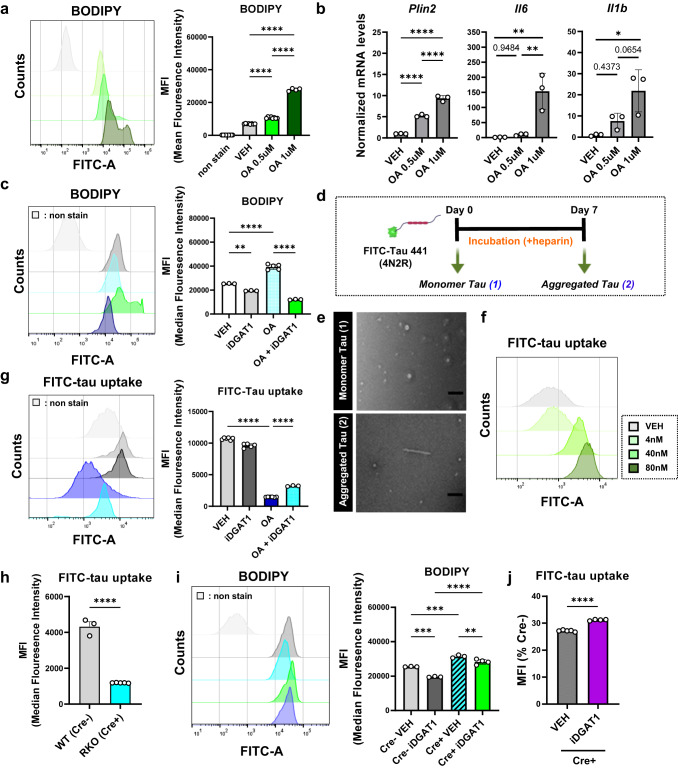
Alzheimer's disease, the most common age-related neurodegenerative disease, is characterized by tau aggregation and associated with disrupted circadian rhythms and dampened clock gene expression. REV-ERBα is a core circadian clock protein which also serves as a nuclear receptor and transcriptional repressor involved in lipid metabolism and macrophage function. Global REV-ERBα deletion has been shown to promote microglial activation and mitigate amyloid plaque formation. However, the cell-autonomous effects of microglial REV-ERBα in healthy brain and in tauopathy are unexplored. Here, we show that microglial REV-ERBα deletion enhances inflammatory signaling, disrupts lipid metabolism, and causes lipid droplet (LD) accumulation specifically in male microglia. These events impair microglial tau phagocytosis, which can be partially rescued by blockage of LD formation. In vivo, microglial REV-ERBα deletion exacerbates tau aggregation and neuroinflammation in two mouse tauopathy models, specifically in male mice. These data demonstrate the importance of microglial lipid droplets in tau accumulation and reveal REV-ERBα as a therapeutically accessible, sex-dependent regulator of microglial inflammatory signaling, lipid metabolism, and tauopathy.


Conflict of interest statement

The authors declare no competing interests.

Figures

Fig. 1
Fig. 1. Microglial REV-ERBα KO causes neuroinflammation in vivo and in vitro.
a Schematic showing experiments with microglia-specific REV-ERBα KO mice (Cx3cr1::CreERT2;Nr1d1fl/fl mice). Created with Biorender.com. b Integrative genomics viewer (IGV) snapshot of RNA-seq reads at the floxed REV-ERBα locus (Exon 3, 4, and 5) of isolated microglia from tamoxifen-injected Cx3cr1::CreERT2;Nr1d1fl/fl mice and Cre− littermate controls. c Rev-erbα (Nr1d1) KO efficiency in isolated microglia from Cx3cr1::CreERT2; Nr1d1fl/fl pups after 4-OHT treatment (1.5 μM) (n = 15 wells examined from 3 cultures derived from independent pups). d, e Astrocyte (cyan: GFAP) and microglial (purple: IBA1, yellow: CD68) activation in Cre− controls and Cre+ Cx3cr1::CreERT2; Nr1d1fl/fl mouse hippocampus (n = 5–9 mice per group). Scale bar, 500 µm (whole hippocampus); Scale bar, 50 µm (Zoom image). f mRNA expression of pro-inflammatory cytokines such as Il1b, and Il6 in control (Cre−; Nr1d1fl/fl) and REV-ERBα KO (Cx3cr1::CreERT2;Nr1d1fl/fl) microglia from P1-3 pups treated with 4-OH-TAM (n = 6 independent cell cultures). **p < 0.01, ***p < 0.005, ****p < 0.001, by two-tailed t test. P values > 0.05 are listed. Error bars represent SEM.
Fig. 2
Fig. 2. Microglial REV-ERBα KO accelerates pTau accumulation and neuroinflammation in PS19 male mice only.
a Schematic for generating P301S tau-expressing microglial REV-ERBα KO mice (PS19+/−;Cx3cr1::CreERT2+;Nr1d1fl/fl). Created with Biorender.com. b Hippocampal and cortical pTau staining with AT8 in control P301S (PS19; Cre−) and microglial REV-ERBα KO P301S (PS19; Cre+) male and female mice, quantified in c (n = 4–8 mice per group). Hatched box highlights CA1 and cortical region where differences in AT8 were most apparent. d Expression of transcripts for pro-inflammatory cytokines (Il1b, Tnfα), complement component C1q, and microglia markers (Aif1, Cd68) in the hippocampus of PS19; Cre− and PS19; Cre+ male (n = 4–8 mice per group) and e female mice (n = 4–7 mice). f, Immunostaining for astrocytes (GFAP; green) and microglia (IBA1; red, CD68; cyan) in male and female mice, with quantified percentage area normalized to Cre− group (n = 4–8 mice per group). Scale bar, 500 µm. *p < 0.05 and ***p < 0.005, ****p < 0.001 by two-tailed t test. P values > 0.05 are listed. Error bars represent SEM.
Fig. 3
Fig. 3. Microglial REV-ERBα KO exacerbates tauopathy in males only in an AAV-tau P301L model.
a Schematic depicting post-natal P0 intracerebroventricular (i.c.v.) injection of AAV-tau P301L into Cx3cr1::CreERT2+;Nr1d1fl/fl mice and Cre− controls. Created with Biorender.com. b Images and quantification of AT8 immunoreactivity in hippocampus of male (n = 5–11 mice per group) and c female Cre− control and Cre+ microglial REV-ERBα KO mice 6 months after AAV-tau P301L injection (n = 6 mice per group). AT8 intensity normalized to total tau staining (HT7 antibody) for each mouse, then the percentage area of AT8 staining was normalized to the Cre− group. Hatched box highlights CA1 region where differences in AT8 were most apparent. d MC1 immunoreactivity in hippocampus of control (Cre−) and microglial REV-ERBα KO (Cre+) AAV-tau P301L expressing male (n = 5–11 mice per group) and e female mice (n = 6 mice per group). Percent area was normalized to Cre− group. f Immunostaining of astrocytes (GFAP; green) and microglia (IBA1; red) in hippocampus of Cre− or Cre+ male (n = 5–11 mice per group) and g female AAV-P301L injecting mice (n = 6 mice per group). Scale bar, 500 µm. *p < 0.05 by two-tailed t test. P values > 0.05 are listed. Error bars represent SEM.
Fig. 4
Fig. 4. REV-ERBα KO alters lipid metabolism and the expression of lipid-droplet in microglia.
a Schematic illustrating 4-OHT treated Cre− control and Cre+ REV-ERBα KO (RKO) microglia for bulk RNA-seq. Created with Biorender.com. b Selected TOP 10 biological processes identified for DEGs in REV-ERBα KO microglia from bulk RNA-seq. c Heat-map representing genes from “Lipid metabolic process” GO term. Red: upregulation; Blue: downregulation. d Responses of inflammatory genes including Il6 and Il1b to 50 ng/ml LPS exposure in WT cultured microglia (n = 5 biologically independent samples). e Lipid-droplet staining using BODIPY 493/503 dye in 50 ng/ml LPS-treated WT cultured microglia by flow cytometry (n = 14 examined over four independent experiments). f Representative images of BODIPY+ signal in 4-OHT treated male/female Cre− control or Cre+ RKO cultured microglia (green; BODIPY, red; IBA1, blue; DAPI) and g, quantified BODIPY+ signals per cell (n = 8–9 independent cell cultures). Scale bar, 100 µm. h Mean Fluorescence Intensity (MFI) of BODIPY+ cells in 4-OHT-treated Cre− control and Cre+ RKO microglia using flow cytometry (n = 4–6 independent cell cultures). i Increased Plin2 expression in microglia transfected with control (siControl) or Rev-erbα (siRev-erbα) siRNA (n = cells from 6 pups/genotype). **p < 0.01, ***p < 0.005, ****p < 0.001, by two-tailed T test or two-way ANOVA with Sidak multiple comparisons test. P values > 0.05 are listed. Error bars represent SEM.
Fig. 5
Fig. 5. Lipid-droplet marker Plin2 is increased in microglia in human AD patients and aged REV-ERBα KO mice.
a Transcriptional upregulation of human PLIN2 and PLIN3, but not other PLIN family members, in the entorhinal cortex (EC) of AD patients, is associated with downregulation of REV-ERBα (NR1D1) in the GSE5281 dataset (control, n = 13; AD patient, n = 10). b UMAP of cell clusters from the Seattle AD Cell Atlas with c PLIN2 expression in the microglial cluster. d Schematic depiction of experimental workflow. Microglia were isolated from whole brain homogenate from WT mice at the two different time points (ZT0/ZT12) using CD11b. Created with Biorender.com. e Bar graph of each PLIN isoform and f expression pattern of Plin2 and Nr1d1 (REV-ERBα) in isolated microglia from adult mice at ZT0 (6 am) and ZT12 (6 pm), based on mean counts-per million (CPM) from RNA-seq and were normalized to Plin1 expression (n = 3). g Representative images and h, quantification of immunostaining results for microglial PLIN2 (green) and IBA1 (red) in hippocampal CA3 region from WT and global REV-ERBα KO (RKO) mice (n = 3–4 mice per group). Scale bar, 500 µm. *p < 0.05, **p < 0.01, ***p < 0.005, ****p < 0.001 by two-way ANOVA with Sidak multiple comparison test, two-tailed t test, or one-way ANOVA. P values > 0.05 are listed. Error bars represent SEM.
Fig. 6
Fig. 6. Lipid accumulation contributes to impaired tau uptake in REV-ERBα KO microglia.
a Dose-dependent increase in BODIPY+ LDs after oleic acid (OA, 1 μM) treatment in cultured microglia (n = 4–9 independent cell cultures). b Dose-dependent increase in pro-inflammatory cytokine (Il6 and Il1b) and Plin2 gene expression in cultured microglia after OA treatment (n = 3 independent cell cultures). All transcript levels are normalized to DMSO-treated cells (VEH). c Pharmacological inhibitors of LD formation (iDGAT1; 10 μM A922500 and 5 μM PF-04620110) block increases in BODIPY signal in OA-treated cultured microglia by flow cytometry (n = 3–6 independent cell cultures). d Strategy for generating FITC-tau aggregates. Monomeric form, sample (1), is incubated for 7 days with heparin (10 mM) on 37 °C shaking incubator for sample (2) and centrifugation, to isolate pure aggregate. Created with Biorender.com. e Electron micrograph comparing the structure of monomeric and fibril forms of FITC-Tau. Scale bar: 100 nm. f Validation of optimal concentration of FITC-tau aggregates for uptake assays based on dose-response curve (4 nM, 40 nM, and 80 nM) in cultured microglia using flow cytometry. g Inhibition of FITC-tau uptake by OA is partially rescued by inhibitors of LDs formation (n = 3–6 independent cell cultures). h REV-ERBα KO (Cre+) microglia show decreased FITC-tau uptake compared to Cre− controls after 2 hours incubation. i iDGAT1 inhibitors only partially prevent LDs accumulation (BODIPY+ signal) in Cre− control and in REV-ERBα KO microglia. j iDGAT1 inhibitors partially rescue FITC-tau uptake in Cre+ REV-ERBα KO microglia. Data presented as % of untreated Cre− cell FITC-tau uptake. *p < 0.05, **p < 0.01, ***p < 0.005, ****p < 0.001 by one-way ANOVA or two-way ANOVA with Sidak test or two-tailed T test. P values > 0.05 are listed. Error bars represent SEM.
Fig. 7
Fig. 7. Sphingomyelin is ranked as the dominant lipid feature in TBE-treated microglia and sphingomyelin metabolism is altered in REV-ERBα KO.
a Pie chart showing that TOP 20 lipid classes which are the most upregulated in TBE-treated microglia compared to VEH-treated controls. b Top 20 differentially expressed lipids in TBE-treated microglia based on Log2 fold change. c The extracted chromatogram of phosphatidyl sphingomyelin (pSM) (m/z = 703.5729, [M+H]+) compared between VEH− and TBE-treated microglia d Observed MS1 spectrum of pSM. e Observed MS2 spectrum of pSM. Signature fragmentation of the head group (183 + H) at m/z = 184 and cyclophosphane (124 + H) at m/z = 125 was indicated with red and blue arrow, respectively. f BODIPY+ signals are accumulated in microglia by pSM treatment in a dose-dependent manner (n = 6–7 independent cell cultures). g Upregulating sphingomyelin metabolic process in REV-ERBα KO microglia (n = 3). *p < 0.05, **p < 0.01, ****p < 0.001 by one-way ANOVA or two-way ANOVA with Sidak test. P values > 0.05 are listed. Error bars represent SEM.
Fig. 8
Fig. 8. Hypothetical mechanism of REV-ERBα on microglia-mediated internalization of tau aggregatse through control of lipid-droplet expression and its effect on tauopathy in male PS19 mice.
Microglial REV-ERBα KO leads to LD accumulation and inflammation in microglia and causes dampened microglia tau phagocytosis. Tauopathy is more severe in microglial REV-ERBα KO; PS19 mice than in control PS19 mice, particularly in male mice. Created with Biorender.com.

References

    1. Wang S, Li F, Lin Y, Wu B. Targeting REV-ERBalpha for therapeutic purposes: promises and challenges. Theranostics. 2020;10:4168–4182. doi: 10.7150/thno.43834. - DOI - PMC - PubMed
    1. Griffin P, et al. Circadian clock protein Rev-erbalpha regulates neuroinflammation. Proc. Natl. Acad. Sci. USA. 2019;116:5102–5107. doi: 10.1073/pnas.1812405116. - DOI - PMC - PubMed
    1. Jakel S, Dimou L. Glial cells and their function in the adult brain: a journey through the history of their ablation. Front. Cell Neurosci. 2017;11:24. doi: 10.3389/fncel.2017.00024. - DOI - PMC - PubMed
    1. Lee J, et al. Inhibition of REV-ERBs stimulates microglial amyloid-beta clearance and reduces amyloid plaque deposition in the 5XFAD mouse model of Alzheimer’s disease. Aging Cell. 2020;19:e13078. doi: 10.1111/acel.13078. - DOI - PMC - PubMed
    1. Chew H, Solomon VA, Fonteh AN. Involvement of lipids in Alzheimer’s disease pathology and potential therapies. Front Physiol. 2020;11:598. doi: 10.3389/fphys.2020.00598. - DOI - PMC - PubMed

Publication types

Substances