. 2023 Aug 25;14(1):5211.
doi: 10.1038/s41467-023-40822-9.

Driver gene combinations dictate cutaneous squamous cell carcinoma disease continuum progression

Affiliations

Driver gene combinations dictate cutaneous squamous cell carcinoma disease continuum progression

Peter Bailey et al. Nat Commun. .

Abstract

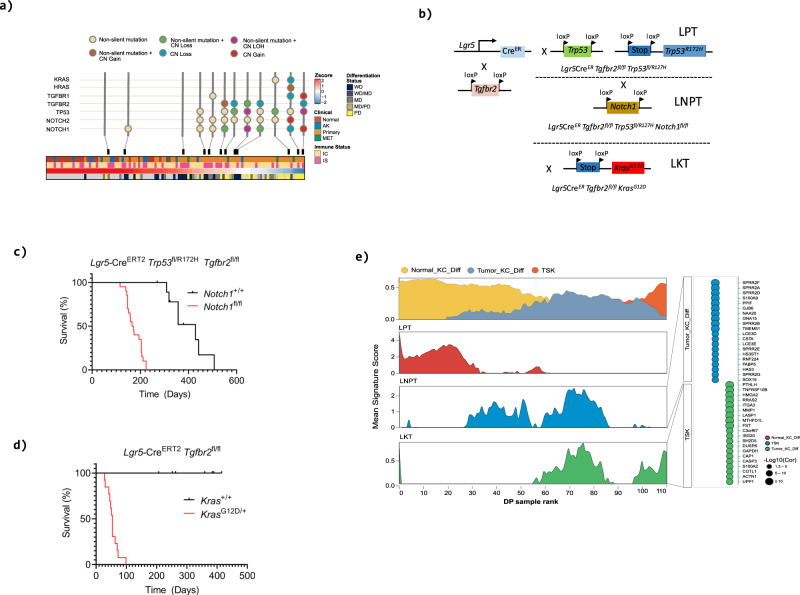
The molecular basis of disease progression from UV-induced precancerous actinic keratosis (AK) to malignant invasive cutaneous squamous cell carcinoma (cSCC) and potentially lethal metastatic disease remains unclear. DNA sequencing studies have revealed a massive mutational burden but have yet to illuminate mechanisms of disease progression. Here we perform RNAseq transcriptomic profiling of 110 patient samples representing normal sun-exposed skin, AK, primary and metastatic cSCC and reveal a disease continuum from a differentiated to a progenitor-like state. This is accompanied by the orchestrated suppression of master regulators of epidermal differentiation, dynamic modulation of the epidermal differentiation complex, remodelling of the immune landscape and an increase in the preponderance of tumour specific keratinocytes. Comparative systems analysis of human cSCC coupled with the generation of genetically engineered murine models reveal that combinatorial sequential inactivation of the tumour suppressor genes Tgfbr2, Trp53, and Notch1 coupled with activation of Ras signalling progressively drives cSCC progression along a differentiated to progenitor axis. Taken together we provide a comprehensive map of the cSCC disease continuum and reveal potentially actionable events that promote and accompany disease progression.


Conflict of interest statement

The authors declare no competing interests.

Figures

Fig. 1
Fig. 1. cSCC progression is associated with the orchestrated suppression of epidermal differentiation and the induction of progenitor-like gene expression.
a Diagram of the stratified layers of the skin epithelium and their associated gene signatures (left panel). Consensus clustering of 110 human human samples profiled by RNAseq identifies two classes of samples. b Boxplots demonstrating the enrichment of Late Epidermal Differentiation, Early Epidermal Differentiation and Progenitor gene signatures in normal (red, n = 26), AK (blue, n = 14), primary (orange, n = 66) and metastatic cSCC (MET, green, n = 4). Boxplots are annotated by a Kruskall-Wallis P value with P values <= 0.05 indicating a significant difference between clinical designations. c Heatmap showing the expression of genes associated with late epidermal differentiation and a Progenitor-like state across a spectrum of cSCC clinical designations. The genes shown in the heatmap represent a Differentiation-Progenitor-like (DvP) signature which has been used to order samples along an axis of late epidermal differentiation to progenitor-like gene expression (DvP signature score). Patient Immune status (IC, immunocompetent, IS, immunosuppressed) and differentiation status of the primary tumours (WD, well differentiated; MD, moderately differentiated; PD, poorly differentiated) are indicated. d Schematic diagram showing the CIBERSORTx workflow, which was used to estimate the proportion of defined single cell populations resident in bulk tumour SCC samples. e Boxplots showing the estimated percentage of defined single cell populations representing Normal Keratinocytes Differentiated, Tumour Keratinocytes Differentiated and Tumour Specific Keratinocyte cells in Normal (red), AK (blue), Primary (orange) and MET (green) bulk cSCC samples. Boxplots are annotated by a Kruskall-Wallis P value with P values <= 0.05 indicating a significant difference between clinical designations. f Donut charts showing the percent tumour enrichment of defined single cell populations in bulk cSCC samples stratified by clinical designation. g Bar charts showing the enrichment of defined single cell populations in bulk cSCC samples ordered according to the DP signature score (KC, keratinocyte; Diff, differentiated; Cyc, cycling). Source data for b and e are provided in the Source Data file.
Fig. 2
Fig. 2. cSCC progression is associated with the orchestrated gain and loss of key molecular pathways and/or processes associated with epidermal differentiation, cell-cell communication, metabolism, immune signalling and progenitor-like cell states.
a K-means clustering of normalised expression values identifies 15 core gene clusters representing co-ordinately expressed sets of genes. Heatmap shows gene expression levels of genes in 9 core co-expressed gene clusters with samples ordered by DvP signature score. b Gene set enrichment analysis showing significantly enriched molecular pathways and/or processes in the 9 core co-expressed gene clusters. Significance shown as bars -Log10(P values) Fischer’s exact test (two-sided) adjusted for multiple testing. c Transcription factor regulon activities correlate with keratinocyte population dynamics. Sets of TFs regulons significantly (P values <= 0.05) correlated with percent enrichment of defined indicated single cell populations as estimated by CIBERSORTx. Samples are ordered by DP signature score with defined single cell enrichment estimates shown in the top bar chart (see Fig. 1g).
Fig. 3
Fig. 3. The orchestrated suppression of late epidermal differentiation and induction of a progenitor-like state is associated with dynamic changes in immune cell infiltrates, immunomodulatory genes and correlates with epidermal differentiation complex modulation.
a Heatmap showing the relative enrichment of immune cell types and/or phenotypes as defined by xCell across the entire cSCC cohort. Area charts showing mean gene expression (lower panels) for cohort samples ordered by DP signature score. Mean ARG1 expression is significantly downregulated as sample DP scores shift form late differentiation to progenitor-like. In contrast, the mean gene expression of immune inhibitory factors CD274 and CD276 show significant enrichment in samples with a high progenitor-like score. b Pearson correlation analysis of immune inhibitory factors. c Dot chart showing inhibitory and stimulatory immunomodulatory factors significantly correlated with Normal_KC_Diff, Tumour_KC_Diff and TSK enrichment bulk tumour fractions. The size of each dot represents -log10(Cor Pval) of the designated correlation. Significance was determined by two-sided Pearson’s correlation test. P values were not adjusted for multiple testing. d Heatmap showing the relative expression of EDC genes. Samples are ordered by DP signature score and genes are ordered by DP signature correlation. Percent single cell enrichment estimates are shown in the top bar chart (see Figs. 1g, 2c). e Heatmap showing significant correlations between EDC genes and immune cell type/phenotype enrichment scores. Correlations are presented as -log10 (Cor Pvalue) x sign (Cor) with red representing a significant positive correlation and blue representing a significant negative correlation. Pearson’s correlations are shown in the plot. Significance was determined by two-sided Pearson’s correlation test. P values were not adjusted for multiple testing. All correlations shown are significant.
Fig. 4
Fig. 4. Driver gene combinations dictate disease progression in murine genetically engineered cSSC and recapitulate human disease progression.
a Oncoprint of selected driver genes in samples profiled by whole exome sequencing ordered by DP axis rank. b Schematic description of genetic crossing strategies. Cre, cre recombinase, ER, estrogen receptor, loxp, Cre-lox recombination site. c, d Kaplan-Meier analysis of overall survival. Loss of Tgfbr2 coupled with mutation/loss of Trp53 drives skin tumorigenesis in mice (LPT, n = 9; L = Lgr5, P = Trp53, T = Tgfbr2) which is accelerated by loss of Notch1 (LNPT, n = 20, N=Notch1), (p < 0.001 [log rank Mantel-Cox test, chi square 25.13, df 1]) (c). Combinatorial knock in of activated KrasG12D coupled with deletion of Tgfbr2 results in rapid skin tumour formation (LKT, n = 13, LT n = 16, K=KrasG12D) (d). e Area charts showing mean tumour cell type enrichment (top panel) and mean GEMM signature enrichment (lower panels) for cohort samples ordered by DP signature score. Genes significantly enriched (Pval <= 0.05 and logFC >= 2) in a specific mouse genotype were used as signature genes for enrichment analysis. Single sample gene set enrichment (ssGSEA) was employed to determine signature enrichment in bulk human cSCC. Source data for c and d are provided in the Source Data file.
Fig. 5
Fig. 5. Conservation of transcription factor regulation, EDC modulation and immune modulation in murine and human tumours.
a Heatmaps of transcription factors significantly enriched in the indicated genotypes (left panel). Transcription factor enrichment plots in indicated human keratinocyte samples ordered by DP axis. Selected conserved TFs between murine genotypes and human keratinocyte populations are highlighted. b Heatmap showing significant murine EDC gene correlations with immune cell marker gene expression. c Box plot showing S100a2 expression in indicated murine tumours (LKT, n = 12; LPT, n = 6; LNPT, n = 12; L=Lgr5, P=Trp53, T=Tgfbr2, N=Notch1, K= KrasG12D). Plot is annotated with Wilcoxon rank sum P value (two-sided) not adjusted for multiple testing. d Scatter plots of Cd3b and Ly6g immune cell marker gene expression versus S100a2 in indicated murine tumours. Pearson’s correlations are shown in the plots. Significance was determined by two-sided Pearson’s correlation test. P values were not adjusted for multiple testing. The plots show a solid regression line and error bands representing 95% confidence intervals. e Bar charts of immune cell populations measured by IHC in GEMM models of CD3, CD4, CD8, F4/80 and Ly6G positive populations. (LPT n = 6; LNPT, n = 6; LKT, n = 10; shaded bars indicate tumour centre, empty bars tumour border). Mean +/- SD are shown. *=p < 0.05, **p < 0.01, 2-tailed Welch’s t test. f Conservation of changes in the ratio of adaptive (CD4 and CD8 +ve T cells) to innate immune cells (macrophages and neutrophils) assessed by IHC in murine tumours (upper box plot) and human tumours assessed by Xcell (lower box plot) of similar genotypes, TP53 mutation (P), NOTCH 1 or 2 mutation (N), TGFBR1/TGFBR2 mutation (T), HRAS or KRAS mutational activation (R). Mean +/− SD are shown (<3 N, P, T n = 5; NPT, n = 5; PNR + PNTR, n = 2) *=p < 0.05, **p < 0.01, 2-tailed Welch’s t test. Source data for c, e and f are provided in the Source Data file.

References

    1. Urban K, Mehrmal S, Uppal P, Giesey RL, Delost GR. The global burden of skin cancer: a longitudinal analysis from the Global Burden of Disease Study, 1990-2017. JAAD Int. 2021;2:98–108. doi: 10.1016/j.jdin.2020.10.013. - DOI - PMC - PubMed
    1. Schmults CD, Karia PS, Carter JB, Han J, Qureshi AA. Factors predictive of recurrence and death from cutaneous squamous cell carcinoma: a 10-year, single-institution cohort study. JAMA Dermatol. 2013;149:541–547. doi: 10.1001/jamadermatol.2013.2139. - DOI - PubMed
    1. Venables ZC, et al. Nationwide incidence of metastatic cutaneous Squamous cell carcinoma in England. JAMA Dermatol. 2019;155:298–306. doi: 10.1001/jamadermatol.2018.4219. - DOI - PMC - PubMed
    1. Canueto J, et al. Comparing the eighth and the seventh editions of the American Joint Committee on Cancer staging system and the Brigham and Women’s Hospital alternative staging system for cutaneous squamous cell carcinoma: Implications for clinical practice. J. Am. Acad. Dermatol. 2019;80:106–113 e102. doi: 10.1016/j.jaad.2018.06.060. - DOI - PubMed
    1. Ruiz ES, Karia PS, Besaw R, Schmults CD. Performance of the American Joint Committee on Cancer Staging Manual, 8th Edition vs the Brigham and Women’s Hospital Tumor Classification System for Cutaneous Squamous Cell Carcinoma. JAMA Dermatol. 2019;155:819–825. doi: 10.1001/jamadermatol.2019.0032. - DOI - PMC - PubMed

Publication types