. 2023 Aug 25;13(1):13912.
doi: 10.1038/s41598-023-40277-4.

Refinement of an ovine-based immunoglobulin therapy against SARS-CoV-2, with comparison of whole IgG versus F(ab')2 fragments

Affiliations

Refinement of an ovine-based immunoglobulin therapy against SARS-CoV-2, with comparison of whole IgG versus F(ab')2 fragments

Stephen Findlay-Wilson et al. Sci Rep. .

Erratum in

Abstract

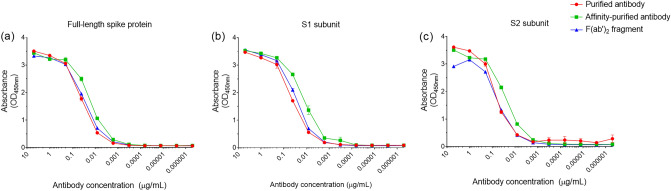
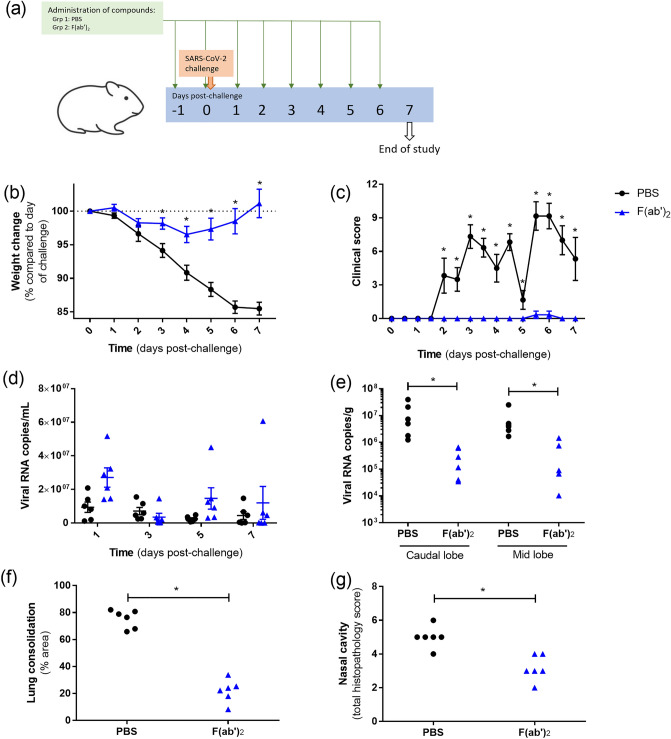
The development of new therapies against SARS-CoV-2 is required to extend the toolkit of intervention strategies to combat the global pandemic. In this study, hyperimmune plasma from sheep immunised with whole spike SARS-CoV-2 recombinant protein has been used to generate candidate products. In addition to purified IgG, we have refined candidate therapies by removing non-specific IgG via affinity binding along with fragmentation to eliminate the Fc region to create F(ab')2 fragments. These preparations were evaluated for in vitro activity and demonstrated to be strongly neutralising against a range of SARS-CoV-2 strains, including Omicron B2.2. In addition, their protection against disease manifestations and viral loads were assessed using a hamster SARS-CoV-2 infection model. Results demonstrated protective effects of both IgG and F(ab')2, with the latter requiring sequential dosing to maintain in vivo activity due to rapid clearance from the circulation.


Conflict of interest statement

The authors declare the following financial interests/personal relationships which may be considered as potential competing interests: Sandra Smith and Neville Pope are employees of International Therapeutic Proteins Ltd. Matthew Aldridge is an employee of MicroPharm Ltd. Gareth Humphries and Holger Schuhmann are employees of the Native Antigen Company. All other authors declare no known competing financial interests or personal relationships that could have appeared to influence the work reported in this paper.

Figures

Figure 1
Figure 1
Schematic diagram outline the process for producing purified IgG, affinity-purified IgG and F(ab’2) fragment preparations developed as SARS-CoV-2 therapeutic candidates.
Figure 2
Figure 2
Antigen binding kinetics of purified, affinity-purified and F(ab′)2 fragments to recombinant SARS-CoV-2 glycoproteins. (a) Reactivity to whole spike protein. (b) Reactivity to S1 subunit protein. (c) Reactivity to S2 subunit protein. Lines indicate mean values with error bars denoting standard error.
Figure 3
Figure 3
Testing of protective responses of antibody and F(ab′)2 preparations against SARS-CoV-2 in hamsters. (a) Outline of study schedule, with n = 6 hamsters per group. (b) Kaplan–Meier survival plot. (c) Body weight changes in animals as a percentage compared to the weight on the day of challenge. (d) Clinical score of animals. (c,d) Lines show mean values with error bars denoting standard error. *Indicates a statistically significant difference compared to the PBS control group (P < 0.05, Mann–Whitney test).
Figure 4
Figure 4
Circulating antibody levels on the day of challenge and comparison of clinical outputs with an animal in which antibody was not detected in circulation. (a) Antibody binding to whole spike protein. Results show the mean absorbance level from each animal tested at a 1:100 dilution. Bar and whisker plots denote mean and standard error. *Indicates statistical significance (P < 0.05, Mann–Whitney test). (b) Body weight change and (c) Clinical score of individual animals receiving affinity-purified antibody, with the individual animal with undetectable levels represented by open symbols.
Figure 5
Figure 5
Viral load levels in samples from animals receiving antibody-based compounds prior to challenge with SARS-CoV-2. (a) Viral RNA in pharyngeal swabs. Bars show mean values with error bars denoting standard error. (b) Viral titre responses from nasal wash samples and (c) pharyngeal swab collected 2 days post-challenge. Bar and whisker plots denote mean and standard error. (d) Viral RNA levels in lung samples collected at the time of necropsy. Bars show mean values with error bars denoting standard error. * indicates statistical significance (P < 0.05, Mann–Whitney test).
Figure 6
Figure 6
Histopathological changes in the lung and nasal cavity of animals receiving antibody-based compounds prior to SARS-CoV-2 challenge. (a) Heatmap showing the severity scores of individual histopathological changes and average scores in the lung and nasal cavity (subjective scoring). Airway infl infiltration of airways by inflammatory cells, PV peri-vascular inflammatory cell cuffing, PA peri-airway inflammatory cell cuffing, alveolar inflam infiltration of alveolar spaces and wall by inflammatory cells, NC exudate inflammatory cell exudate in nasal cavity lumen, NC necrosis epithelial cell degeneration and necrosis in the nasal cavity, (b) Total histopathological scores of changes in the lung and (c) nasal cavity (subjective scoring). (d) The extent of staining of viral RNA in the nasal cavity (quantitative analysis). (b–d) Bar and whisker plots denote mean and standard error. *Indicates statistical significance (P < 0.05, Mann–Whitney test).
Figure 7
Figure 7
Representative images of microscopic changes in the lung and nasal cavity. Top row, lung- multifocal to patchy areas of pneumonic consolidation (asterisks) (H&E); middle row, nasal cavity – patchy to diffuse inflammation and degeneration of the mucosa with variable luminal exudate (arrows) (H&E); lower row, nasal cavity staining for SARS-CoV-2 viral RNA in the mucosa and luminal exudate (ISH).
Figure 8
Figure 8
Clinical, virology and histopathological results from animals receiving daily intraperitoneal F(ab′)2 preparations. (a) Schematic overview of study design. (b) Change in body weight and (c) clinical score. Lines show mean values with errors bars denoting standard error. (d) Viral RNA levels from pharyngeal swabs. Box and whisker plot show mean value and standard error. (e) Viral RNA levels from lung samples. (f) Percentage of area of lung with consolidation as determined by image analysis. (g) Histopathology scores for nasal cavity. *Indicates statistical significance (P < 0.05, Mann–Whitney test).

References

    1. Cucinotta D, Vanelli M. WHO declares COVID-19 a pandemic. Acta Biomed. 2020;91(1):157–160. - PMC - PubMed
    1. Findlay-Wilson S, Easterbrook L, Smith S, Pope N, Humphries G, Schuhmann H, et al. Development of a cost-effective ovine antibody-based therapy against SARS-CoV-2 infection and contribution of antibodies specific to the spike subunit proteins. Antiviral Res. 2022;203:105332. doi: 10.1016/j.antiviral.2022.105332. - DOI - PMC - PubMed
    1. Black RE, Gunn RA. Hypersensitivity reactions associated with botulinal antitoxin. Am. J. Med. 1980;69(4):567–570. doi: 10.1016/0002-9343(80)90469-6. - DOI - PubMed
    1. Leon G, Herrera M, Segura A, Villalta M, Vargas M, Gutierrez JM. Pathogenic mechanisms underlying adverse reactions induced by intravenous administration of snake antivenoms. Toxicon. 2013;76:63–76. doi: 10.1016/j.toxicon.2013.09.010. - DOI - PubMed
    1. Kraft S, Novak N. Fc receptors as determinants of allergic reactions. Trends Immunol. 2006;27(2):88–95. doi: 10.1016/j.it.2005.11.008. - DOI - PubMed

Publication types

Substances