. 2023 Aug 25;14(1):5208.
doi: 10.1038/s41467-023-40981-9.

MLL-AF4 cooperates with PAF1 and FACT to drive high-density enhancer interactions in leukemia

Affiliations

MLL-AF4 cooperates with PAF1 and FACT to drive high-density enhancer interactions in leukemia

Nicholas T Crump et al. Nat Commun. .

Abstract

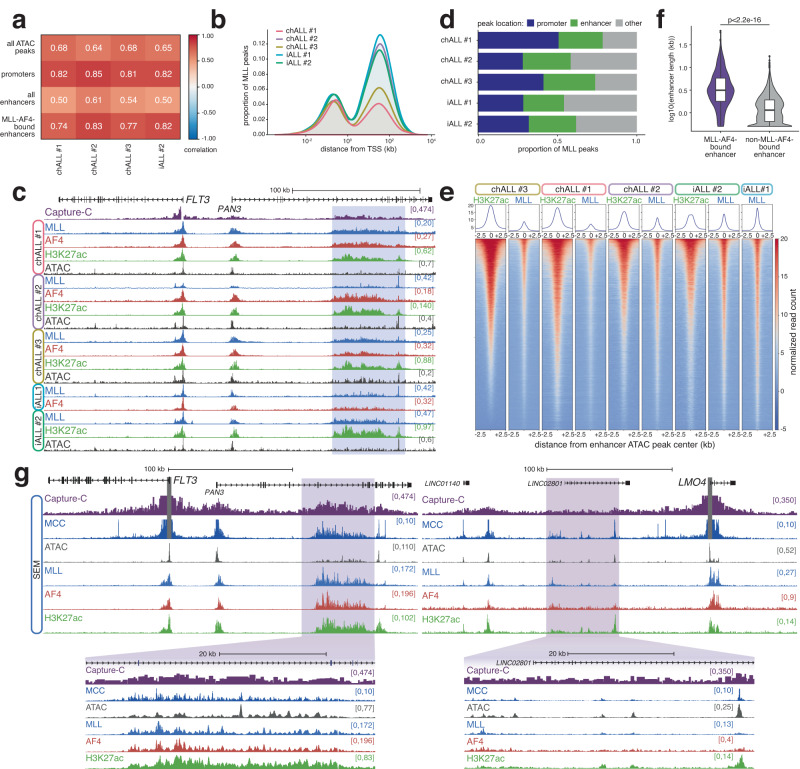
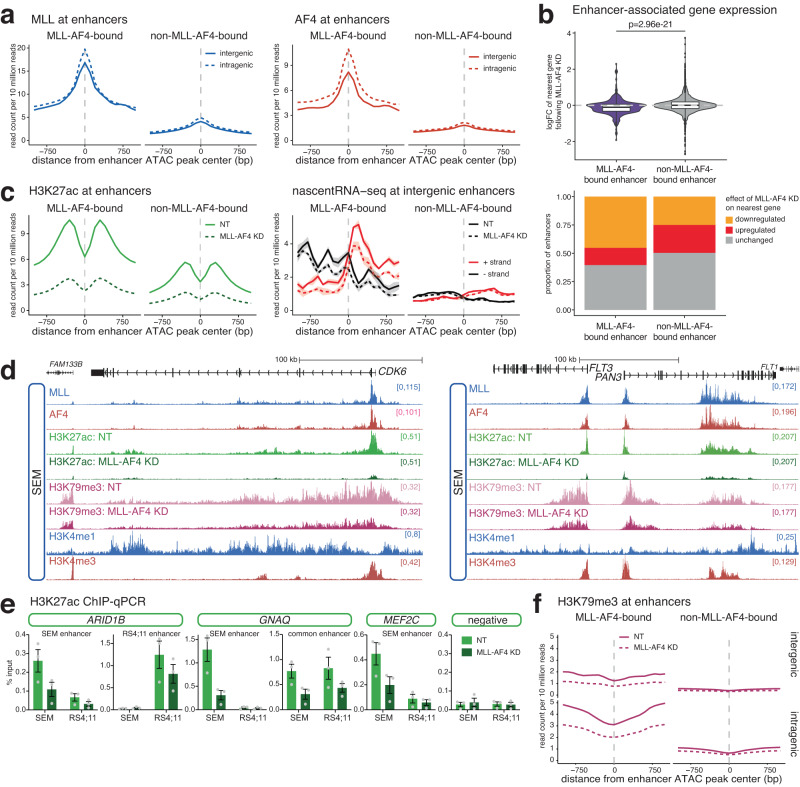
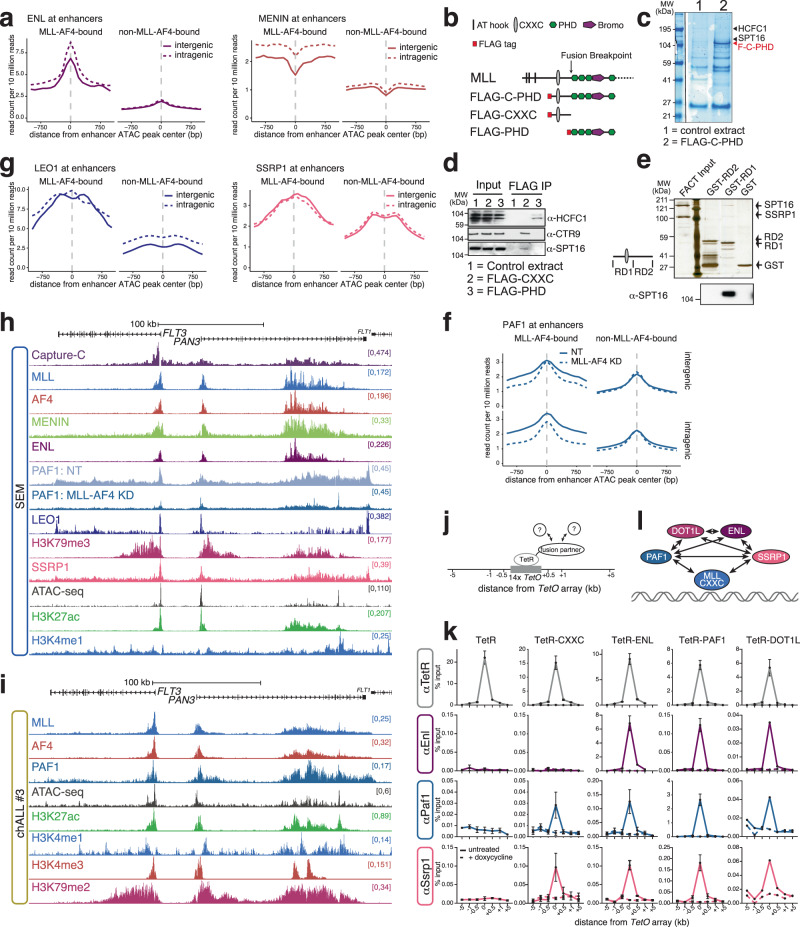
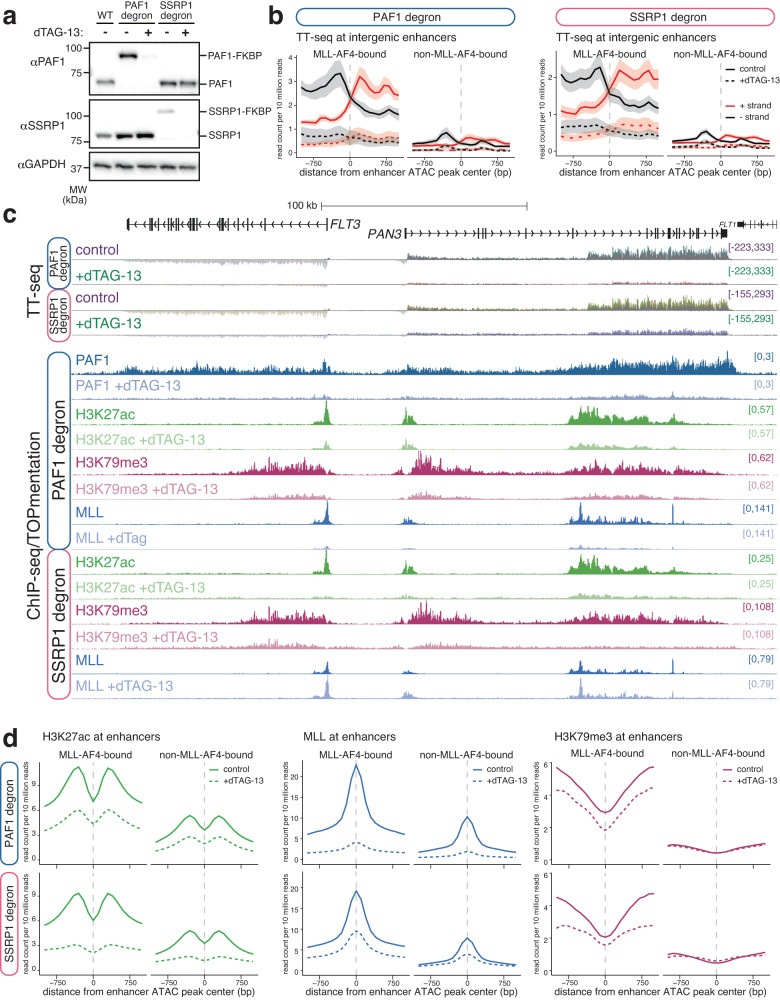
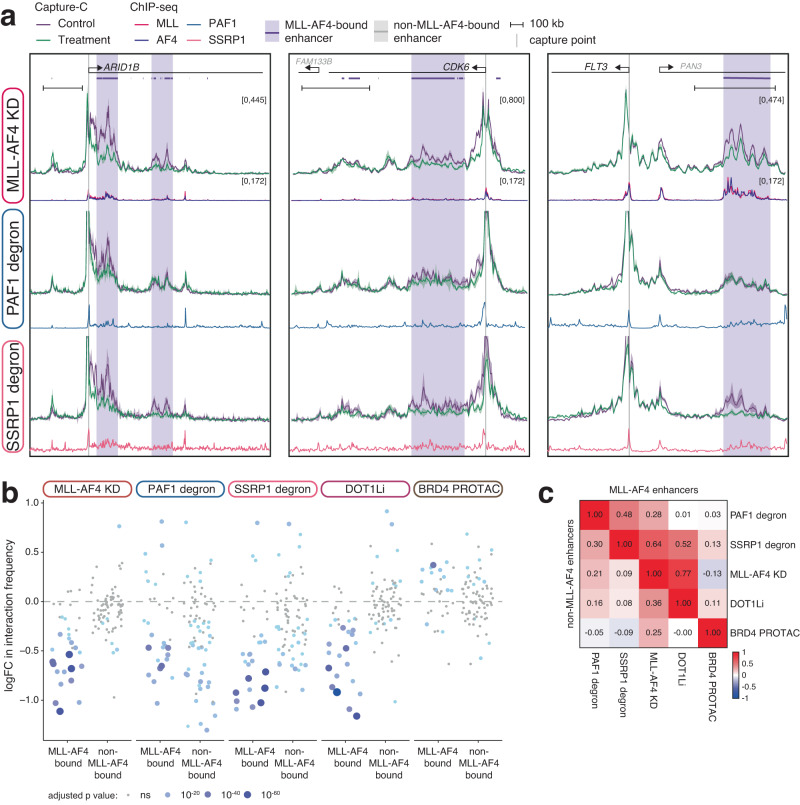
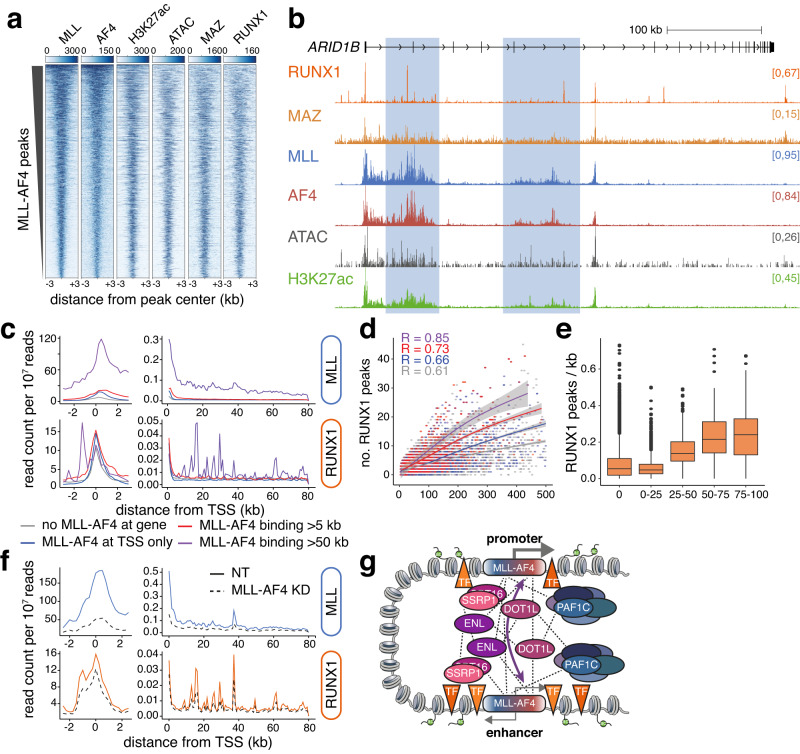
Aberrant enhancer activation is a key mechanism driving oncogene expression in many cancers. While much is known about the regulation of larger chromosome domains in eukaryotes, the details of enhancer-promoter interactions remain poorly understood. Recent work suggests co-activators like BRD4 and Mediator have little impact on enhancer-promoter interactions. In leukemias controlled by the MLL-AF4 fusion protein, we use the ultra-high resolution technique Micro-Capture-C (MCC) to show that MLL-AF4 binding promotes broad, high-density regions of enhancer-promoter interactions at a subset of key targets. These enhancers are enriched for transcription elongation factors like PAF1C and FACT, and the loss of these factors abolishes enhancer-promoter contact. This work not only provides an additional model for how MLL-AF4 is able to drive high levels of transcription at key genes in leukemia but also suggests a more general model linking enhancer-promoter crosstalk and transcription elongation.


Conflict of interest statement

T.A.M. and N.T.C. are paid consultants for and shareholders in Dark Blue Therapeutics Ltd. J.O.J.D. is a founder of and consultant for Nucleome Therapeutics. The remaining authors declare no competing interests.

Figures

Fig. 1
Fig. 1. MLL-AF4 binding at enhancers is a common feature of cell lines and primary material.
a Correlation of H3K27ac and MLL ChIP-seq/TOPmentation signal at all ATAC peaks, promoter ATAC peaks, all enhancers and MLL-AF4-bound enhancers for the indicated patient samples. b Distribution of MLL peaks in five MLL-AF4 patient samples relative to the nearest TSS. c ChIP-seq/TOPmentation for MLL, AF4 and H3K27ac, and ATAC-seq at the FLT3/PAN3 locus in the indicated patient samples. Capture-C from the FLT3 TSS is shown for SEM cells. The MLL-AF4-bound enhancer within PAN3 is highlighted in blue. d Proportion of MLL peaks associated with promoters and enhancers in each patient sample. e Heatmap of H3K27ac ChIP-seq and MLL ChIP-seq/TOPmentation signal in the indicated patient samples at enhancer ATAC-seq peaks. f Distribution of the length of enhancers bound (n = 807) or not bound (n = 8948) by MLL-AF4 in SEM cells. p-value indicates the statistical significance of the difference in enhancer length (two-sided Wilcoxon rank sum test), p < 2.2 × 10−16. Midline shows median, with upper and lower hinges showing the 25th and 75th percentile, respectively. Upper and lower hinges extend to the largest and smallest datapoints within 1.5 times the interquartile range of either hinge. g Capture-C, Micro-Capture-C (MCC), ATAC-seq and ChIP-seq for MLL, AF4 and H3K27ac at the FLT3 and LMO4 loci in SEM cells. Enhancer regions are highlighted in purple. Capture-C and MCC traces scaled to emphasize distal interactions.
Fig. 2
Fig. 2. MLL-AF4 binding is required for the maintenance of enhancer signatures.
a Mean distribution of MLL (left) and AF4 (right) at MLL-AF4-bound and non-MLL-AF4-bound intergenic (solid line) or intragenic (dashed line) enhancers in SEM cells. Plots are centered on ATAC-seq peaks found within enhancers. b Upper: Mean log-fold change in gene expression in SEM cells following 96 h MLL-AF4 knockdown for genes associated with an MLL-AF4-bound enhancer or genes associated with an enhancer not bound by MLL-AF4, n = 3 independent experiments. Statistical significance calculated using a two-sided Mann–Whitney U test, p = 2.96 × 10−21. Midline shows median, with upper and lower hinges showing the 25th and 75th percentile, respectively. Upper and lower hinges extend to the largest and smallest datapoints within 1.5 times the interquartile range of either hinge. Lower: Proportion of enhancers associated with genes displaying each transcriptional response to MLL-AF4 knockdown. c Mean distribution of H3K27ac (left) and strand-specific nascent RNA-seq (enhancer RNA; right) levels at MLL-AF4-bound and non-MLL-AF4-bound enhancers, in SEM cells under control (NT) and 96 h MLL-AF4 knockdown conditions. Lines represent mean, shading represents ± SEM, n = 3 independent experiments for eRNA. d Reference-normalized ChIP-seq for H3K27ac and H3K79me3 at CDK6 and FLT3 in SEM cells under control (NT) and 96 h MLL-AF4 knockdown conditions. ChIP-seq for MLL, AF4, H3K4me1 and H3K4me3 is shown for context. e ChIP-qPCR for H3K27ac at the indicated enhancer regions in SEM and RS4;11 cells, under control (NT) and 96 h MLL-AF4 knockdown conditions. Data are represented as mean ± SEM, n = 3 independent experiments. Source data are provided as a Source Data file. f Mean distribution of H3K79me3 at MLL-AF4-bound and non-MLL-AF4-bound inter- and intragenic enhancers in SEM cells under control (NT) and MLL-AF4 knockdown conditions.
Fig. 3
Fig. 3. MLL-AF4 binding recruits transcription elongation factors to enhancers.
a Mean distribution of ENL and MENIN at MLL-AF4-bound and non-MLL-AF4-bound intergenic (solid line) and intragenic (dashed line) enhancers in SEM cells. b Schematic of wild-type N-terminal MLL structure, showing the domains used for immunoprecipitation. c Colloidal Blue-stained gel of control HEK-293 nuclear extracts (1) or HEK-293 nuclear extracts expressing the FLAG-C-PHD construct (2), immunoprecipitated with anti-FLAG antibody. Gel lanes were sliced and subjected to mass spectrometry (see “Methods”). Regions where the proteins HCFC1 and FACT complex component SPT16 were identified are indicated by arrowheads. The red arrowhead indicates the position of the FLAG-C-PHD protein. Image represents a single replicate used for MS. Source data are provided as a Source Data file. d Immunoblots for HCFC1, CTR9 (PAF1C component) and SPT16 following anti-FLAG immunoprecipitation of HEK-293 cell lysates expressing the indicated FLAG-tagged MLL domains. Representative of three experiments. Source data are provided as a Source Data file. e Silver-stained gel after affinity purification of GST-tagged MLL RD1 and RD2 domains following incubation with purified SPT16 and SSRP1 (FACT). Lower panel shows immunoblot for SPT16. Representative of two experiments. Source data are provided as a Source Data file. f Mean distribution of PAF1 at MLL-AF4-bound and non-MLL-AF4-bound intragenic and intergenic enhancers in SEM cells under control (NT; solid line) and 96 h MLL-AF4 knockdown (dashed line) conditions. g Mean distribution of PAF1C component LEO1 and FACT component SSRP1 at MLL-AF4-bound and non-MLL-AF4-bound intergenic (solid line) and intragenic (dashed line) enhancers in SEM cells. h ChIP-seq, ATAC-seq and Capture-C at the FLT3 locus in SEM cells. Reference-normalized ChIP-seq for PAF1 in SEM cells under control (NT) and 96 h MLL-AF4 knockdown conditions. The Capture-C viewpoint is the FLT3 TSS. i TOPmentation and ATAC-seq at the FLT3 locus in chALL patient #3. j Schematic showing the principle behind the TetR recruitment system. k ChIP-qPCR for the indicated proteins (left) at the TetO array inserted into mESCs expressing the indicated TetR fusion proteins (top). Dashed line shows ChIP-qPCR in cells treated with doxycycline for 6 h. Data are represented as mean ± SEM, n = 4 independent experiments for TetR FS2 in TetR, TetR FS2 in TetR-CXXC, TetR FS2 in TetR-Paf1, Enl in TetR, Enl in TetR-ENL, Paf1 in TetR, Paf1 in TetR-PAF1; n = 3 independent experiments for TetR FS2 in TetR-ENL, TetR FS2 in TetR-DOT1L, Enl in TetR-CXXC, Enl in TetR-Paf1, Paf1 in TetR-CXXC, Paf1 in TetR-ENL, Ssrp1 in TetR, Ssrp1 in TetR-CXXC, Ssrp1 in TetR-ENL, Ssrp1 in TetR-PAF1 and n = 2 independent experiments for Enl in TetR-DOT1L, Paf1 in TetR-DOT1L, Ssrp1 in TetR-DOT1L. Source data are provided as a Source Data file. l Model indicating direct or indirect in vivo interactions demonstrated in (k).
Fig. 4
Fig. 4. PAF1 and SSRP1 are required for the activity of MLL-AF4-bound and non-MLL-AF4-bound enhancers.
a Western blot for PAF1 or SSRP1 in wild-type (WT), PAF1 degron or SSRP1 degron cells, with (+) or without (−) addition of 0.5 µM dTAG-13 for 24 h. Blots are representative of three replicates. Bands representing wild-type and FKBP12 F36V-tagged proteins are indicated. Source data are provided as a Source Data file. b Mean distribution of strand-specific TT-seq (eRNA) levels at MLL-AF4-bound and non-MLL-AF4-bound intergenic enhancers in PAF1 degron or SSRP1 degron cell lines under control (untreated) and 24 h dTAG-13-treated conditions. Lines represent mean, shading represents ± SEM, n = 3 independent experiments. c TT-seq and reference-normalized ChIP-seq/TOPmentation at the FLT3 locus in PAF1 degron and SSRP1 degron SEM cells, with or without the addition of dTAG-13 for 24 h. d Mean distribution of H3K27ac, MLL and H3K79me3 at MLL-AF4-bound and non-MLL-AF4-bound enhancers in PAF1 degron (above) or SSRP1 degron (below) cell lines under control (untreated) and 24 h dTAG-13-treated conditions.
Fig. 5
Fig. 5. MLL-AF4 binding is necessary to maintain enhancer-promoter interactions.
a Capture-C from the promoters of ARID1B, CDK6, and FLT3 in SEM cells under control (purple) and 96 h MLL-AF4 knockdown (green) conditions (upper) or in PAF1 degron or SSRP1 degron cell lines under control (purple) and 24 h dTAG-13-treated (green) conditions. Lines represent mean, shading represents ± SEM, n = 3 independent experiments. ChIP-seq traces for MLL, AF4, PAF1 and SSRP1 are shown, along with bioinformatically-annotated MLL-AF4-bound (purple bars) and -unbound (gray bars) enhancers. b Statistical analysis of the changes in Capture-C interaction frequency between promoters and MLL-AF4-bound or -unbound enhancers following the indicated treatments. Size and color of the dot are proportional to the significance of the change in interaction with each enhancer. n = 3; ns: adjusted p-value ≥ 0.05; two-sided Mann–Whitney U test. The 7-day DOT1Li data and 24-h BRD4 PROTAC (AT1) data were previously published. c Correlation of changes in Capture-C interaction frequency between promoters and MLL-AF4-bound (upper triangle) or -unbound (lower triangle) enhancers, comparing the indicated treatments.
Fig. 6
Fig. 6. MLL-AF4 binding correlates with high-density TF binding.
a ChIP-seq and ATAC-seq heatmaps at MLL-AF4 peaks in SEM cells. b ChIP-seq for RUNX1, MAZ, MLL, AF4 and H3K27ac, and ATAC-seq at ARID1B. Putative enhancers are highlighted. c Mean ChIP-seq signal at expressed promoters over a 6 kb (left) or 80 kb (right) window. Profiles stratified by MLL-AF4 binding status. d Relationship between RUNX1 peak frequency within gene body and gene body length, stratified by MLL-AF4 binding status as in (c). Local regression (LOESS) lines fit are shown, with 95% confidence interval in gray. Correlation (R) calculated by MLL-AF4 binding status. e Density of RUNX1 ChIP-seq peaks over gene bodies, stratified by proportion of MLL-AF4 coverage, n = 1. Midline shows median, with upper and lower hinges showing the 25th and 75th percentile, respectively. Upper and lower hinges extend to the largest and smallest datapoints within 1.5 times the interquartile range of either hinge. f Mean ChIP-seq signal under control (NT) and 48 h MLL-AF4 knockdown conditions, at expressed promoters of genes containing an MLL-AF4 binding domain >50 kb, over a 6 kb (left) or 80 kb (right) window. g Model for the role of MLL-AF4 at enhancers in driving interaction with and transcription of target genes, recruiting a complex of transcription-associated proteins. Dashed lines indicate the network of protein-protein interactions.

References

    1. Furlong EEM, Levine M. Developmental enhancers and chromosome topology. Science. 2018;361:1341–1345. - PMC - PubMed
    1. van Steensel B, Furlong EEM. The role of transcription in shaping the spatial organization of the genome. Nat. Rev. Mol. Cell Biol. 2019;20:327–337. - PMC - PubMed
    1. Nollmann, M., Bennabi, I., Gotz, M. & Gregor, T. The impact of space and time on the functional output of the genome. Cold Spring Harb. Perspect. Biol.14, a040378 (2022). - PMC - PubMed
    1. Barwick BG, et al. Multiple myeloma immunoglobulin lambda translocations portend poor prognosis. Nat. Commun. 2019;10:1911. - PMC - PubMed
    1. Mansour MR, et al. Oncogene regulation. An oncogenic super-enhancer formed through somatic mutation of a noncoding intergenic element. Science. 2014;346:1373–1377. - PMC - PubMed

Publication types

MeSH terms