. 2023 Aug 25;6(1):875.
doi: 10.1038/s42003-023-05251-w.

Nrf2 alleviates spaceflight-induced immunosuppression and thrombotic microangiopathy in mice

Affiliations

Nrf2 alleviates spaceflight-induced immunosuppression and thrombotic microangiopathy in mice

Ritsuko Shimizu et al. Commun Biol. .

Abstract

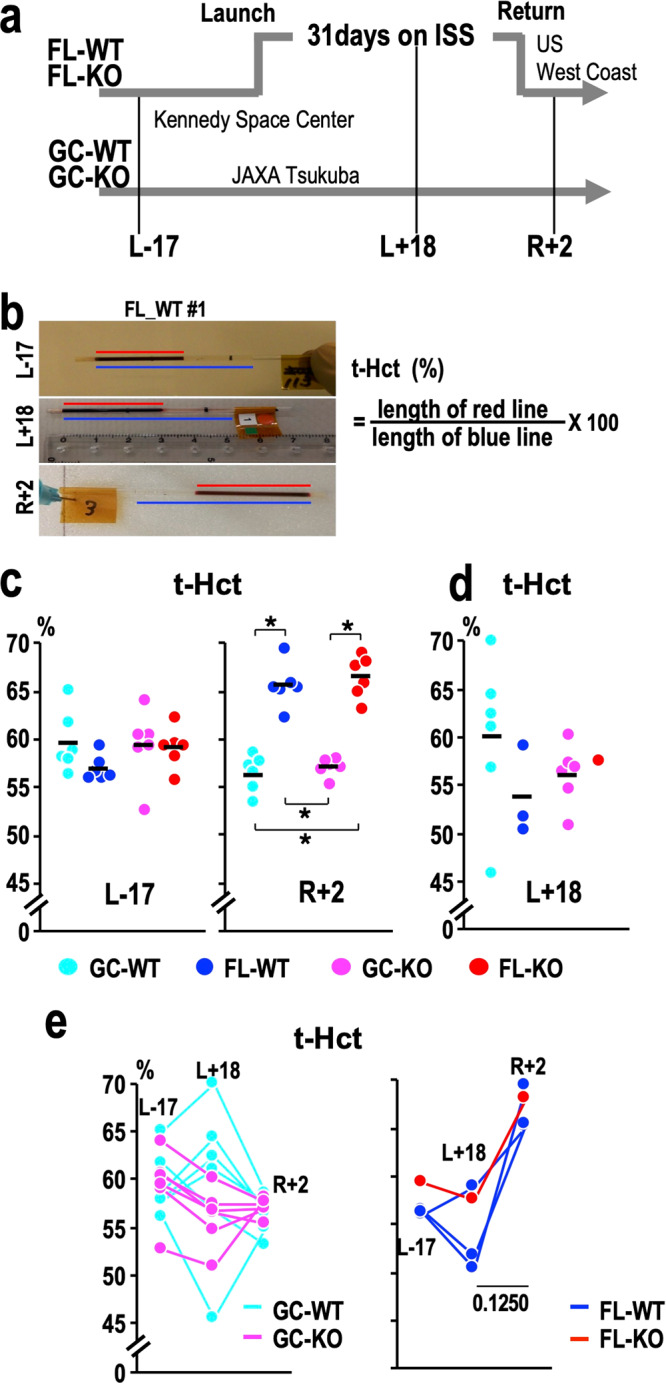
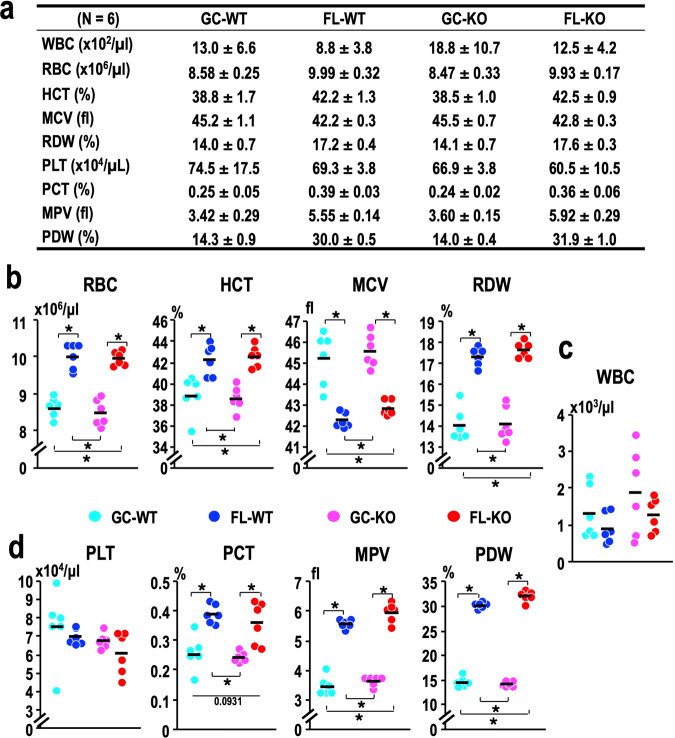
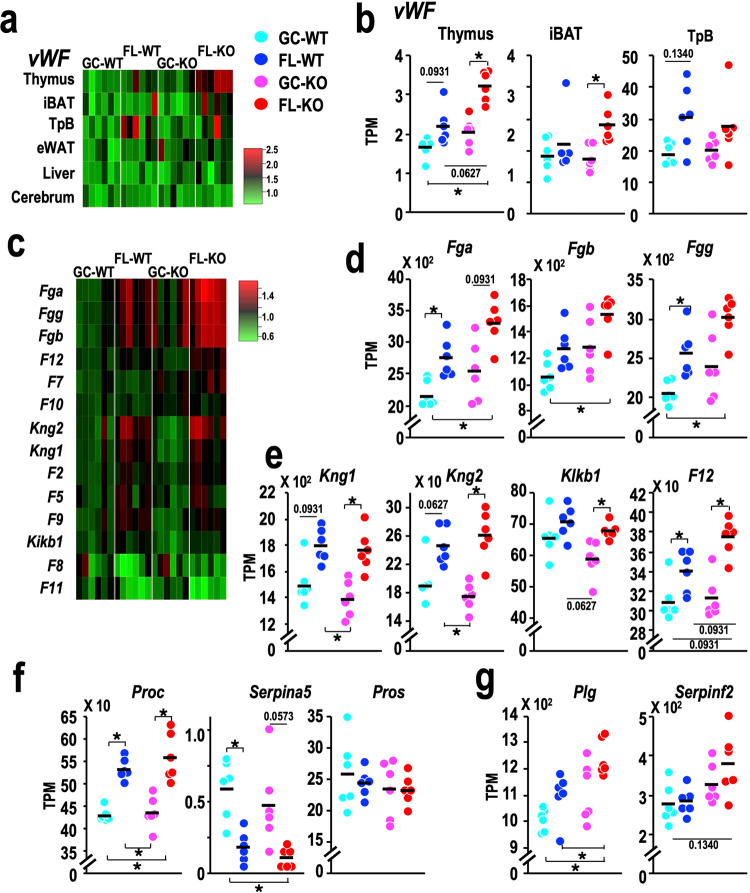
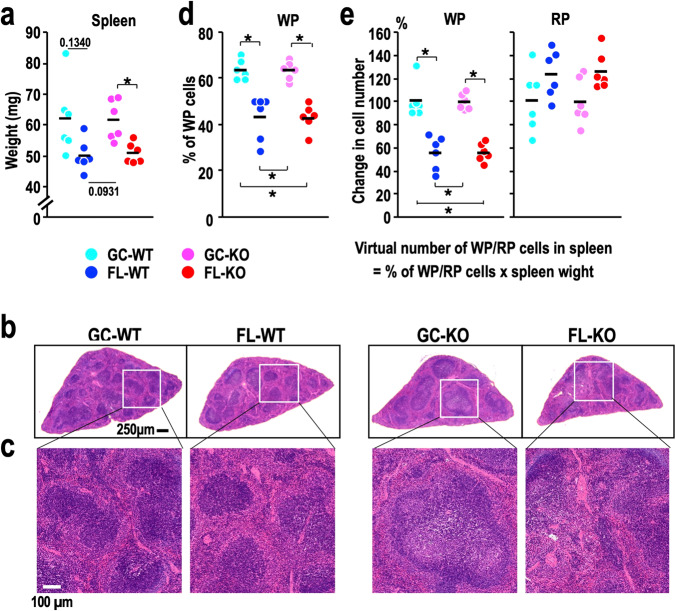
Spaceflight-related stresses impact health via various body systems, including the haematopoietic and immune systems, with effects ranging from moderate alterations of homoeostasis to serious illness. Oxidative stress appears to be involved in these changes, and the transcription factor Nrf2, which regulates expression of a set of cytoprotective and antioxidative stress response genes, has been implicated in the response to spaceflight-induced stresses. Here, we show through analyses of mice from the MHU-3 project, in which Nrf2-knockout mice travelled in space for 31 days, that mice lacking Nrf2 suffer more seriously from spaceflight-induced immunosuppression than wild-type mice. We discovered that a one-month spaceflight-triggered the expression of tissue inflammatory marker genes in wild-type mice, an effect that was even more pronounced in the absence of Nrf2. Concomitant with induction of inflammatory conditions, the consumption of coagulation-fibrinolytic factors and platelets was elevated by spaceflight and further accelerated by Nrf2 deficiency. These results highlight that Nrf2 mitigates spaceflight-induced inflammation, subsequent immunosuppression, and thrombotic microangiopathy. These observations reveal a new strategy to relieve health problems encountered during spaceflight.


Conflict of interest statement

The authors declare no competing interests.

Figures

Fig. 1
Fig. 1. Haematocrit of tail vein blood.
a Overview of the MHU-3 project, in which tail vein blood samples were collected from mice. b Representative pictures of the centrifuge tubes used for measuring tail-HCT values (t-Hct). Red and blue lines indicate the lengths of packed RBCs and whole blood, respectively. c Dot plots of t-Hct at L-17 (left) and R + 2 (right). *p < 0.05. d Dot plots of t-Hct at L + 18. e Time course of the changes in t-Hct at L-17, L + 18 and R + 2. Data from 6 GC-WT and 6 GC-KO mice are shown in the left panel, and those from 3 FL-WT and 1 FL-KO mice are shown in the right panel. The P-value obtained with the two-tailed Wilcoxon signed-rank test for the comparison between the values obtained at L + 18 and R + 2 in FL mice is shown. Dots represent individual animals in (c) (d) and (e). Means are shown in the plots in (d) and (e).
Fig. 2
Fig. 2. Evaluation of inferior vena cava blood parameters.
a Summary of haematopoietic indices. Mean values and standard deviations are shown. b–d Dot plots of the indicated values for erythroid parameters (b), white blood cell counts (c), and platelet parameters (d). Dots represent individual animals. Means are shown in the plots. *p < 0.05.
Fig. 3
Fig. 3. Gene expression changes related to coagulation and fibrinolysis.
a Heatmap of the relative expression of the vWF gene in the thymus, interscapular brown adipose tissue (iBAT), temporal bone (TpB), epididymal white adipose tissue (eWAT), liver, and cerebrum of GC-WT, FL-WT, GC-KO and FL-KO mice. The mean value obtained for each gene in GC-WT mice was set to one. b Dot plot of vWF gene expression in the thymus, iBAT and TpB. c Heatmap of the relative expression of coagulation factor genes in the livers of GC-WT, FL-WT, GC-KO and FL-KO mice. The mean value obtained for each gene in GC-WT mice was set to one. d Dot plot of the expression of fibrinogen genes in the liver. e Dot plot of the expression of the Kng1, Kng2, Klkb1 and F12 genes in the liver. f Dot plot of the expression of the Proc, Serpina5 and Pros genes in the liver. g Dot plot of the expression of the Plg and Serpinf2 genes in the liver. Dots represent individual animals. Means are shown in the plots. *p < 0.05.
Fig. 4
Fig. 4. Changes in spleen size parameters.
a Dot plot of spleen weight. Note that a reduction in spleen size becomes evident in the FL-KO mice. b Representative images showing HE staining of paraffin-embedded splenic cross sections from mice with the indicated genotypes. c Enlarged views of the selected regions (white boxes) from the images in (b). Note that shrinkage of the white pulp (WP) is obvious in FL-WT and FL-KO mice. d Frequency of WP cells in cross sections. e Calculated numbers of cells residing in WP (left) and red pulp (RP, right) areas in individual spleens. The mean value obtained for GC-WT mice in each group was set to 100%. Dots represent individual animals. Means are shown in the plots. *p < 0.05.
Fig. 5
Fig. 5. Genes downregulated in the spleen after spaceflight.
a Venn diagram of downregulated differentially expressed genes (DEGs) in the spleen for the FL-WT vs. GC-WT (green) and FL-KO vs. GC-KO (orange) comparisons. b Gene Ontology (GO) analysis of downregulated DEGs for the FL-WT vs. GC-WT (upper rows) and FL-KO vs. GC-KO (lower rows) comparisons. GO terms related to erythropoiesis are marked with a pink background. The number of genes and the adjusted p values are shown. c Heatmap of the relative expression of downregulated genes in the FL-WT vs. GC-WT or FL-KO vs. GC-KO comparison. The mean value obtained for each gene in GC-WT mice was set to one. Erythroid-related genes are coloured in red. Adjusted P values for the FL-WT vs. GC-WT and FL-KO vs. GC-KO comparisons are shown. d Dot plot of the expression of representative erythroid-related genes. Dots represent individual animals. Means are shown in the plots. *p < 0.05.
Fig. 6
Fig. 6. Populations of lineage-committed cells in the spleen.
a Schematic diagram of flow cytometry analyses of spleen mononuclear cells. LN2, liquid nitrogen. b Dot plot of the frequencies of ckit+CD71+Ter119- erythroblasts and CD61+CD41+ megakaryocytes in live cells from the spleen. c Dot plot of the frequencies of M1 and M2 macrophages, myeloid dendritic cells (mDCs) and plasmacytoid DCs (pDCs) in live cells from the spleen. d Dot plot of the frequencies of T-prognitors, B-progenitors, B cells, natural killer (NK) cells, neutrophils, eosinophils, basophils and mast cells in live cells from the spleen. Dots represent individual animals. Means are shown in the plots. *p < 0.05.
Fig. 7
Fig. 7. Populations of lineage-committed cells in the bone marrow.
a Schematic diagram of flow cytometry analyses of bone marrow mononuclear cells. b Dot plot of the frequencies of ckit+CD71+Ter119- erythroblasts and CD61+CD41+ megakaryocytes in live cells from the bone marrow. c Dot plot of the frequencies of M1- and M2 macrophages, mDCs and pDCs in live cells from the bone marrow. d Dot plot of the frequencies of T-progenitors, B-progenitors, B cells, NK cells, neutrophils, eosinophils, basophils and mast cells in live cells from the bone marrow. Dots represent individual animals. Means are shown in the plots. *p < 0.05.
Fig. 8
Fig. 8. RNA-seq analysis of bone marrow samples focusing on the comparison between GC and FL mice.
a Cluster analysis of DEGs based on the k-means method. b Cluster-specific GO enrichment analysis. GO terms related to erythropoiesis (marked with a pink background) and the immune system (marked with an orange background) are enriched in Clusters I and II, respectively. The number of genes and the adjusted p values are shown. c Venn diagram of downregulated DEGs in the bone marrow for the FL-WT vs. GC-WT (green) and FL-KO vs. GC-KO (orange) comparisons. d GO analysis of downregulated DEGs for the FL-WT vs. GC-WT (upper rows) and FL-KO vs. GC-KO (lower rows) comparisons. GO terms related to erythropoiesis are marked with a pink background. The number of genes and the adjusted p values are shown. e Heatmap of the relative expression of erythroid-related genes downregulated in comparisons of FL-WT vs. GC-WT (left two columns) and FL-KO vs. GC-KO (right two columns). The mean value obtained for each gene in GC-WT mice was set to one. Downregulated DEGs in both the FL-WT vs. GC-WT and FL-KO vs. GC-KO comparisons are coloured blue. f, g Dot plot of the expression of representative erythroid-related genes. Dots represent individual animals. Means are shown in the plots. *p < 0.05.
Fig. 9
Fig. 9. RNA-seq analysis of bone marrow samples focusing on the comparison between WT and Nrf2-KO mice.
a Venn diagram of three sets of downregulated DEGs from the GC-KO vs. GC-WT (pink), FL-KO vs. FL-WT (blue) and FL-WT vs. GC-WT (green) comparisons. The numbers of genes in each section are shown. The green number represents the number of overlapping DEGs among all three comparisons. The number of downregulated genes in the FL-WT vs. GC-WT comparison that overlap with those in the GC-KO vs. GC-WT (pink) and FL-KO vs. FL-WT (blue) comparisons, excluding DEGs in the triple overlapping region, are indicated by red and blue, respectively. b GO analysis of downregulated DEGs from the GC-KO vs. GC-WT (upper rows) and FL-KO vs. FL-WT (lower rows) comparisons. The number of genes and the adjusted p values are shown. c Heatmap of the relative expression of 105 genes categorised as “immune system process” among the downregulated DEGs from the GC-KO vs. GC-WT comparison. d Overlapping downregulated DEGs with adjusted P values for the FL-WT vs. GC-WT, GC-KO vs. GC-WT, and FL-KO vs. FL-WT comparisons. Red, blue and green correspond to the genes in (a). Daggers indicate genes encoding immunoglobulin, and double daggers indicate genes encoding factors related to immune system processes. e Dot plot of the expression levels of the Back2 and Rag1 genes. Dots represent individual animals. Means are shown in the plots. *p < 0.05.
Fig. 10
Fig. 10. Changes in the expression of Nrf2 target genes.
a, b Heatmap of the relative expression of Nrf2 target genes in the bone marrow (a) and spleen (b) from GC-WT, FL-WT, GC-KO and FL-KO mice. The mean value of each gene in GC-WT mice was set to one in each panel. c Dot plot of the expression of the Gclm, Gclc, Nqo1 and Srxn1 genes in the bone marrow. Dots represent individual animals. Means are shown in the plots. *p < 0.05. d Box-and-dot plots of the expression of Sclm, Gclc, Nqo1 and Smarca4 genes in the bone marrows. One-sided Wilcoxon rank sum tests were performed to evaluate the differences between Nrf2-KO and control WT mice in the ground (left part in each panel) and spaceflight (right part) conditions. *P < 0.05.

References

    1. Shavers MR, et al. Implementation of ALARA radiation protection on the ISS through polyethylene shielding augmentation of the Service Module Crew Quarters. Adv. Space Res. 2004;34:1333–1337. - PubMed
    1. Tharmalingam S, Sreetharan S, Kulesza AV, Boreham DR, Tai TC. Low-dose ionizing radiation exposure, oxidative stress and epigenetic programing of health and disease. Radiat. Res. 2017;188:525–538. - PubMed
    1. Rodrigues-Moreira S, et al. Low-dose irradiation promotes persistent oxidative stress and decreases self-renewal in hematopoietic stem cells. Cell Rep. 2017;20:3199–3211. - PubMed
    1. Kawamura K, Qi F, Kobayashi J. Potential relationship between the biological effects of low-dose irradiation and mitochondrial ROS production. J. Radiat. Res. 2018;59:ii91–ii97. - PMC - PubMed
    1. Sies H, et al. Defining roles of specific reactive oxygen species (ROS) in cell biology and physiology. Nat. Rev. Mol. Cell Biol. 2022;23:499–515. - PubMed

Publication types

Substances