. 2023 Aug 25;18(1):50.
doi: 10.1186/s13062-023-00407-4.

Discovery biomarker to optimize obeticholic acid treatment for non-alcoholic fatty liver disease

Affiliations

Discovery biomarker to optimize obeticholic acid treatment for non-alcoholic fatty liver disease

Seung Min Lee et al. Biol Direct. .

Abstract

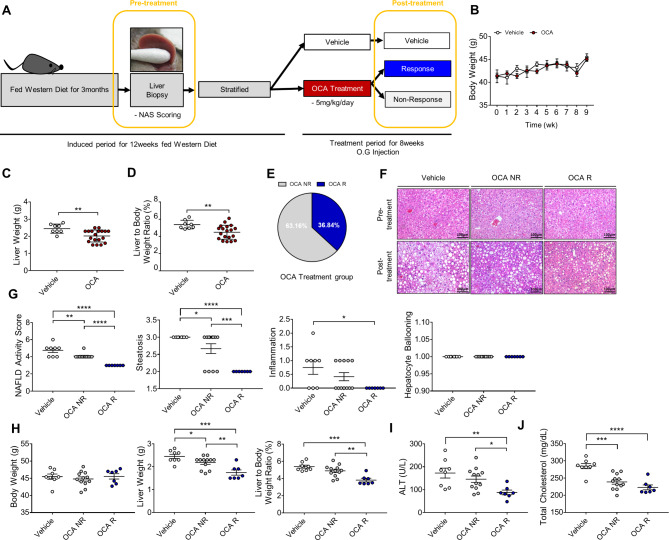
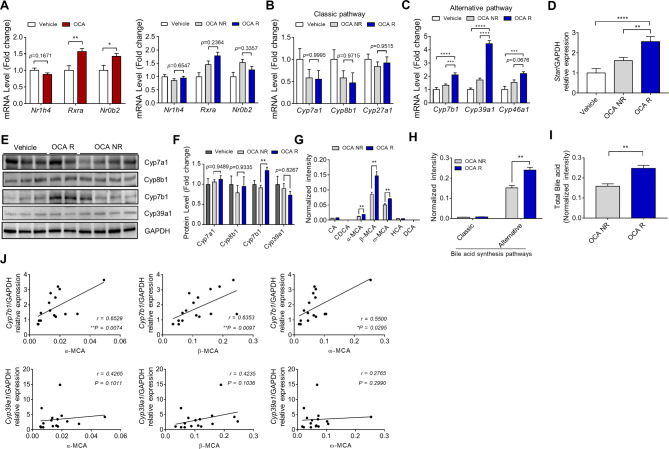
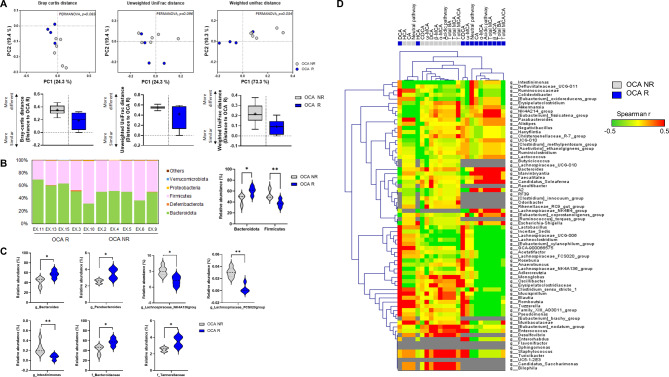
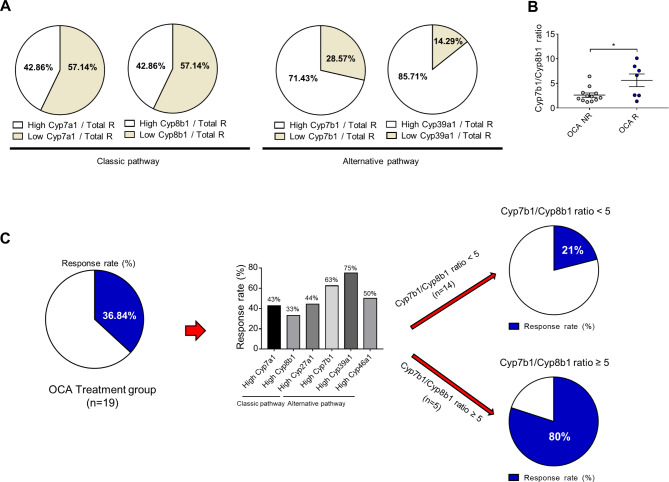
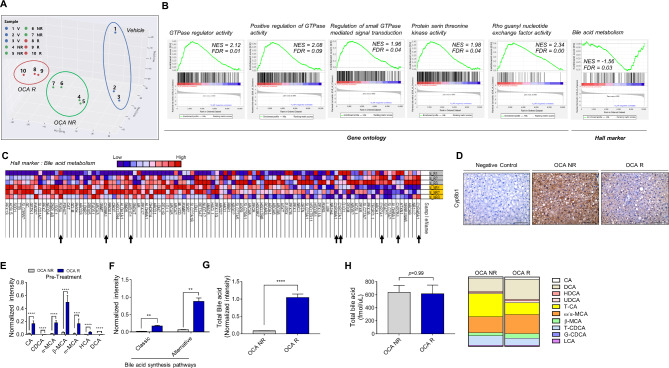
The response rate to obeticholic acid (OCA), a potential therapeutic agent for non-alcoholic fatty liver disease, is limited. This study demonstrated that upregulation of the alternative bile acid synthesis pathway increases the OCA treatment response rate. The hepatic transcriptome and bile acid metabolite profile analyses revealed that the alternative bile acid synthesis pathway (Cyp7b1 and muricholic acid) in the OCA-responder group were upregulated compared with those in the OCA-non-responder group. Intestinal microbiome analysis also revealed that the abundances of Bacteroidaceae, Parabacteroides, and Bacteroides, which were positively correlated with the alternative bile acid synthesis pathway, were higher in the OCA-responder group than in the non-responder group. Pre-study hepatic mRNA levels of Cyp8b1 (classic pathway) were downregulated in the OCA-responder group. The OCA response rate increased up to 80% in cases with a hepatic Cyp7b1/Cyp8b1 ratio ≥ 5.0. Therefore, the OCA therapeutic response can be evaluated based on the Cyp7b1/Cyp8b1 ratio or the alternative/classic bile acid synthesis pathway activity.

Keywords: Alternative pathway; Bile acid; Biomarker; Microbiome; Non-alcoholic fatty liver; Obeticholic acid.


Conflict of interest statement

Dae Won Jun, Seung Min Lee have filed a patent application on the basis of this work.

Figures

Fig. 1
Fig. 1
Obeticholic acid (OCA) response rates and characteristics of responder and non-responder in the non-alcoholic fatty liver disease (NAFLD) mouse model. (A) Schematic diagram of the study plan. (B) Average bodyweight of mice in the vehicle (n = 8) and OCA-treated groups (n = 19) during drug administration. (C) Liver weight and (D) liver-to-bodyweight ratio (%) of the NAFLD mouse model. Data are presented as mean ± standard error of mean. **p < 0.01 (Unpaired t-test). (E) Response rate in the OCA-treated group. (F) Hematoxylin and eosin staining of liver tissues at pre- and post-treatment. Scale bars, 100 μm. (G) Post-treatment NAFLD activity score. (H) Post-treatment bodyweight, liver weight, and liver-to-body weight ratio (%) of mice in the vehicle (n = 8), non-responder (n = 12), and responder (n = 7) groups. (I) Serum levels of alanine aminotransferase and (J) total cholesterol. Data are presented as mean ± standard error of mean. *p < 0.05, **p < 0.01, ***p < 0.001, and ****p < 0.0001 (one-way analysis of variance)
Fig. 2
Fig. 2
Comparative analysis of hepatic levels of obeticholic acid (OCA) target gene expression and bile acid composition in the responder and non-responder groups after treatment. (A) Comparative analysis of the hepatic levels of OCA target gene expression levels in the vehicle and OCA groups. Data are presented as mean ± standard error of mean. *p < 0.05, **p < 0.01, ***p < 0.001, and ****p < 0.0001 (Unpaired t-test and one-way analysis of variance). The expression levels of genes involved in the (B) classical and (C) alternative pathways of bile acid synthesis. (D) Comparative analysis of hepatic Star mRNA levels. Data are mean ± standard error of mean. **p < 0.01, ***p < 0.001, and ****p < 0.0001 (one-way analysis of variance). (E) Immunoblotting and (F) quantification of hepatic protein levels of Cyp7a1, Cyp8b1, Cyp7b1, and Cyp39a1 (vehicle (n = 8), non-responder (n = 11) and responder (n = 7)). Data are presented as mean ± standard error of mean. **p < 0.01 (one-way analysis of variance). (G, H, and I) Analysis of bile acid composition in the mouse liver tissue. Data are presented as mean ± standard error of mean. **p < 0.01 (Mann-Whitney U test). (J) Correlation between Cyp39a1 and Cyp7b1 mRNA levels and muricholic acids (MCAs). Correlation was analyzed using the nonparametric Spearman’s correlation coefficient. Differences were considered significant at p < 0.05
Fig. 3
Fig. 3
Comparison of microbiome structure between the responder and non-responder groups after treatment. (A) Principal-coordinate analysis of gut microbiota based on the Bray-Curtis, unweighted UniFrac, and weighted UniFrac distance. Significant P-values of PERMANOVA between groups emphasize the differences in microbial community structure. Grey and blue circles represent non-responders and responders, respectively. Box plots represent the median, lower and upper quartiles of the Bray-Curtis, unweighted UniFrac, and weighted UniFrac distances at each group comparing the effect of responsiveness of treatment on the community structure. Whiskers were calculated using the Tukey method. A lower distance indicates greater similarity compared to responders’ microbial communities. (B) Bar plots represent the relative abundances of phyla in responder (n = 4) and non-responder group (n = 6). Violin plots reporting the relative abundances of differentially abundant bacterial phyla between responder and non-responder group. Data are presented mean ± standard deviation. *p < 0.05 and **p < 0.01 (Mann-Whitney U test). (C) Violin plots reporting the relative abundances of differentially abundant bacterial genera between responders and non-responder group. Data are presented mean ± standard deviation. *p < 0.05 and **p < 0.01 (Mann-Whitney U test). (D) The heat map shows hierarchical clustering (Unweighted Pair Group Method with Arithmetic Mean, UPGMA method) of Spearman correlation coefficients between relative abundances of bacterial genera and metabolites in non-responders and responders samples using Euclidean distance. Positive and negative correlations are indicated by red and green colors, respectively, as shown in the color key. Missing values are indicated by grey spots
Fig. 4
Fig. 4
Responder classification based on the Cyp7b1/Cyp8b1 ratio. (A) The expression of bile acid-associated cytochrome P450 genes in the responder group relative to that in the OCA-treated mouse liver tissue. (B) Responder and non-responder classification according to the Cyp7b1/Cyp8b1 ratio. Data are presented as mean ± standard error of mean. *p < 0.05 (Unpaired t-test). (C) Ratio of responder mice among the OCA-treated mice overexpressing cytochrome P450 genes and the response rate according to the Cyp7b1/Cyp8b1 ratio
Fig. 5
Fig. 5
Multi-omics analysis of liver samples from the responder and non-responder groups before treatment. (A) Principal coordinate analysis plot and (B) gene set enrichment analysis (GSEA) results of the liver tissue transcriptome. (C) Heatmap of bile acid metabolism from GSEA. The hepatic levels of (D) Cyp8b1 (E, F, G) bile acids, and total bile acids. (H) Total bile acid and bile acid composition in the serum according to the response to OCA. Data are presented as mean ± standard error of mean. *p < 0.05, **p < 0.01, ***p < 0.001, and ****p < 0.0001 (Mann-Whitney U test) CA, cholic acid; CDCA, chenodeoxycholic acid; MCA, muricholic acid; HCA, hyocholic acid; DCA, deoxycholic acid; T-CA, taurocholic acid; LCA, lithocholic acid; T-CDCA, tauro chenodeoxycholic acid; G-CDCA, glycochenodeoxycholic acid; NES, normalized enrichment score; FDR, false discovery rate
Fig. 6
Fig. 6
Effect of OCA on the LX-2 cells transfected with short-interfering RNA (siRNA) againstCYP7B1(si-CYP7B1) and glucose on the expression levels of cytochrome P450 family genes related to bile acid synthesis. (A) Wound healing assay using TGFβ1 and OCA in scramble and si-CYP7B1-transfected LX-2 cells. (B) A wound was introduced in the monolayer of scramble and si-CYP7B1-transfected cells. Wound healing was measured after 24 h. (C) Evaluation of fibrosis-related marker proteins. Comparative analysis of CYP7A1, CYP8B1, and CYP7B1 mRNA levels according to (D) glucose concentrations in HepG2 cells. (E) RORA and NR1H3 mRNA levels according to glucose concentration. Comparative analysis of CYP7A1, CYP8B1, and CYP7B1 mRNA levels according to (F) insulin concentrations in HepG2 cells. Data are shown in bar diagrams as mean ± standard error of mean from three independent experiments. *p < 0.05, **p < 0.01, ***p < 0.001, and ****p < 0.0001 (one-way analysis of variance). Scale bars, 200 μm

Similar articles

Cited by

References

    1. Park J, et al. NASH/Liver Fibrosis Prevalence and incidence of Nonliver Comorbidities among people with NAFLD and incidence of NAFLD by Metabolic Comorbidities: Lessons from South Korea. Dig Dis. 2021 doi: 10.1159/000514953. - DOI - PMC - PubMed
    1. Ludwig J, Viggiano TR, Mcgill DB, Oh B. in Mayo Clinic proceedings 434–438. - PubMed
    1. Bedossa P. Pathology of non-alcoholic fatty liver disease. Liver international: official journal of the International Association for the Study of the Liver. 2017;37(1):85–9. doi: 10.1111/liv.13301. - DOI - PubMed
    1. Gottlieb A, Canbay A. Why bile acids are so important in non-alcoholic fatty liver disease (NAFLD) progression. Cells. 2019;8:1358. doi: 10.3390/cells8111358. - DOI - PMC - PubMed
    1. Matteoni CA et al. Nonalcoholic fatty liver disease: a spectrum of clinical and pathological severity. 116, 1413–9 (1999). - PubMed

Publication types