

Single-cell resolution analysis reveals the preparation for reprogramming the fate of stem cell niche in cotton lateral meristem
- PMID: 37626404
- PMCID: PMC10463415
- DOI: 10.1186/s13059-023-03032-6
Single-cell resolution analysis reveals the preparation for reprogramming the fate of stem cell niche in cotton lateral meristem
Erratum in
-
Author Correction: Single-cell resolution analysis reveals the preparation for reprogramming the fate of stem cell niche in cotton lateral meristem.Genome Biol. 2023 Sep 18;24(1):210. doi: 10.1186/s13059-023-03051-3. Genome Biol. 2023. PMID: 37723584 Free PMC article. No abstract available.
Abstract
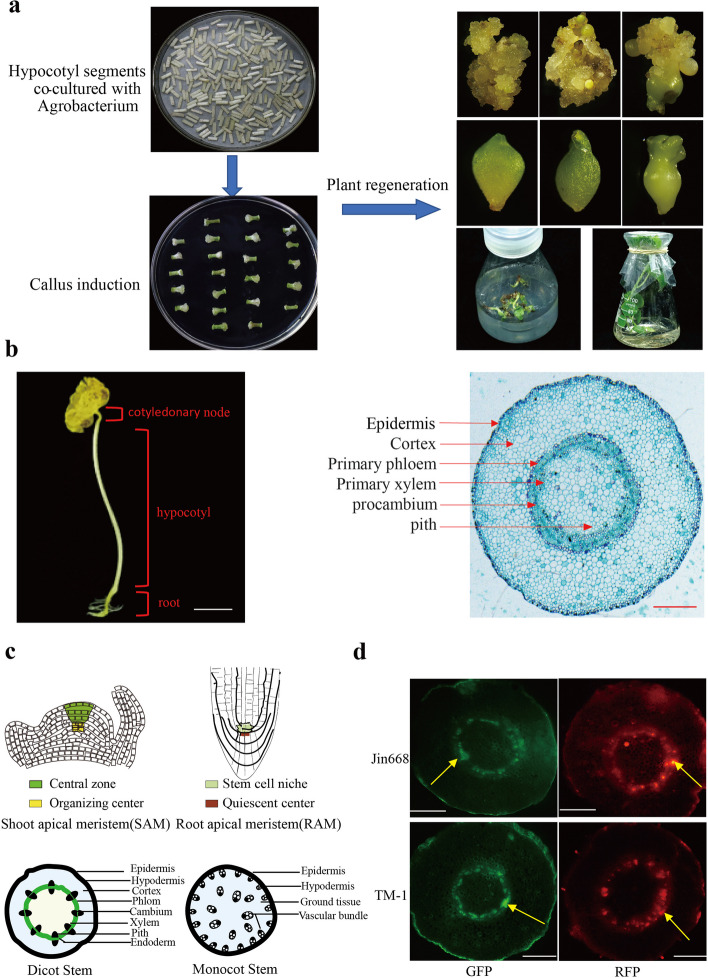
Background: Somatic embryogenesis is a major process for plant regeneration. However, cell communication and the gene regulatory network responsible for cell reprogramming during somatic embryogenesis are still largely unclear. Recent advances in single-cell technologies enable us to explore the mechanism of plant regeneration at single-cell resolution.
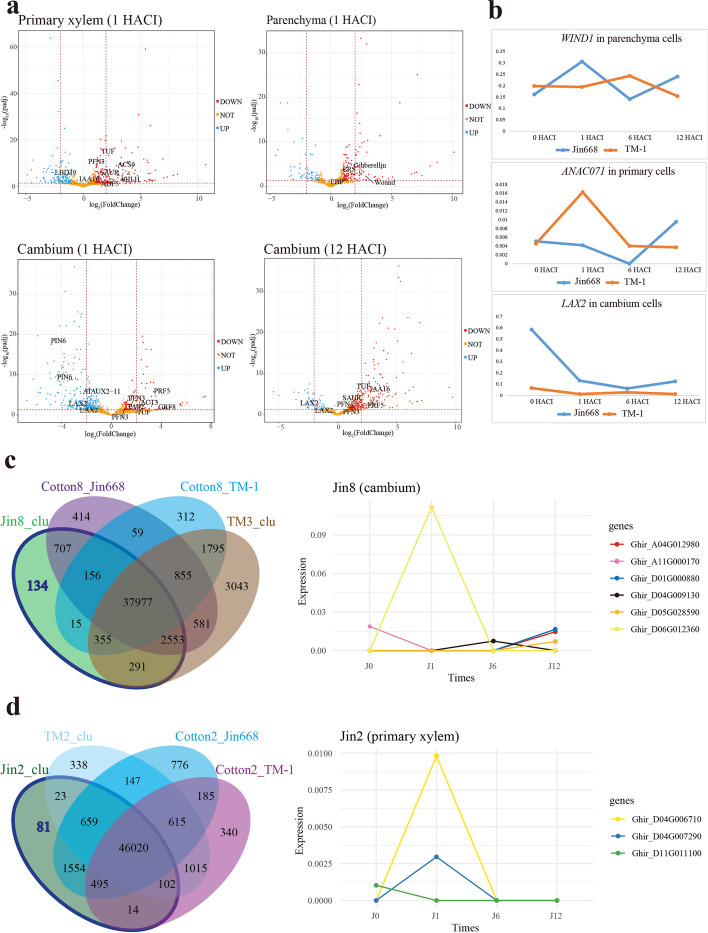
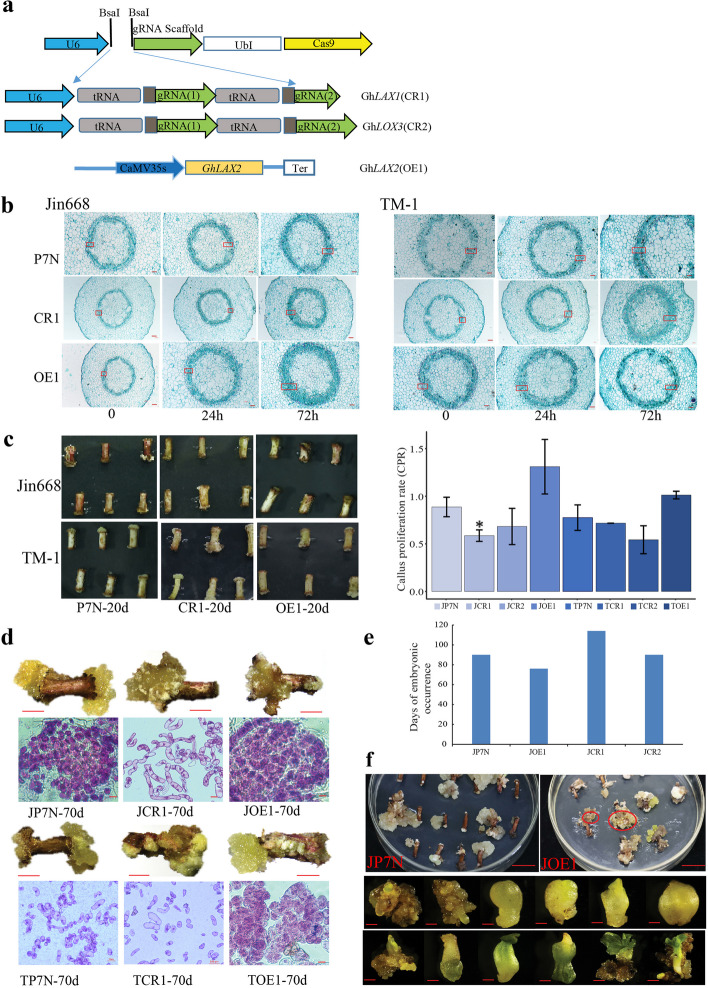
Results: We generate a high-resolution single-cell transcriptomic landscape of hypocotyl tissue from the highly regenerable cotton genotype Jin668 and the recalcitrant TM-1. We identify nine putative cell clusters and 23 cluster-specific marker genes for both cultivars. We find that the primary vascular cell is the major cell type that undergoes cell fate transition in response to external stimulation. Further developmental trajectory and gene regulatory network analysis of these cell clusters reveals that a total of 41 hormone response-related genes, including LAX2, LAX1, and LOX3, exhibit different expression patterns in the primary xylem and cambium region of Jin668 and TM-1. We also identify novel genes, including CSEF, PIS1, AFB2, ATHB2, PLC2, and PLT3, that are involved in regeneration. We demonstrate that LAX2, LAX1 and LOX3 play important roles in callus proliferation and plant regeneration by CRISPR/Cas9 editing and overexpression assay.
Conclusions: This study provides novel insights on the role of the regulatory network in cell fate transition and reprogramming during plant regeneration driven by somatic embryogenesis.
Keywords: Cotton; Gene functional verification; Gene regulatory network; Plant regeneration; scRNA-seq.
© 2023. BioMed Central Ltd., part of Springer Nature.
Conflict of interest statement
The authors declare that they have no competing interests.
Figures


Similar articles
-
Transcriptomic profiles of non-embryogenic and embryogenic callus cells in a highly regenerative upland cotton line (Gossypium hirsutum L.).BMC Dev Biol. 2020 Dec 2;20(1):25. doi: 10.1186/s12861-020-00230-4. BMC Dev Biol. 2020. PMID: 33267776 Free PMC article.
-
Multi-omics analyses reveal epigenomics basis for cotton somatic embryogenesis through successive regeneration acclimation process.Plant Biotechnol J. 2019 Feb;17(2):435-450. doi: 10.1111/pbi.12988. Epub 2018 Sep 30. Plant Biotechnol J. 2019. PMID: 29999579 Free PMC article.
-
Comparative Transcriptomics of Non-Embryogenic and Embryogenic Callus in Semi-Recalcitrant and Non-Recalcitrant Upland Cotton Lines.Plants (Basel). 2021 Aug 26;10(9):1775. doi: 10.3390/plants10091775. Plants (Basel). 2021. PMID: 34579308 Free PMC article.
-
Analysis of meristems and plant regeneration at single-cell resolution.Curr Opin Plant Biol. 2023 Aug;74:102378. doi: 10.1016/j.pbi.2023.102378. Epub 2023 May 10. Curr Opin Plant Biol. 2023. PMID: 37172363 Review.
-
Stem cell function during plant vascular development.EMBO J. 2013 Jan 23;32(2):178-93. doi: 10.1038/emboj.2012.301. Epub 2012 Nov 20. EMBO J. 2013. PMID: 23169537 Free PMC article. Review.
Cited by
-
The 4Fs of cotton: genome editing of cotton for fiber, food, feed, and fuel to achieve zero hunger.Front Genome Ed. 2024 Sep 12;6:1401088. doi: 10.3389/fgeed.2024.1401088. eCollection 2024. Front Genome Ed. 2024. PMID: 39328243 Free PMC article. Review.
-
Breeding triple-advantage cottonseed with higher yield, enhanced nutrition, and reduced toxicity by redirecting terpenoid metabolism to astaxanthin.Plant Biotechnol J. 2025 Jul;23(7):2839-2851. doi: 10.1111/pbi.70116. Epub 2025 Apr 29. Plant Biotechnol J. 2025. PMID: 40299793 Free PMC article.
-
Advances in the Application of Single-Cell Transcriptomics in Plant Systems and Synthetic Biology.Biodes Res. 2024 Feb 29;6:0029. doi: 10.34133/bdr.0029. eCollection 2024. Biodes Res. 2024. PMID: 38435807 Free PMC article. Review.
-
Global landscape of protein phosphorylation during plant regeneration initiation in cotton (Gossypium hirsutum L.).BMC Biol. 2025 Apr 30;23(1):116. doi: 10.1186/s12915-025-02218-7. BMC Biol. 2025. PMID: 40307803 Free PMC article.
-
Single-Cell Transcriptomics Applied in Plants.Cells. 2024 Sep 17;13(18):1561. doi: 10.3390/cells13181561. Cells. 2024. PMID: 39329745 Free PMC article. Review.
References
-
- Elhiti M, Stasolla C, Wang A. Molecular regulation of plant somatic embryogenesis. In Vitro Cell Dev Biol Plant. 2013;49:631–642.
-
- Steward FC, Mears MK. Growth and organized development of cultured cells. II. Organization in cultures grown from freely suspended cells. Am J Bot. 1958;45:705–708.
-
- Trolinder NL, Xhixian C. Genotype specificity of the somatic embryogenesis response in cotton. Plant Cell Rep. 1989;8:133–136. - PubMed
-
- Davidonis GH, Hamilton RH. Plant regeneration from callus tissue of Gossypium hirsutum L. Plant Sci Lett. 1983;32:89–93.
-
- Xu L, Huang H. Genetic and epigenetic controls of plant regeneration. Curr Top Dev Biol. 2014;108:1–33. - PubMed
Publication types
MeSH terms
LinkOut - more resources
Full Text Sources
Miscellaneous
