. 2023 Aug 4;13(8):1166.
doi: 10.3390/brainsci13081166.

Lipid Metabolism Disorder in Cerebrospinal Fluid Related to Parkinson's Disease

Affiliations

Lipid Metabolism Disorder in Cerebrospinal Fluid Related to Parkinson's Disease

Jiewen Qiu et al. Brain Sci. .

Abstract

Background: Abnormal accumulation of lipids is found in dopamine neurons and resident microglia in the substantia nigra of patients with Parkinson's disease (PD). The accumulation of lipids is an important risk factor for PD. Previous studies have mainly focussed on lipid metabolism in peripheral blood, but little attention has been given to cerebrospinal fluid (CSF). We drew the lipidomic signature in CSF from PD patients and evaluated the role of lipids in CSF as biomarkers for PD diagnosis.

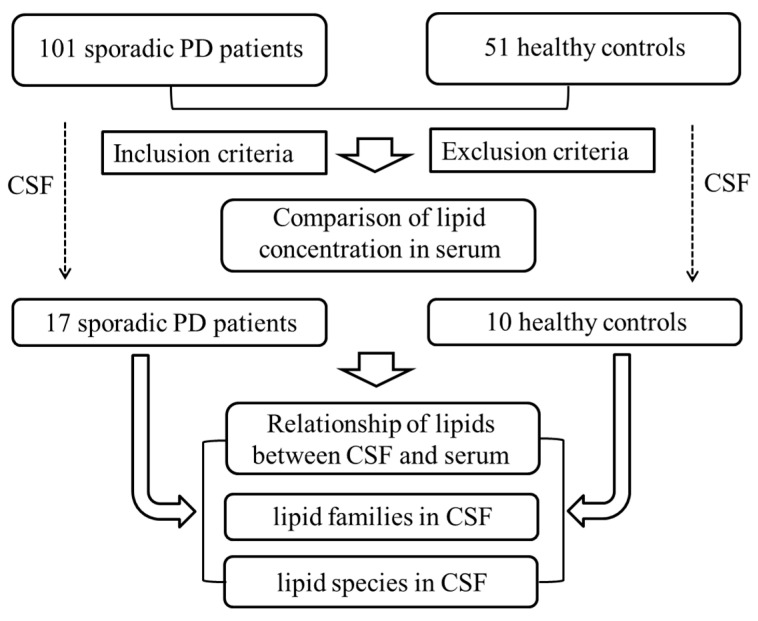
Methods: Based on lipidomic approaches, we investigated and compared lipid metabolism in CSF from PD patients and healthy controls without dyslipidaemia in peripheral blood and explored the relationship of lipids between CSF and serum by Pearson correlation analysis.

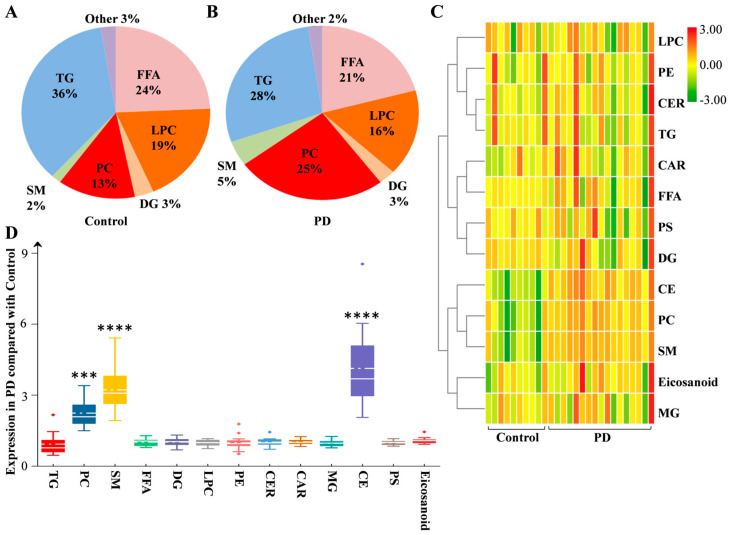
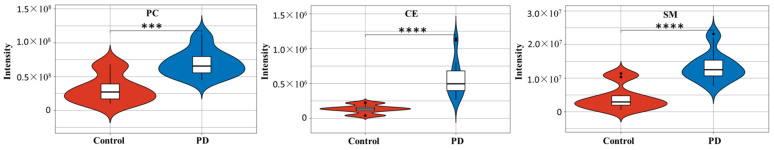
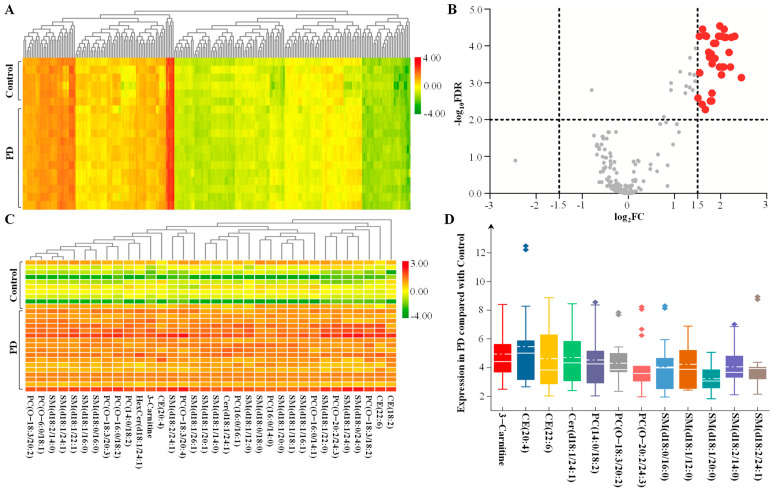
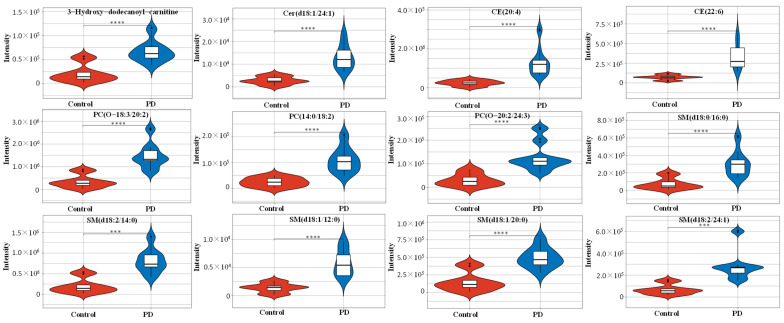
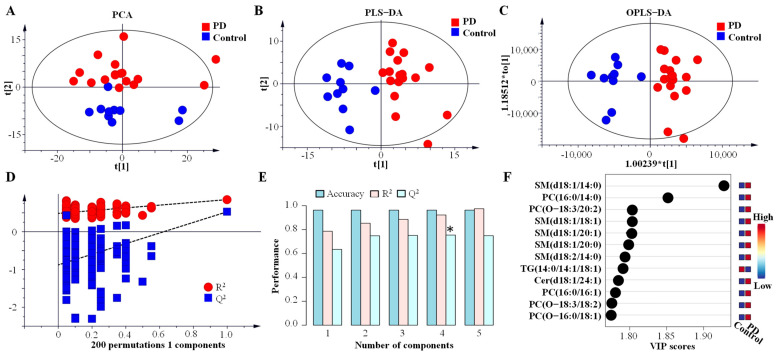
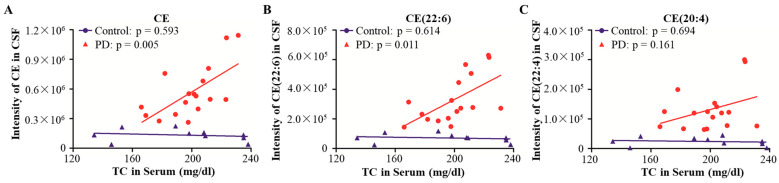
Results: A total of 231 lipid species were detected and classified into 13 families in the CSF. The lipid families, including phosphatidylcholine (PC), sphingomyelin (SM) and cholesterol ester (CE), had significantly increased expression compared with the control. Hierarchical clustering was performed to distinguish PD patients based on the significantly changed expression of 34 lipid species. Unsupervised and supervised methods were used to refine this classification. A total of 12 lipid species, including 3-hydroxy-dodecanoyl-carnitine, Cer(d18:1/24:1), CE(20:4), CE(22:6), PC(14:0/18:2), PC(O-18:3/20:2), PC(O-20:2/24:3), SM(d18:0/16:0), SM(d18:2/14:0), SM(d18:2/24:1), SM(d18:1/20:1) and SM(d18:1/12:0), were selected to draw the lipidomic signature of PD. Correlation analysis was performed and showed that the CE family and CE (22:6) in CSF had a positive association with total cholesterol in the peripheral blood from PD patients but not from healthy controls.

Conclusions: Our results revealed that the lipidomic signature in CSF may be considered a potential biomarker for PD diagnosis, and increased CE, PC and SM in CSF may reveal pathological changes in PD patients, such as blood-brain barrier leakage.

Keywords: Parkinson’s disease; biomarker; cerebrospinal fluid; lipid metabolism.


Conflict of interest statement

The authors declare no conflict of interest.

Figures

Figure 1
Figure 1
Flow chart of lipids identification strategy. Abbreviations: PD, Parkinson’s disease; CSF, cerebrospinal fluid.
Figure 2
Figure 2
Lipid families from CSF in PD. The detected lipid species were classified into 13 families. According to the expression, the proportions of each lipid family in the control (A) and PD (B) groups are listed. (C) Heatmap representing all 13 lipid families obtained by UPLC–MS/MS. (D) The fold changes in the expression of lipid families between the PD and control groups are shown as box plots. Differences were determined by Student’s t test, with *** p < 0.001, **** p < 0.0001 by the Mann–Whitney test. The solid line in the box represents the mean lipid expression, and the dotted horizontal line represents the median lipid expression. Abbreviations: PD, Parkinson’s disease; TG, triglyceride; PC, phosphatidylcholine; SM, sphingomyelin; FFA, free fatty acid; DG, diglyceride; LPC, lysophosphatidylcholine; PE, phosphatidylethanolamine; CER, ceramide; CAR, 3-hydroxy-dodecanoyl-carnitine; MG, monoglyceride; CE, cholesterol ester; PS, phosphatidylserine.
Figure 3
Figure 3
Characteristic lipid families from CSF in PD. Violin plot showing the expression and distribution of lipid families in the PD and control groups. Differences were determined by Student’s t test. Mean ± SD are shown, with *** p < 0.001, **** p < 0.0001 by the Mann–Whitney test. Abbreviations: PD, Parkinson’s disease; PC, phosphatidylcholine; SM, sphingomyelin; CE, cholesterol ester.
Figure 4
Figure 4
Lipid signature from CSF in PD. (A) Heatmap representing all 231 lipid species obtained by UPLC–MS/MS. (B) The volcano plot of the differential lipid species in the PD group compared with the control group. The red spots represent upregulated lipids that met −log10(FDR) > 2 and log2FC > 1.5, and grey dots represent insignificant differences. (C) The lipids with −log10(FDR) > 2 and log2FC > 1.5 were used to draw the characteristic lipidomic signature in the heatmap. (D) The fold change in the expression of lipids with log2FC > 2 is shown as a box plot. The solid line in the box represents the mean lipid expression, and the dotted horizontal line represents the median lipid expression. Abbreviations: PD, Parkinson’s disease; FC, fold change; FDR, false discovery rate; PC, phosphatidylcholine; SM, sphingomyelin; CER, ceramide; CE, cholesterol ester.
Figure 5
Figure 5
Characteristic lipid species from CSF in PD. Violin plot showing the expression and distribution of lipid species with −log10(FDR) > 2 and log2FC > 2. Differences were determined by Student’s t test. Means ± SDs are shown, with *** p < 0.001, **** p < 0.0001 by the Mann–Whitney test. Abbreviations: PD, Parkinson’s disease; PC, phosphatidylcholine; SM, sphingomyelin; CER, ceramide; CE, cholesterol ester.
Figure 6
Figure 6
Multivariate statistics on lipidomic signature from CSF in PD. (A) Nonsupervised analysis by PCA. (B) Supervised analysis by PLS–DA. (C) Supervised analysis by OPLS–DA. (D) The permutation test of the OPLS–DA model. (E) Cross validation values of PLS–DA model, * p < 0.05 represent significant differences. (F) VIP score plot and identified lipid species with the top twelve values. Abbreviations: PD, Parkinson’s disease; PCA, principal component analysis; PLS–DA, orthogonal partial least-squares discriminant analysis; OPLS–DA, orthogonal partial least squares discriminate analysis; VIP, variable importance in projection; PC, phosphatidylcholine; SM, sphingomyelin; TG, triglyceride; CER, ceramide.
Figure 7
Figure 7
Correlation analysis between CE in CSF and TC in peripheral blood. The correlations between CE (A), CE (22:6) (B) and CE (20:4) (C) in CSF and TC in peripheral blood were analysed in the PD and control groups by Pearson correlation analysis. Abbreviations: PD, Parkinson’s disease; CE, cholesterol ester; TC, total cholesterol.

References

    1. Kouli A., Torsney K.M., Kuan W.-L. Parkinson’s Disease: Etiology, Neuropathology, and Pathogenesis. Exon Publications; Brisbane City, Australia: 2018. pp. 3–26.
    1. Alecu I., Bennett S. Dysregulated Lipid Metabolism and Its Role in α-Synucleinopathy in Parkinson’s Disease. Front. Neuroence. 2019;13:328. doi: 10.3389/fnins.2019.00328. - DOI - PMC - PubMed
    1. Wallom K.-L., Fernández-Suárez M.E., Priestman D.A., Te Vruchte D., Huebecker M., Hallett P.J., Isacson O., Platt F.M. Glycosphingolipid metabolism and its role in ageing and Parkinson’s disease. Glycoconj. J. 2021;39:39–53. doi: 10.1007/s10719-021-10023-x. - DOI - PMC - PubMed
    1. Gilmozzi V., Gentile G., Castelo Rueda M.P., Hicks A.A., Pramstaller P.P., Zanon A., Lévesque M., Pichler I. Interaction of alpha-synuclein with lipids: Mitochondrial cardiolipin as a critical player in the pathogenesis of Parkinson’s disease. Front. Neurosci. 2020;14:1051. doi: 10.3389/fnins.2020.578993. - DOI - PMC - PubMed
    1. Gan-Or Z., Liong C., Alcalay R.N. GBA-associated Parkinson’s disease and other synucleinopathies. Curr. Neurol. Neurosci. Rep. 2018;18:44. doi: 10.1007/s11910-018-0860-4. - DOI - PubMed

LinkOut - more resources