. 2023 Aug 9;13(8):1179.
doi: 10.3390/brainsci13081179.

Preliminary Observations of Personalized Repetitive Magnetic Stimulation (PrTMS) Guided by EEG Spectra for Concussion

Affiliations

Preliminary Observations of Personalized Repetitive Magnetic Stimulation (PrTMS) Guided by EEG Spectra for Concussion

Milan T Makale et al. Brain Sci. .

Abstract

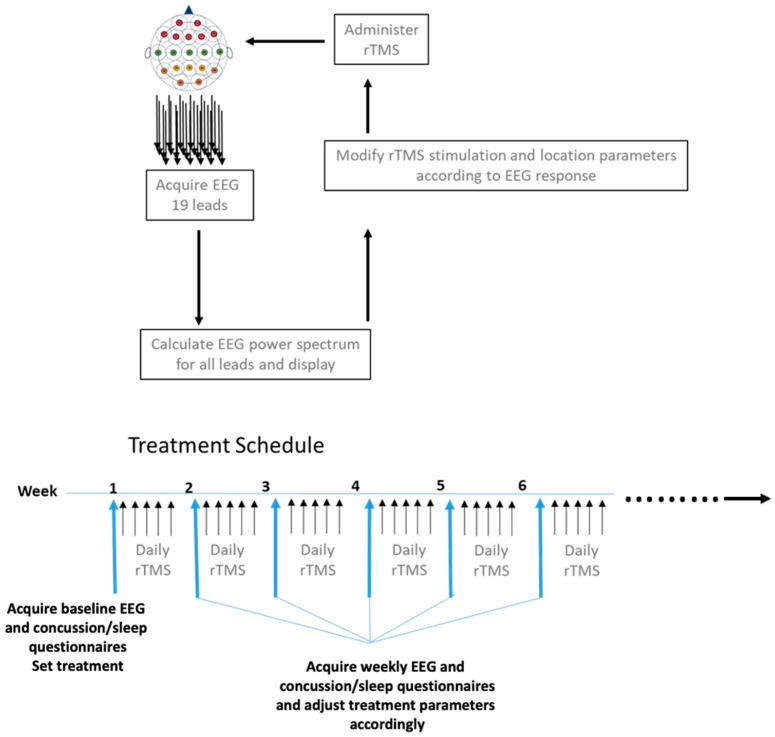
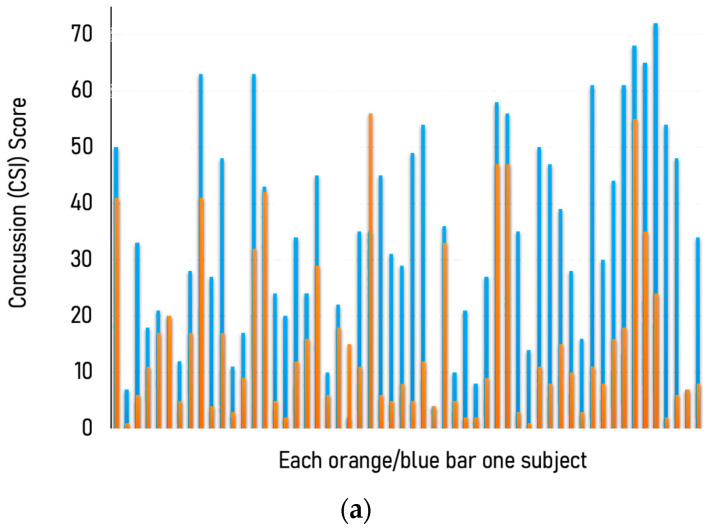
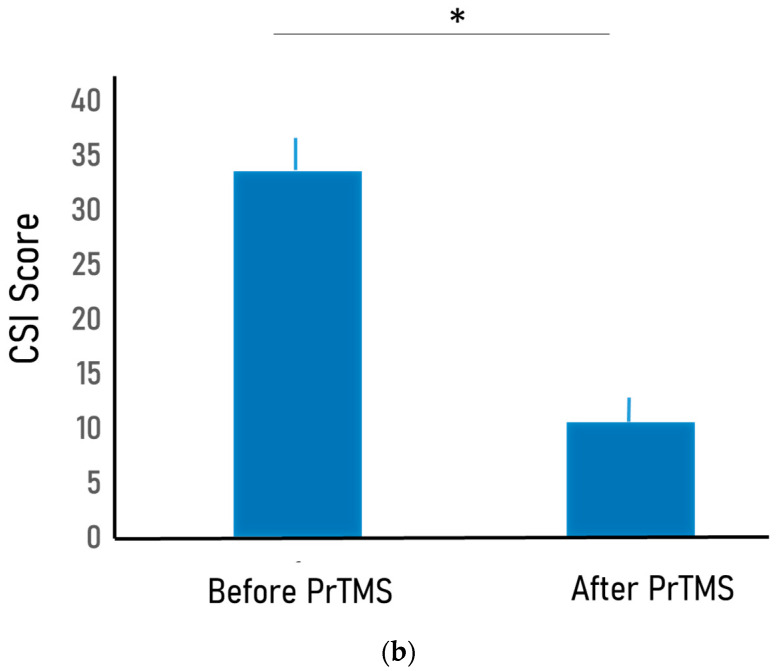
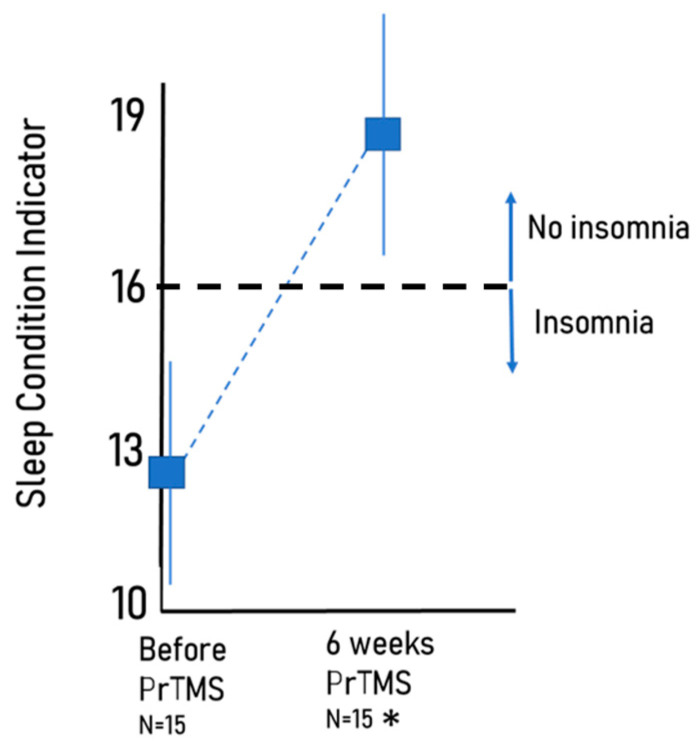
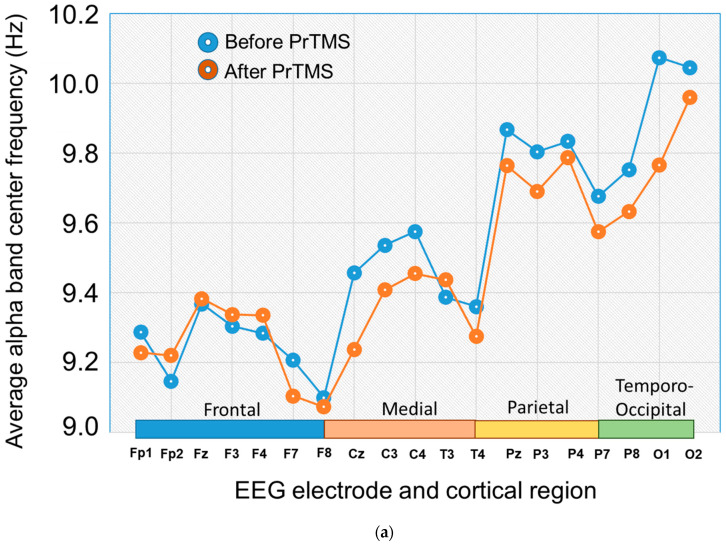
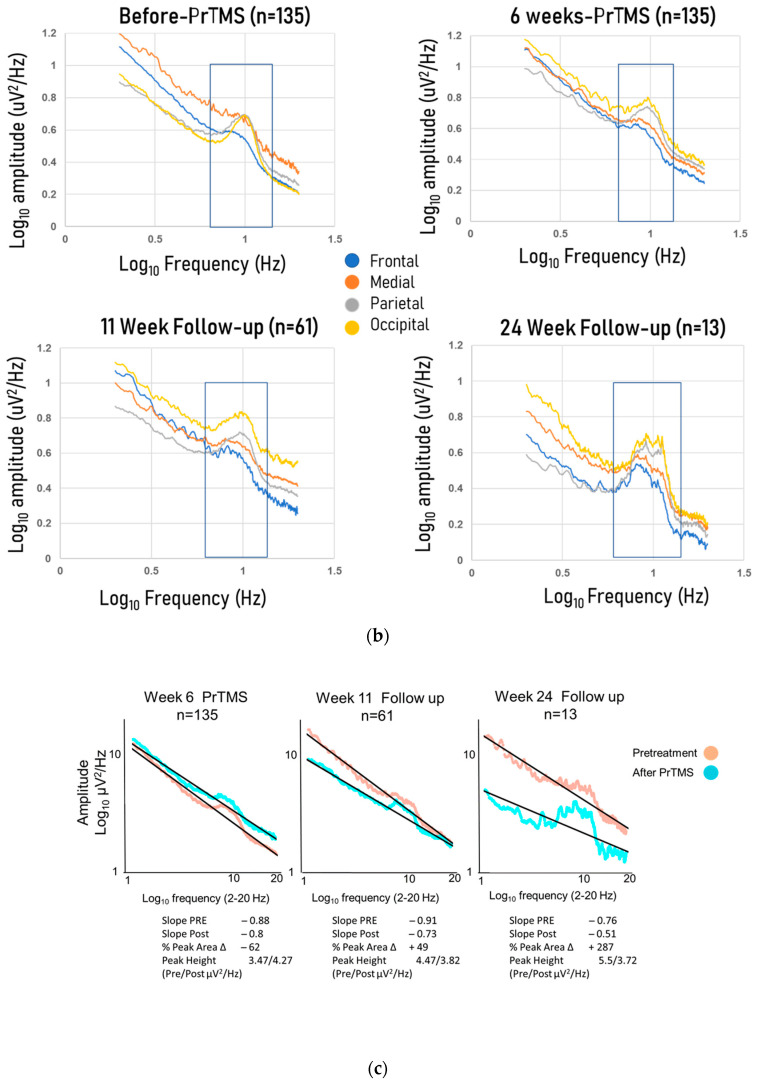
There are no FDA-approved treatments for the chronic sequelae of concussion. Repetitive magnetic transcranial stimulation (rTMS) has been explored as a therapy but outcomes have been inconsistent. To address this we developed a personalized rTMS (PrTMS) protocol involving continual rTMS stimulus frequency adjustment and progressive activation of multiple cortical sites, guided by spectral electroencephalogram (EEG)-based analyses and psychological questionnaires. We acquired pilot clinical data for 185 symptomatic brain concussion patients who underwent the PrTMS protocol over an approximate 6 week period. The PrTMS protocol used a proprietary EEG spectral frequency algorithm to define an initial stimulation frequency based on an anteriorly graded projection of the measured occipital alpha center peak, which was then used to interpolate and adjust regional stimulation frequency according to weekly EEG spectral acquisitions. PrTMS improved concussion indices and normalized the cortical alpha band center frequency and peak EEG amplitude. This potentially reflected changed neurotransmitter, cognitive, and perceptual status. PrTMS may be a promising treatment choice for patients with persistent concussion symptoms. This clinical observational study was limited in that there was no control group and a number of variables were not recorded, such as time since injury and levels of depression. While the present observations are indeed preliminary and cursory, they may suggest further prospective research on PrTMS in concussion, and exploration of the spectral EEG as a concussion biomarker, with the ultimate goals of confirmation and determining optimal PrTMS treatment parameters.

Keywords: Rivermead Post Concussion Symptoms Questionnaire (RPQ); concussion; electroencephalogram (EEG); power spectrum; regression; repetitive transcranial magnetic stimulation (rTMS).


Conflict of interest statement

Murphy owns shares in PeakLogic Inc., Makale receives salary compensation from PeakLogic, Nybo is a founder/owner of CrossTx, Keifer is the owner/operator of BrainHealth Hawaii Incorporated. Blum is Executive Chairman of TranspliceGen Therapeutics Inc., a company that has been licensed to develop his entire patent portfolio including genetic testing and pro-dopamine regulation.

Figures

Figure 1
Figure 1
PrTMS treatment plan and schedule. RTMS for personalized administration (PrTMS) was adjusted weekly in terms of stimulation amplitude, frequency, intertrain interval, length of treatment train, and cortical locations (a minimum of 3 and maximum of 5 locations) treated each day. The EEG was acquired weekly and analyzed spectrally, and concussion questionnaires and sleep questionnaires were also administered every week.
Figure 2
Figure 2
(a) Consistent reduction in concussion symptoms inventory (CSI) across a cohort of 56 individual patients. Each orange and blue combined bar is one subject, and the blue portion indicates the CSI before PrTMS, while the orange segment denotes the CSI score after PrTMS. A paired 2-tailed parametric t-test compared before vs. after scores (p < 0.0001). The average number of treatments was 9 and the range was 6 to 19. (b) Median concussion symptom inventory (CSI) in a cohort of 56 patients of all ages before and after PrTMS. Average number of treatments is 9 and the range was 6 to19. Mean before and after PrTMS CSI scores are shown for all 56 patients and SEMS are indicated on the bars. A parametric, 2-tailed paired t-test compared before versus after PrTMS for all subjects (* p < 0.0001).
Figure 2
Figure 2
(a) Consistent reduction in concussion symptoms inventory (CSI) across a cohort of 56 individual patients. Each orange and blue combined bar is one subject, and the blue portion indicates the CSI before PrTMS, while the orange segment denotes the CSI score after PrTMS. A paired 2-tailed parametric t-test compared before vs. after scores (p < 0.0001). The average number of treatments was 9 and the range was 6 to 19. (b) Median concussion symptom inventory (CSI) in a cohort of 56 patients of all ages before and after PrTMS. Average number of treatments is 9 and the range was 6 to19. Mean before and after PrTMS CSI scores are shown for all 56 patients and SEMS are indicated on the bars. A parametric, 2-tailed paired t-test compared before versus after PrTMS for all subjects (* p < 0.0001).
Figure 3
Figure 3
Reduction in median Rivermead Concussion Inventory (RPQ) scores for 185 patients of all ages suffering from persistent concussion symptoms before and after PrTMS. The blue bars show the median concussion score before treatment, at 6 weeks of treatment, and at the 11- and 24-week follow-ups. The horizontal black bars indicate the 75th and 25th percentiles for each time point, and the putative and approximate score threshold of 16, which roughly divides concussion versus no concussion, is denoted by the dashed line, while ns indicates ‘not significant’. All of the after-PrTMS scores indicate very mild or no concussion symptoms (highly significant * p < 0.01 for pretreatment versus weeks 6 and 11, repeated measures ANOVA). Note that at the 24-week follow-up the median score was lower than pretreatment and higher than at 6 and 11 weeks, but was not statistically significantly different at the p < 0.05 level from pre-treatment or from 6 and 11 weeks, likely due to the small sample size (n = 8).
Figure 4
Figure 4
Average increase in the Sleep Condition Indicator (SCI) score. The average improvement was from 12.4 before treatment to 18.7 at 6 weeks (SEM shown, * p < 0.0034, paired t-test). When the SCI was less than or equal to 16, which is shown on the graph by the dashed line, the patient had probable insomnia. There were 15 subjects.
Figure 5
Figure 5
(a) Alpha peak center frequencies at 6 weeks after PrTMS. The alpha band peak center frequencies for all brain regions (BR1 = frontal, BR2 = central, BR3 = parietal, BR4 = occipital) in subjects suffering from persistent concussion symptoms. A repeated measures ANOVA indicated that the post-PrTMS alpha frequency change, although relatively small, was significant (p < 0.0035). (b) Logarithmic plots of averaged EEG power spectra for each brain region at each time point. The four panels show mean log–log plots of frontal, medial, parietal, and occipital EEG power spectra for all subjects suffering from persistent concussion symptoms. The time points are before PrTMS, at 6 weeks (n = 135) of PrTMS, and at the 11-week (n = 61) and 24-week (n = 13) follow-ups. Note the disorganized appearance of the power spectrum before PrTMS both outside and within the alpha peak (box outline). After 6 weeks of PrTMS the expected posterior–anterior amplitude gradient, i.e., occipital > parietal > central > frontal, for the alpha peak was re-established (highlighted by the box outline), and the brain region spectra exhibited close overall alignment. The 11- and 24-week follow-up spectra maintained the posterior–anterior gradient, but the amplitudes of the overall spectra diverged somewhat. A limitation of the 24-week data is that they were acquired with only 13 subjects. At pretreatment and at 6 weeks, 135 out of 185 subjects had high-quality EEG recordings that in a blinded way were deemed sufficient for proper analysis. (c) Frontal 1/fa Regressions of EEG spectra. The 3 panels show mean log–log plots of frontal EEG power spectra for subjects before PrTMS, at 6 weeks of PrTMS, and at the 11-week and 24-week (n = 13) follow-ups. The solid lines in each panel indicate the 1/fa robust regressions. The alpha peak center frequency signal amplitude is shown in µV2/Hz. The 1/fa slope consistently exhibited a positive change in slope, i.e., shallower at 6, 11 and 24 weeks, all of which were found to be statistically significant using a paired t-test (p < 0.05).
Figure 5
Figure 5
(a) Alpha peak center frequencies at 6 weeks after PrTMS. The alpha band peak center frequencies for all brain regions (BR1 = frontal, BR2 = central, BR3 = parietal, BR4 = occipital) in subjects suffering from persistent concussion symptoms. A repeated measures ANOVA indicated that the post-PrTMS alpha frequency change, although relatively small, was significant (p < 0.0035). (b) Logarithmic plots of averaged EEG power spectra for each brain region at each time point. The four panels show mean log–log plots of frontal, medial, parietal, and occipital EEG power spectra for all subjects suffering from persistent concussion symptoms. The time points are before PrTMS, at 6 weeks (n = 135) of PrTMS, and at the 11-week (n = 61) and 24-week (n = 13) follow-ups. Note the disorganized appearance of the power spectrum before PrTMS both outside and within the alpha peak (box outline). After 6 weeks of PrTMS the expected posterior–anterior amplitude gradient, i.e., occipital > parietal > central > frontal, for the alpha peak was re-established (highlighted by the box outline), and the brain region spectra exhibited close overall alignment. The 11- and 24-week follow-up spectra maintained the posterior–anterior gradient, but the amplitudes of the overall spectra diverged somewhat. A limitation of the 24-week data is that they were acquired with only 13 subjects. At pretreatment and at 6 weeks, 135 out of 185 subjects had high-quality EEG recordings that in a blinded way were deemed sufficient for proper analysis. (c) Frontal 1/fa Regressions of EEG spectra. The 3 panels show mean log–log plots of frontal EEG power spectra for subjects before PrTMS, at 6 weeks of PrTMS, and at the 11-week and 24-week (n = 13) follow-ups. The solid lines in each panel indicate the 1/fa robust regressions. The alpha peak center frequency signal amplitude is shown in µV2/Hz. The 1/fa slope consistently exhibited a positive change in slope, i.e., shallower at 6, 11 and 24 weeks, all of which were found to be statistically significant using a paired t-test (p < 0.05).

Similar articles

Cited by

References

    1. Karton C., Blaine Hoshizaki T. Concussive and subconcussive brain trauma: The complexity of impact biomechanics and injury risk in contact sport. Handb. Clin. Neurol. 2018;158:39–49. doi: 10.1016/B978-0-444-63954-7.00005-7. - DOI - PubMed
    1. Mollica A., Safavifar F., Fralick M., Giacobbe P., Lipsman N., Burke M.J. Transcranial Magnetic Stimulation for the Treatment of Concussion: A Systematic Review. Neuromodulation. 2021;24:803–812. doi: 10.1111/ner.13319. - DOI - PubMed
    1. Suhr J.A., Gunstad J. “Diagnosis Threat”: The effect of negative expectations on cognitive performance in head injury. J. Clin. Exp. Neuropsychol. 2002;24:448–457. doi: 10.1076/jcen.24.4.448.1039. - DOI - PubMed
    1. Tator C.H. Concussions and their consequences: Current diagnosis, management and prevention. Can. Med. Assoc. J. 2013;185:975–979. doi: 10.1503/cmaj.120039. - DOI - PMC - PubMed
    1. Stulemeijer M., Van der Werf S., Borm G.F., Vos P.E. Early prediction of favourable recovery 6 months after mild traumatic brain injury. J. Neurol. Neurosurg. Psychiatry. 2008;79:936–942. doi: 10.1136/jnnp.2007.131250. - DOI - PubMed

LinkOut - more resources