

Profile Characterization of Biogenic Amines in Glioblastoma Patients Undergoing Standard-of-Care Treatment
- PMID: 37626757
- PMCID: PMC10452138
- DOI: 10.3390/biomedicines11082261
Profile Characterization of Biogenic Amines in Glioblastoma Patients Undergoing Standard-of-Care Treatment
Abstract
Introduction: Biogenic amines play important roles throughout cellular metabolism. This study explores a role of biogenic amines in glioblastoma pathogenesis. Here, we characterize the plasma levels of biogenic amines in glioblastoma patients undergoing standard-of-care treatment.
Methods: We examined 138 plasma samples from 36 patients with isocitrate dehydrogenase (IDH) wild-type glioblastoma at multiple stages of treatment. Untargeted gas chromatography-time of flight mass spectrometry (GC-TOF MS) was used to measure metabolite levels. Machine learning approaches were then used to develop a predictive tool based on these datasets.
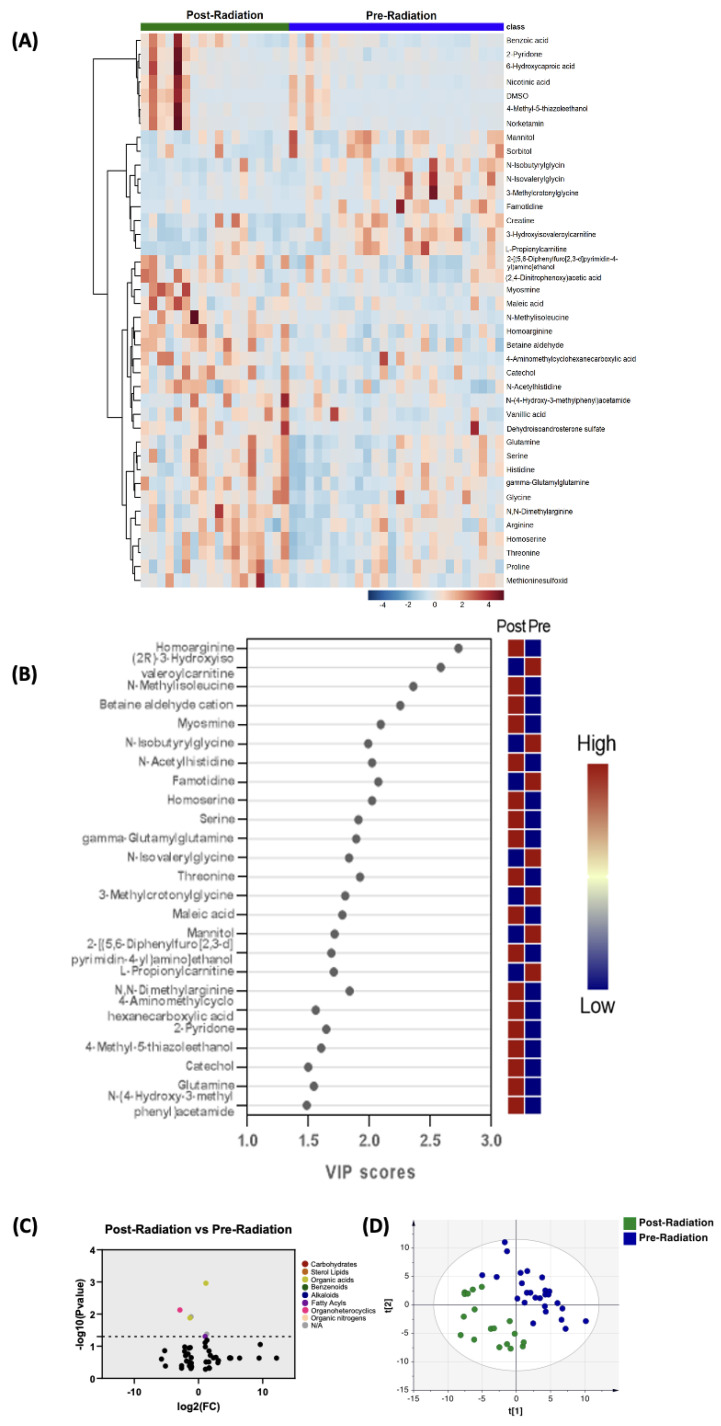
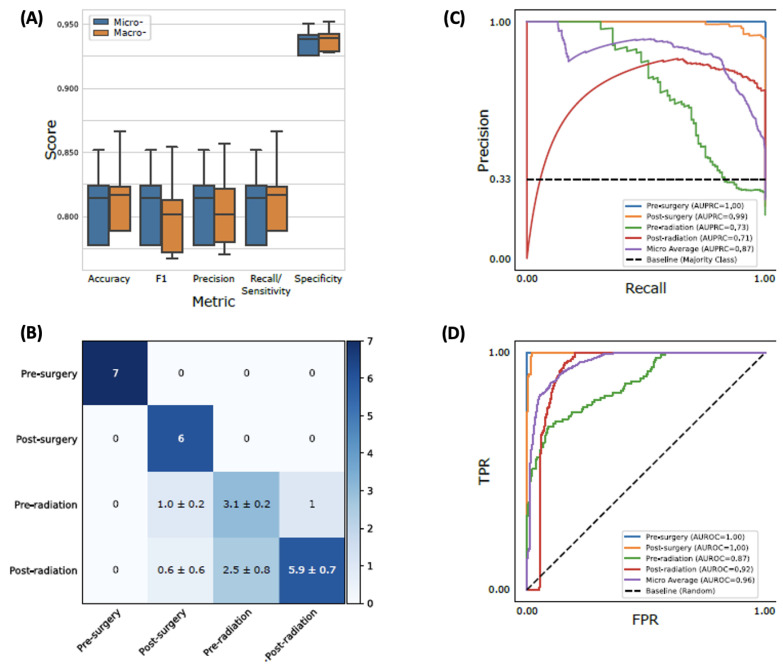
Results: Surgery was associated with increased levels of 12 metabolites and decreased levels of 11 metabolites. Chemoradiation was associated with increased levels of three metabolites and decreased levels of three other metabolites. Ensemble learning models, specifically random forest (RF) and AdaBoost (AB), accurately classified treatment phases with high accuracy (RF: 0.81 ± 0.04, AB: 0.78 ± 0.05). The metabolites sorbitol and N-methylisoleucine were identified as important predictive features and confirmed via SHAP.
Conclusion: To our knowledge, this is the first study to describe plasma biogenic amine signatures throughout the treatment of patients with glioblastoma. A larger study is needed to confirm these results with hopes of developing a diagnostic algorithm.
Keywords: biogenic amines; concurrent chemoradiation; glioblastoma; metabolomic profiling.
Conflict of interest statement
The authors declare no conflict of interest.
Figures


Similar articles
-
Application of Machine Learning to Metabolomic Profile Characterization in Glioblastoma Patients Undergoing Concurrent Chemoradiation.Metabolites. 2023 Feb 17;13(2):299. doi: 10.3390/metabo13020299. Metabolites. 2023. PMID: 36837918 Free PMC article.
-
Metabolomic Profiling and Machine Learning Models for Tumor Classification in Patients with Recurrent IDH-Wild-Type Glioblastoma: A Prospective Study.Cancers (Basel). 2024 Nov 17;16(22):3856. doi: 10.3390/cancers16223856. Cancers (Basel). 2024. PMID: 39594811 Free PMC article.
-
Profiling analysis of biogenic amines and their acidic metabolites in mouse brain tissue using gas chromatography-tandem mass spectrometry.J Chromatogr B Analyt Technol Biomed Life Sci. 2013 Dec 1;940:94-103. doi: 10.1016/j.jchromb.2013.09.026. Epub 2013 Sep 27. J Chromatogr B Analyt Technol Biomed Life Sci. 2013. PMID: 24145015
-
Derivatization with acetic anhydride: applications to the analysis of biogenic amines and psychiatric drugs by gas chromatography and mass spectrometry.J Pharmacol Toxicol Methods. 1994 Jun;31(3):141-8. doi: 10.1016/1056-8719(94)90076-0. J Pharmacol Toxicol Methods. 1994. PMID: 8068975 Review.
-
Roles of Biogenic Amines in Intestinal Signaling.Curr Protein Pept Sci. 2017;18(6):532-540. doi: 10.2174/1389203717666160627073048. Curr Protein Pept Sci. 2017. PMID: 27356940 Review.
Cited by
-
Analyses of Saliva Metabolome Reveal Patterns of Metabolites That Differentiate SARS-CoV-2 Infection and COVID-19 Disease Severity.Metabolites. 2025 Mar 11;15(3):192. doi: 10.3390/metabo15030192. Metabolites. 2025. PMID: 40137156 Free PMC article.
-
MetaWise: Combined Feature Selection and Weighting Method to Link the Serum Metabolome to Treatment Response and Survival in Glioblastoma.Int J Mol Sci. 2024 Oct 11;25(20):10965. doi: 10.3390/ijms252010965. Int J Mol Sci. 2024. PMID: 39456748 Free PMC article.
-
Glioblastoma metabolomics: uncovering biomarkers for diagnosis, prognosis and targeted therapy.J Exp Clin Cancer Res. 2025 Aug 7;44(1):230. doi: 10.1186/s13046-025-03497-2. J Exp Clin Cancer Res. 2025. PMID: 40775789 Free PMC article. Review.
References
-
- Ostrom Q.T., Cioffi G., Gittleman H., Patil N., Waite K., Kruchko C., Barnholtz-Sloan J.S. CBTRUS Statistical Report: Primary Brain and Other Central Nervous System Tumors Diagnosed in the United States in 2012–2016. Neuro. Oncol. 2019;21((Suppl. S5)):v1–v100. doi: 10.1093/neuonc/noz150. - DOI - PMC - PubMed
-
- Baranovičová E., Galanda T., Galanda M., Hatok J., Kolarovszki B., Richterová R., Račay P. Metabolomic profiling of blood plasma in patients with primary brain tumours: Basal plasma metabolites correlated with tumour grade and plasma biomarker analysis predicts feasibility of the successful statistical discrimination from healthy subjects—A preliminary study. IUBMB Life. 2019;71:1994–2002. - PubMed
Grants and funding
LinkOut - more resources
Full Text Sources
Miscellaneous
