. 2023 Aug 11;12(16):2047.
doi: 10.3390/cells12162047.

Anti-Tumor Effect of Turandot Proteins Induced via the JAK/STAT Pathway in the mxc Hematopoietic Tumor Mutant in Drosophila

Affiliations

Anti-Tumor Effect of Turandot Proteins Induced via the JAK/STAT Pathway in the mxc Hematopoietic Tumor Mutant in Drosophila

Yuriko Kinoshita et al. Cells. .

Abstract

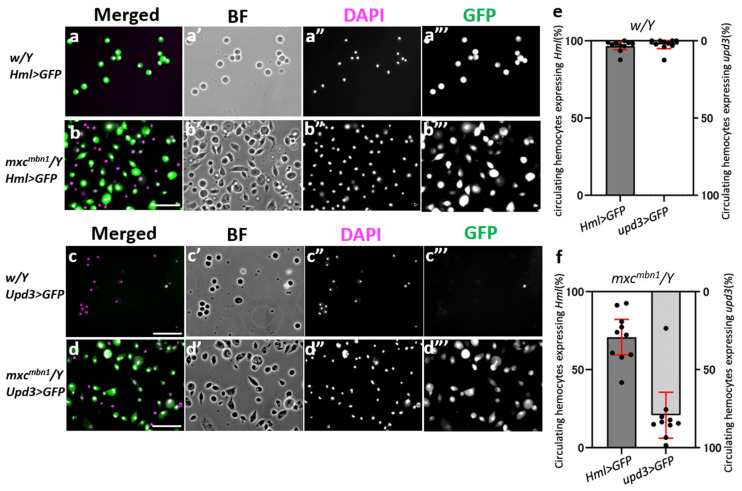
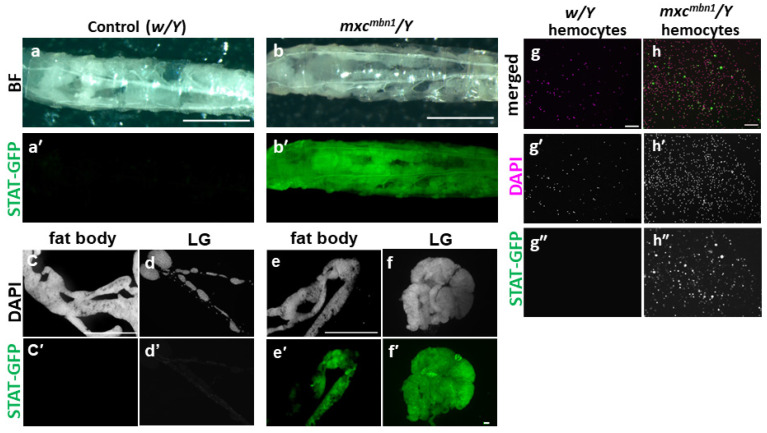
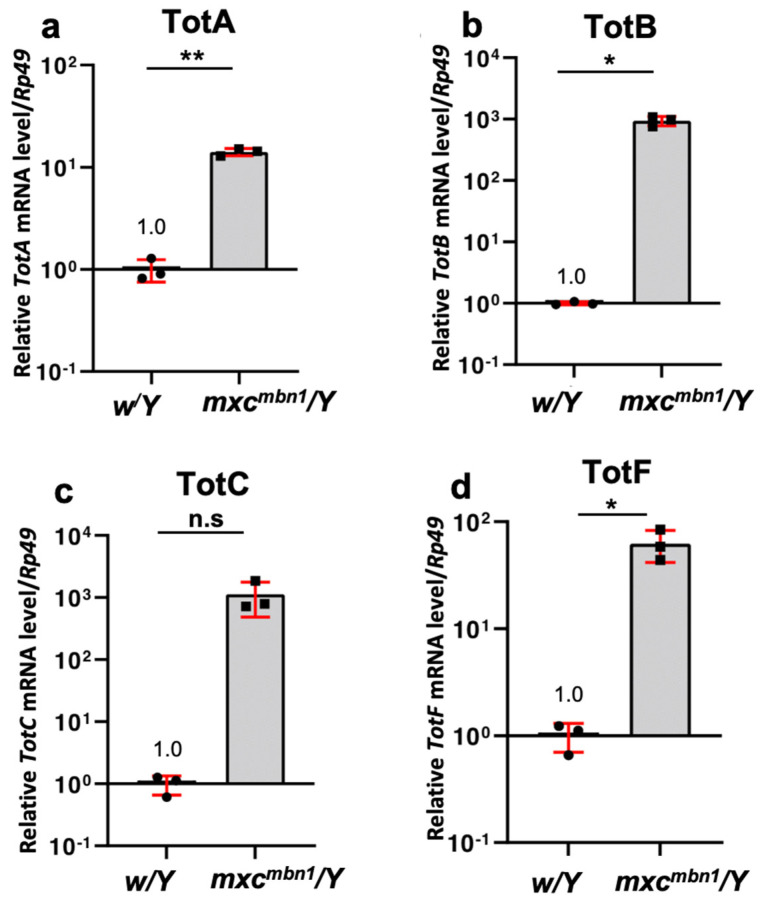
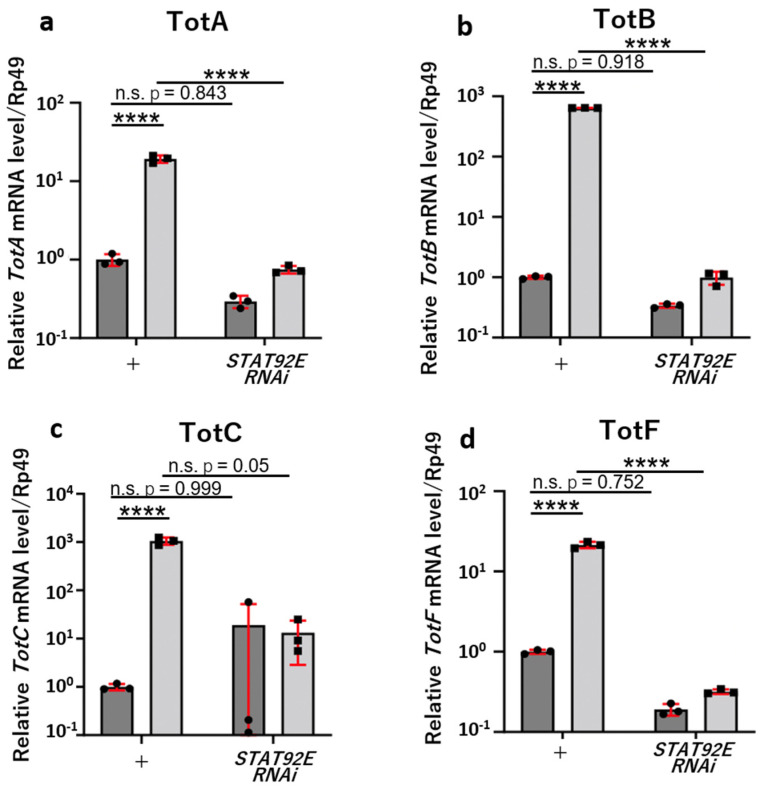
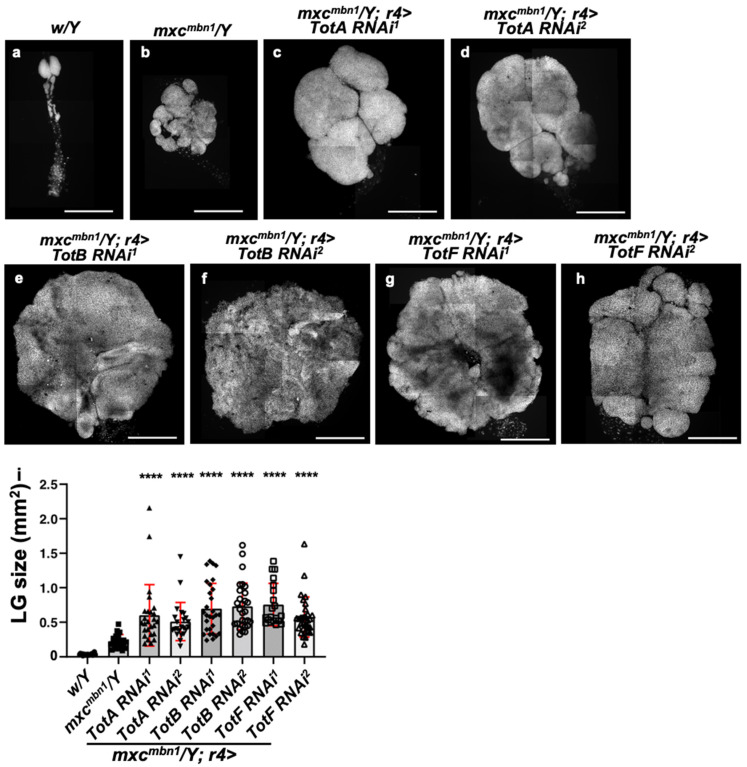
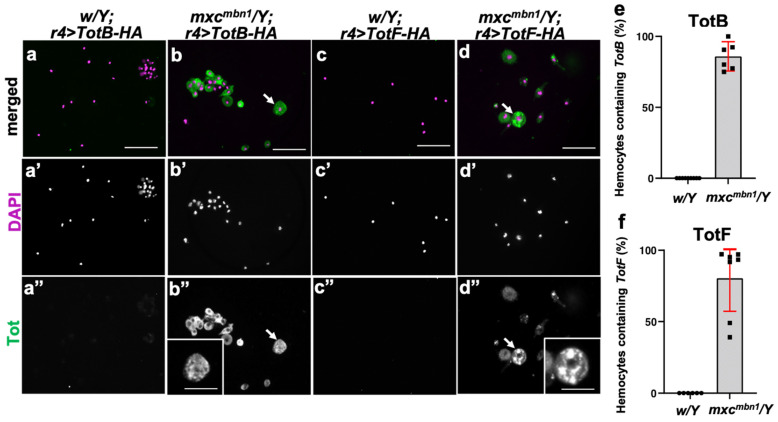
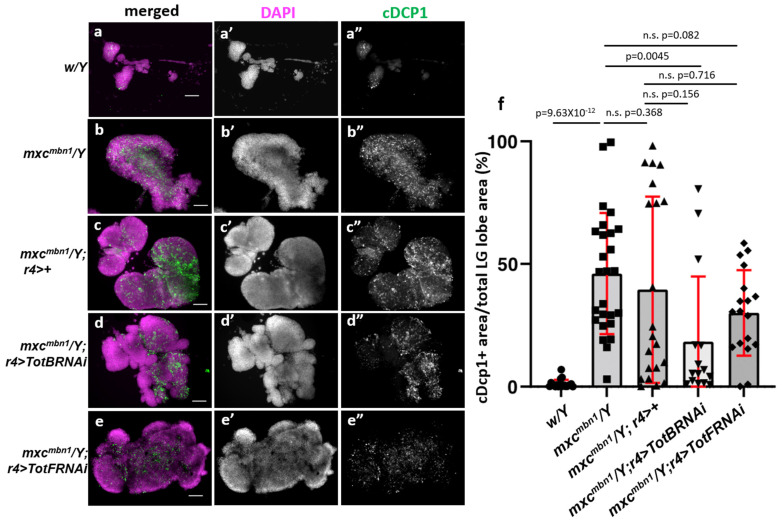
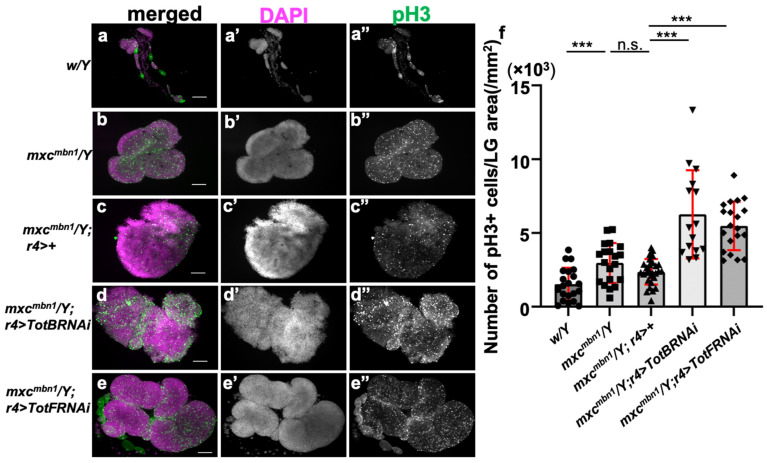
Several antimicrobial peptides suppress the growth of lymph gland (LG) tumors in Drosophila multi sex comb (mxc) mutant larvae. The activity of another family of polypeptides, called Turandots, is also induced via the JAK/STAT pathway after bacterial infection; however, their influence on Drosophila tumors remains unclear. The JAK/STAT pathway was activated in LG tumors, fat body, and circulating hemocytes of mutant larvae. The mRNA levels of Turandot (Tot) genes increased markedly in the mutant fat body and declined upon silencing Stat92E in the fat body, indicating the involvement of the JAK/STAT pathway. Furthermore, significantly enhanced tumor growth upon a fat-body-specific silencing of the mRNAs demonstrated the antitumor effects of these proteins. The proteins were found to be incorporated into small vesicles in mutant circulating hemocytes (as previously reported for several antimicrobial peptides) but not normal cells. In addition, more hemocytes containing these proteins were found to be associated with tumors. The mutant LGs contained activated effector caspases, and a fat-body-specific silencing of Tots inhibited apoptosis and increased the number of mitotic cells in the LG, thereby suggesting that the proteins inhibited tumor cell proliferation. Thus, Tot proteins possibly exhibit antitumor effects via the induction of apoptosis and inhibition of cell proliferation.

Keywords: JAK/STAT; Turandots; antitumor; apoptosis; drosophila; mxc.


Conflict of interest statement

The authors declare no conflict of interest.

Figures

Figure 1
Figure 1
Increased frequencies of circulating hemocytes expressing upd3, a marker for undifferentiated hemocyte precursor, in mxcmbn1 mutant larvae. (a,b) Fluorescent images of the hemocytes expressing GFP depending on Hml in normal control (w/Y; Hml>GFP) (a), and mxcmbn1 (mxcmbn1/Y; Hml>GFP) larvae (b). (a’,b’) Bright-field images (BF) of the hemocytes: the GFP fluorescence signal in green in (a,b) (white in (a’’’,b’’’)), while DNA is stained in magenta in (a,b) (white in (a”,b”)). (c,d) Fluorescence images of the hemocytes expressing GFP depending on Upd3 in normal control (w/Y; upd3>GFP) (c) and mxcmbn1 (mxcmbn1/Y; upd3>GFP) (d) larvae. Bright-field images of the hemocytes (c’,d’): the GFP fluorescence signal is in green in (c,d) (white in (c’’’,d’’’)), while DNA is stained in magenta in (c,d) (white in (c”,d”)). Scale bar: 10 μm. (e,f) Graphs quantifying the percentage of the cells expressing GFP depending on Hml and/or upd in control (w/Y) (e) or the mutant (mxcmbn1) (f) larvae. Error bars represent the 95% confidence intervals (95%CI). Thus, the mxcmbn1 hemolymph contained hemocytes with a higher frequency of upd3, a marker gene for undifferentiated hemocyte precursors.
Figure 2
Figure 2
Activation of the JAK/STAT pathway in the fat body, LGs, and circulating hemocytes of mxcmbn1 mutant larvae. (ab’) Larval side view, anterior to left. (a,b) Bright-field (BF) images and (a’,b’) GFP fluorescence images of mature control (a,a’) and mxcmbn1 mutant (b,b’) larvae harboring the 10×Stat92E-GFP reporter, which monitors the activation of the JAK-STAT pathway. Scale bar is 1 mm. (cf) DAPI-stained fluorescence images and GFP fluorescence (c’f’) images of the fat body (c,e) and LGs (d,f) in normal control (w/Y; Stat92E-GFP/+) (c,d) and mxcmbn1 mutant larvae (mxcmbn1/Y; Stat92E-GFP/+) (e,f). (g,h) DAPI-stained fluorescence images (magenta in (g,h), white in (g’,h’)) and GFP fluorescence (green in (g,h), white in (g”,h”)) fluorescence images of the circulating hemocytes in the hemolymph of normal control (w/Y; Stat92E-GFP/+) (g) and mxcmbn1 (mxcmbn1/Y; Stat92E-GFP/+) mutant larvae (h). Scale bar: 100 μm.
Figure 3
Figure 3
qRT−PCR to quantify the mRNA levels of TotA, TotB, TotC, and TotF in mxcmbn1 mutant larvae. (ad) Quantification of the mRNA levels of TotA, TotB, TotC, and TotF using qRT-PCR with total RNAs prepared from third-instar larvae used as templates. The x-axis from left to right shows normal control (w/Y) and mxcmbn1 mutant (mxcmbn1/Y) larvae. The y-axis shows the mRNA levels of the target genes relative to the endogenous control gene, Rp49. The mean of the relative value of the control from three independent experiments is shown as 1.0. Bars indicate the relative mRNA levels of the target genes, TotB and TotF, as assessed using qRT-PCR (average of three times). The differences between groups were assessed using Welch’s t-test (TotA t(2.183) = 19.20, p = 0.002; TotB t(2.000) = 9.698, p = 0.011; TotC t(2.000) = 3.301, p = 0.094; TotF t(2.001) = 5.144, p = 0.036, * p < 0.05 and ** p < 0.01, n.s.—not significant, n = 3). Error bars indicate standard deviation (s.d.).
Figure 4
Figure 4
JAK/STAT pathway−dependent increase in the transcription of Tot genes in the fat body of mxcmbn1 mutant larvae. (ad) Quantification of the mRNA levels of TotA, TotB, TotC, and TotF using qRT-PCR, with RNAs prepared from the fat body used as templates. Quantification was performed using qRT-PCR with RNAs prepared from the fat body as templates. The x-axis from left to right: normal control larvae (w/Y; r4/+), fat-body-specific Stat92E depletion in control larvae (w/Y; r4>Stat92ERNAi), mxcmbn1 mutant larvae (mxcmbn1/Y; r4/+), and mxcmbn1 larvae with fat-body-specific Stat92E depletion in (mxcmbn1/Y; r4>Stat92ERNAi). The y-axis shows the relative mRNA levels of the target genes to the level of control gene levels (Rp49). The mean of the relative value of the control from three independent experiments is shown as 1.0. Bars indicate the relative mRNA levels of the target gene. Statistical difference was examined using a two-way ANOVA by Turkey’s multiple comparisons tests. **** p < 0.0001 Error bars indicate s.d.
Figure 5
Figure 5
Enhancement of the hyperplasia of LG tumors after depletion of TotA, TotB, and TotF in the fat body of mxcmbn1 mutant larvae. (ah) DAPI-stained images of LGs in (a) normal control (w/Y) larva, (b) mxcmbn1 mutant larva without depletion (mxcmbn1/Y), (c,d) mxcmbn1 mutant larva harboring a fat-body-specific depletion of TotA (mxcmbn1/Y; r4>TotARNAi1 (c) and mxcmbn1/Y; r4>TotARNAi2 (d)), (e,f) mxcmbn1 mutant larva with TotB knockdown (mxcmbn1/Y; r4>TotBRNAi1 (e) and mxcmbn1/Y; r4>TotBRNAi2 (f)), and (g,h) mxcmbn1 mutant larva with a depletion of TotF (mxcmbn1/Y; r4>TotFRNAi1 (g) and mxcmbn1/Y; r4>TotFRNAi2 (h)). Scale bar is 100 μm. (i) Quantification of the LG size in larvae with depletion of TotA, TotB, or TotF in the mxcmbn1 larvae. Statistical difference tests were determined using a one-way ANOVA (TotA, n = 23; TotB, n = 29; TotF, n = 20). The p-value above each bar indicates the statistical difference between mxcmbn1/Y and mxcmbn1/Y; r4>TotRNAi, as follows; by using a one-way ANOVA followed by Bonferroni’s multiple comparisons test (p = 1.62 × 10⁻¹⁷ between control and mxc mutants, p = 1.83 × 10⁻⁸ between mxc and the mutant with TotARNAi1, p = 1.40 × 10⁻⁶ between mxc and TotARNAi2, p = 1.64 × 10⁻¹² between mxc and TotBRNAi1, p = 2.6 × 10⁻¹⁴ between mxc and TotBRNAi2, p = 1.99 × 10⁻¹³ between mxc and TotFRNAi1, p = 1.19 × 10⁻⁹ between mxc and TotFRNAi2, and **** p < 0.0001. Error bars indicate s.d.
Figure 6
Figure 6
Immunostaining of circulating hemocytes to detect TotB and TotF induced in the fat body of mxcmbn1 and control larvae. (ad) Fluorescent images of circulating hemocytes immunostained with anti-HA antibody to detect TotB (a,b) and TotF (c,d). (a,b) normal control (w/Y; r4>TotB-HA) (a) and mxcmbn1 larvae harboring the fat-body-specific overexpression of TotB (mxcmbn1/Y; r4>TotB-HA) (b). (c,d) TotF in normal control (w/Y; r4>TotF-HA) (c) and mxcmbn1 larvae harboring the fat-body-specific expression of TotF (mxcmbn1/Y; r4>TotF-HA) (d). Anti-HA immunostaining signal is in green in (ad) (white in (a”d”)), while DNA is stained in magenta in (ad) (white in (a’d’)). Arrows indicate vesicles immunostained with anti-HA antibody in hemocytes. The hemocytes are indicated using arrows in (b,d), with the magnified forms shown in insets (b”,d”). The cells containing vesicles were visualized by means of anti-HA immunostaining. Scale bars: 10 μm (b,d) and 5 μm (b”,d”). (e,f) Graphs quantifying the percentages of calculating hemocytes containing TotB (e) and those containing TotF (f) among total circulating hemocytes in w and mxcmbn1 larvae. Error bars represent 95%CI.
Figure 7
Figure 7
Immunostaining of LGs with the antiactivated caspase antibody to detect apoptotic cells on the LG tumors of mxcmbn1 larvae harboring TotB and TotF. (ae) Fluorescent images of LGs immunostained with an anti-cDcp1 antibody in (a) normal control larvae (w/Y), (b) mxcmbn1 larvae (mxcmbn1/Y), (c) mxcmbn1 larvae expressing Gal4 depending on r4 (mxcmbn1/Y; r4>+), (d) mxcmbn1 larval harboring the fat-body-specific depletion of TotB (mxcmbn1/Y; r4>TotBRNAi1), and (e) the LG of the mutant larvae harboring the depletion of TotF (mxcmbn1/Y; r4>TotFRNAi1). The anti-cDcp1 immunostaining signal is in green (white in (a”e”)), while DNA is stained in magenta in (ae) (white in (a’e’)). Scale bar: 100 μm. (f) Quantification of the area showing anti-cDcp1 immunostaining signal in whole lobe regions of LGs of each genotype. Statistical significance was examined using a one way ANOVA test (n ≥ 15). p = 9.63 × 10⁻¹² control and mxc, p = 0.368 between mxcmbn1/Y and mxcmbn1/Y; r4>+, p = 0.156 between mxcmbn1/Y; r4>+ and mxcmbn1/Y; r4>TotBRNAi1, p = 0.716 between mxcmbn1; r4>+ and mxcmbn1; r4>TotFRNAi1. n.s.: not significant. Error bars indicate s.d.
Figure 8
Figure 8
Anti-phospho-H3 immunostaining of LGs, to detect proliferation in the LG tumors of mxcmbn1 mutant larvae harboring a depletion of TotB and TotF. (ae) Fluorescent images of LGs immunostained with anti-pH3 antibody from (a) normal control (w/Y) larva, (b) mxcmbn1 mutant (mxcmbn1/Y) larva, (c) mxcmbn1 mutant larva expressing Gal4 dependent on r4 (mxcmbn1/Y; r4>+), (d) mxcmbn1 mutant larva harboring a fat-body-specific depletion of the TotB gene (mxcmbn1/Y; r4>TotBRNAi), and (e) mxcmbn1 larva harboring the depletion of TotF (mxcmbn1/Y; r4>TotFRNAi). The anti-pH3 immunostaining signal is in green (white in (a”e”)), while the DNA is stained in magenta in (ae) (white in (a’e’)). Scale bar is 100 μm. (f) Number of mitotic cells in the LGs from larvae of each genotype. Statistical significance was examined using a one-way ANOVA test followed by Bonferroni’s multiple comparisons test (n ≥ 15). p = 1.36 × 10⁻⁴ between control and mxc, p = 0.244 between mxcmbn1/Y and mxcmbn1/Y; r4>+, p = 2.76 × 10⁻⁴ between mxcmbn1/Y; r4>+, and mxcmbn1/Y; r4>TotBRNAi1, p = 2.67 × 10⁻⁴ between mxcmbn1; r4>+, and mxcmbn1; r4>TotFRNAi1. *** p < 0.001, n.s.: not significant. Error bars indicate s.d.

Similar articles

Cited by

References

    1. Hoffmann J.A. The immune response of Drosophila. Nature. 2003;426:33–38. doi: 10.1038/nature02021. - DOI - PubMed
    1. Buchon N., Silverman N., Cherry S. Immunity in Drosophila melanogaster--from microbial recognition to whole-organism physiology. Nat. Rev. Immunol. 2014;14:796–810. doi: 10.1038/nri3763. - DOI - PMC - PubMed
    1. Hoffmann J.A., Reichhart J.-M. Drosophila innate immunity: An evolutionary perspective. Nat. Immunol. 2002;3:121–126. doi: 10.1038/ni0202-121. - DOI - PubMed
    1. Tzou P., De Gregorio E., Lemaitre B. How Drosophila combats microbial infection: A model to study innate immunity and host-pathogen interactions. Curr. Opin. Microbiol. 2002;5:102–110. doi: 10.1016/S1369-5274(02)00294-1. - DOI - PubMed
    1. Lazzaro B.P., Zasloff M., Rolff J. Antimicrobial peptides: Application informed by evolution. Science. 2020;368:eaau5480. doi: 10.1126/science.aau5480. - DOI - PMC - PubMed

Publication types

LinkOut - more resources