. 2023 Aug 15;12(16):2069.
doi: 10.3390/cells12162069.

Enhanced Membrane Fluidization and Cholesterol Displacement by 1-Heptanol Inhibit Mast Cell Effector Functions

Affiliations

Enhanced Membrane Fluidization and Cholesterol Displacement by 1-Heptanol Inhibit Mast Cell Effector Functions

Viktor Bugajev et al. Cells. .

Abstract

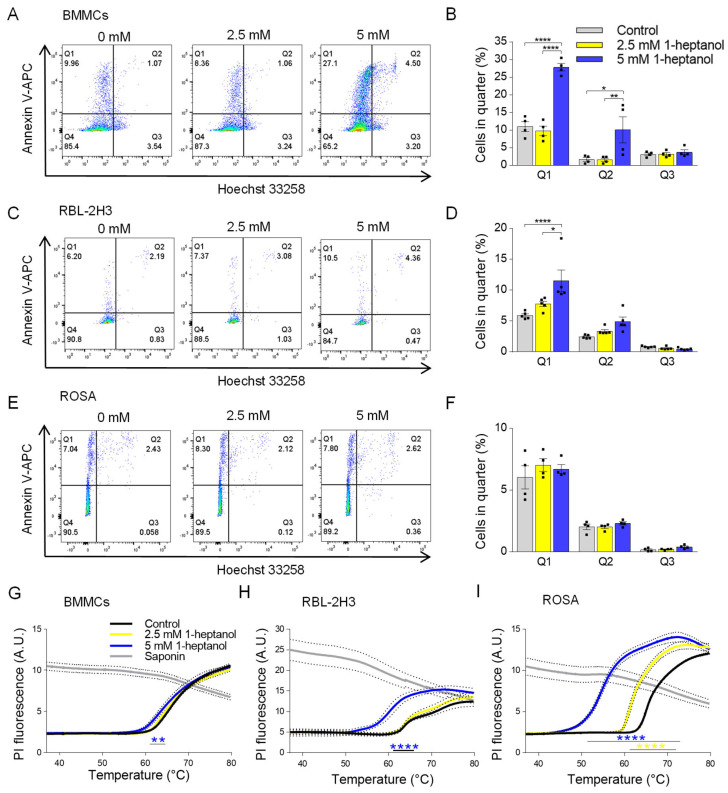
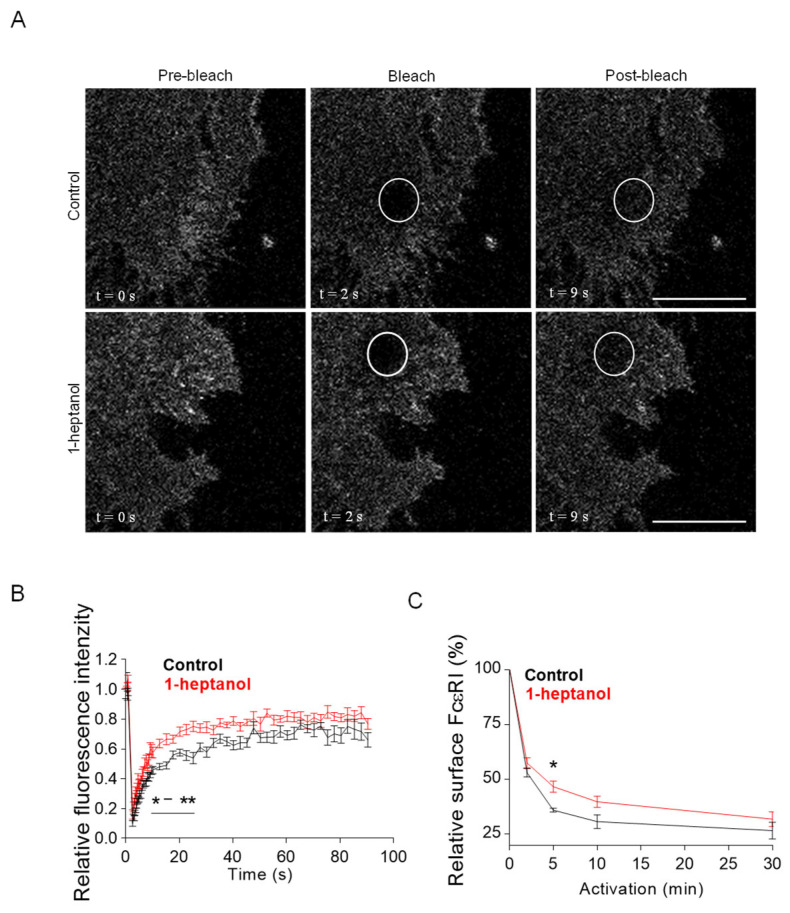
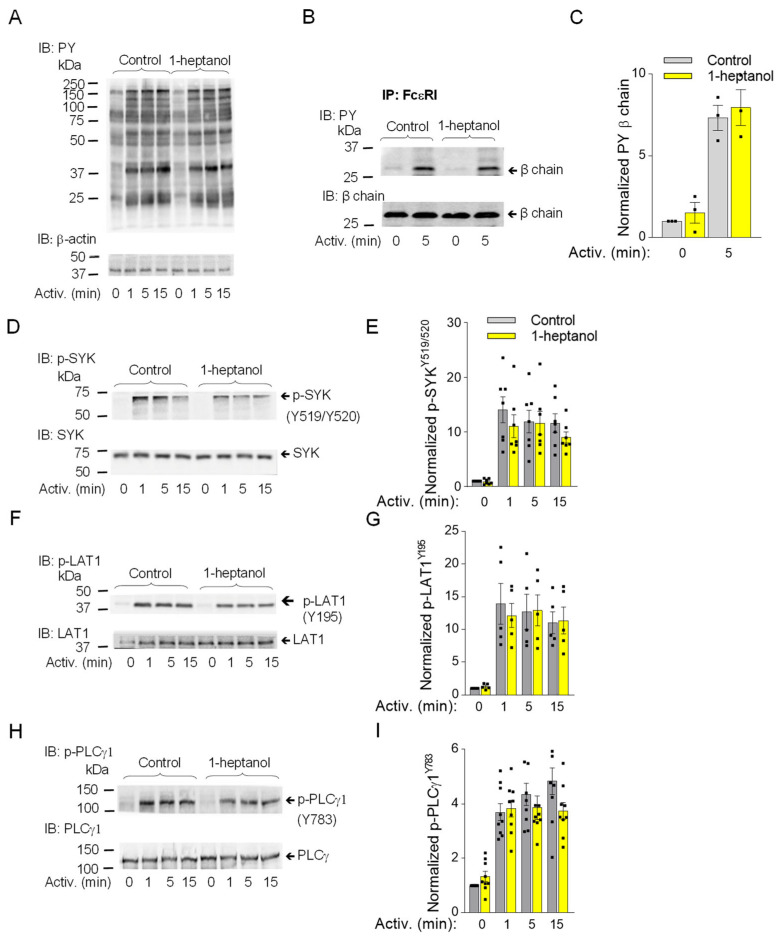
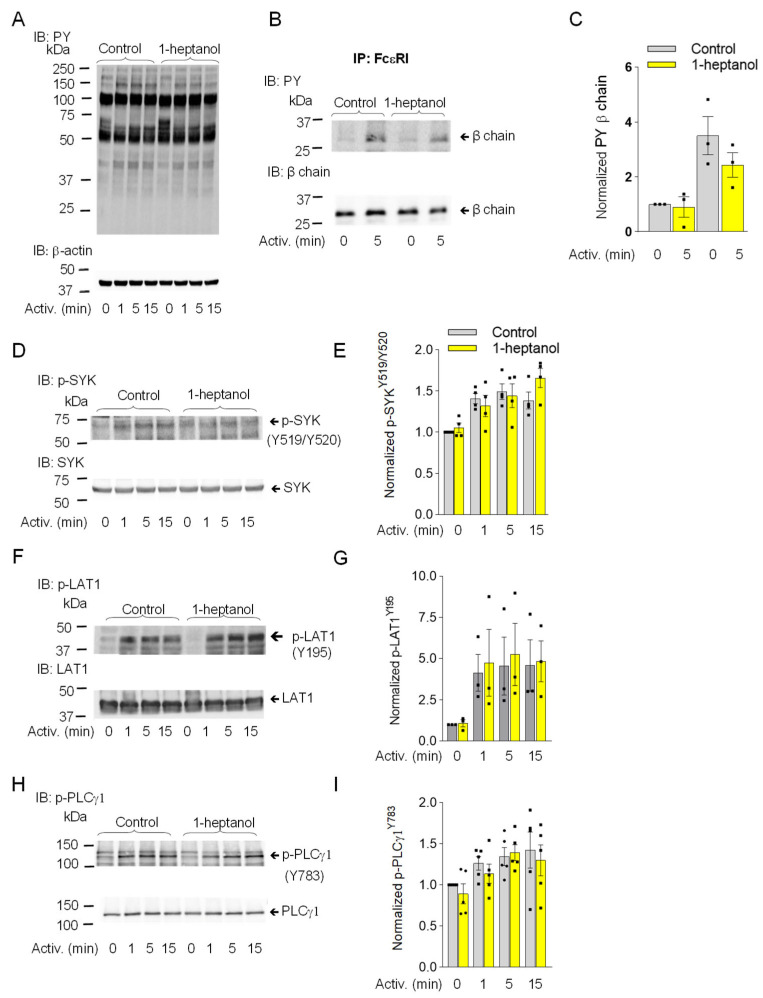
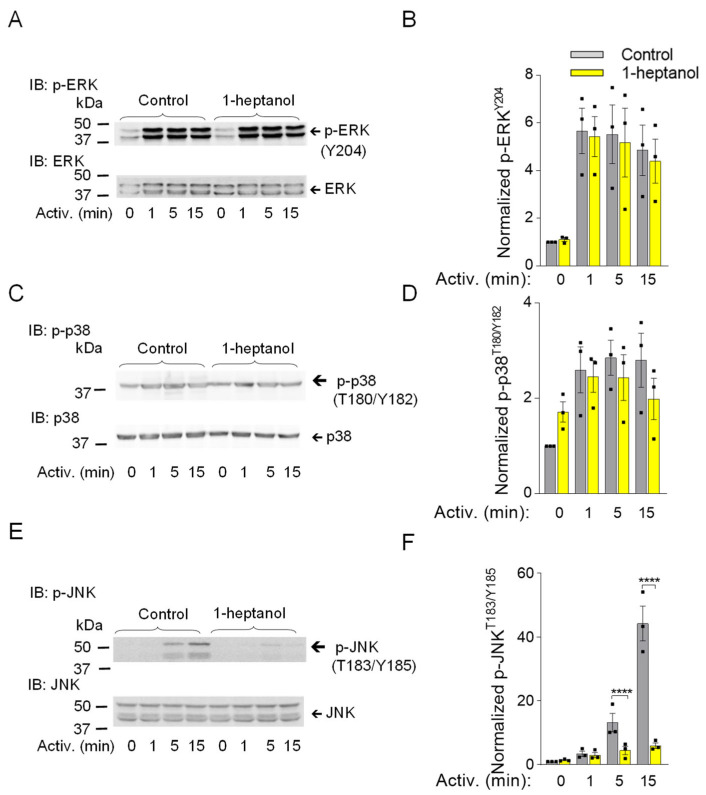
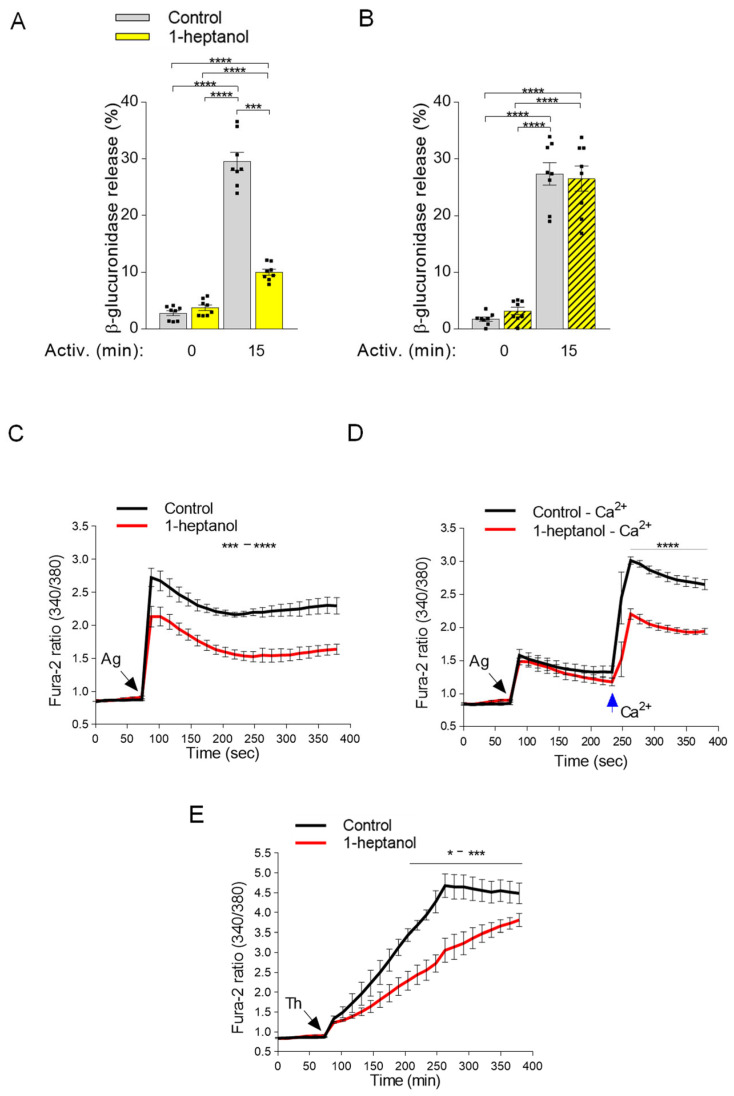
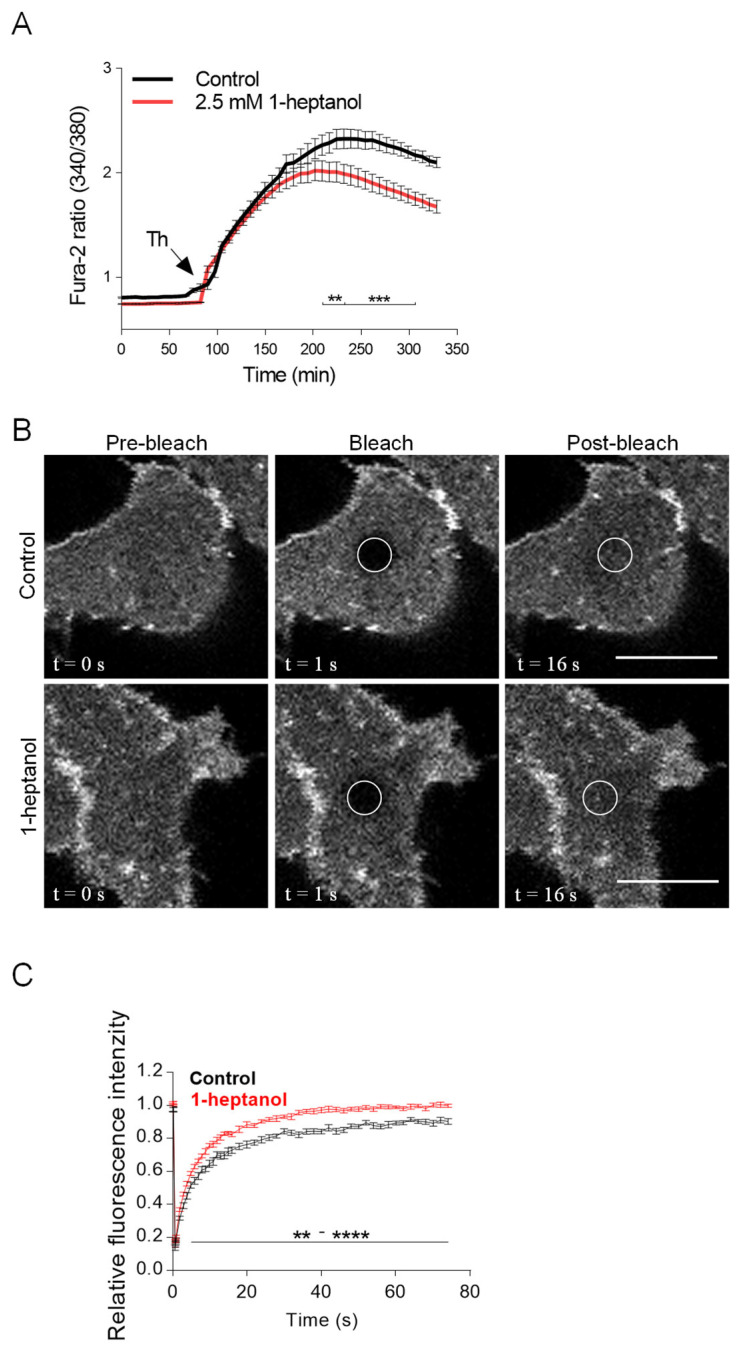
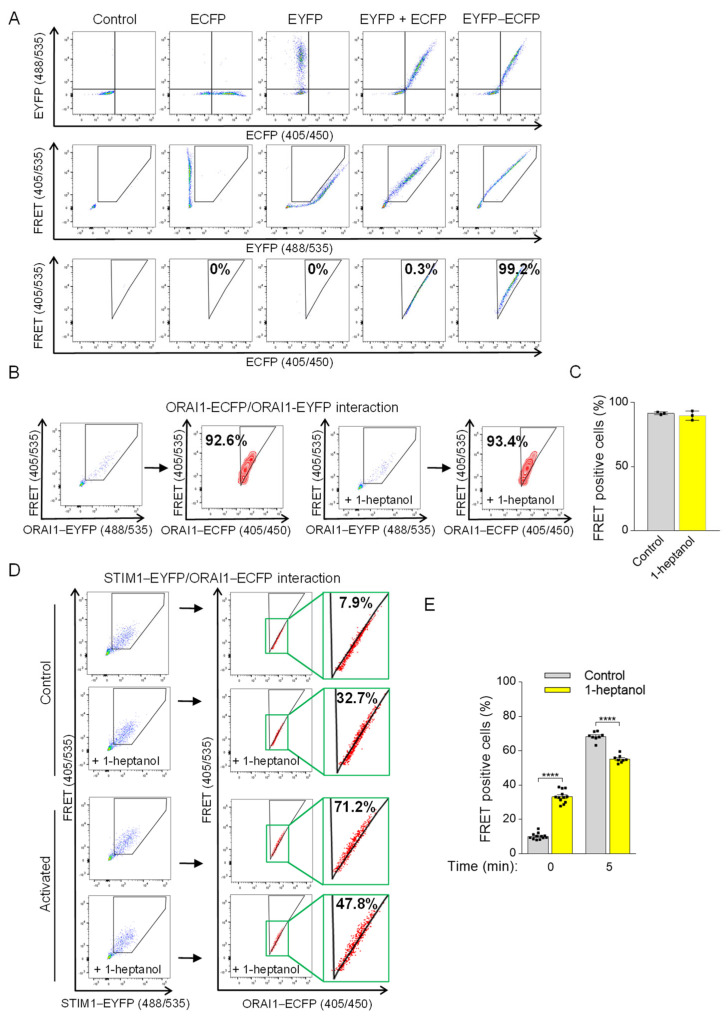
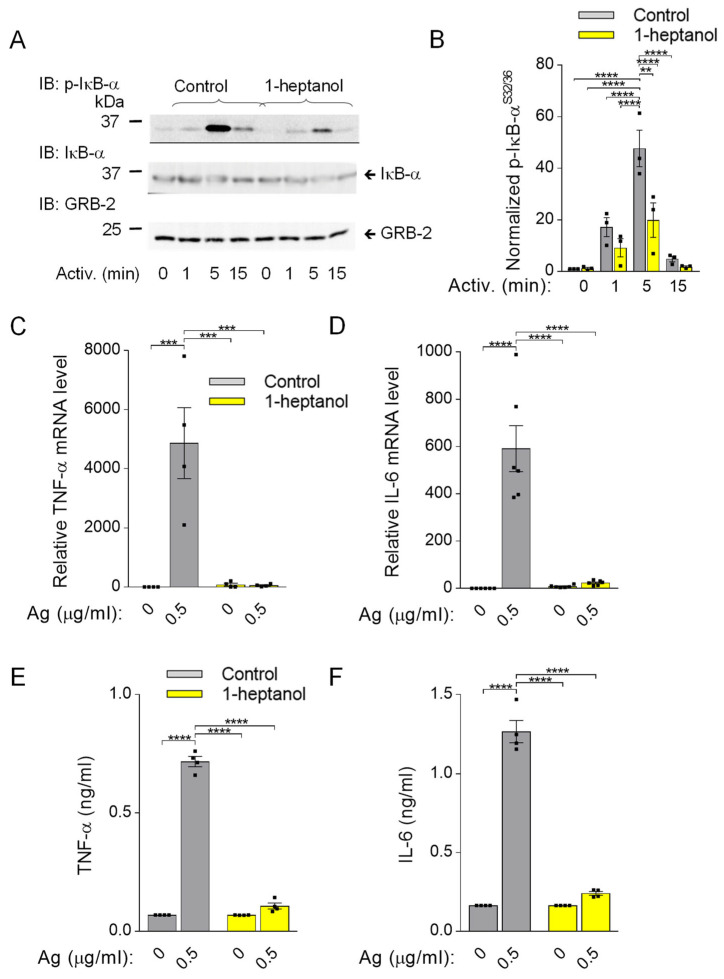
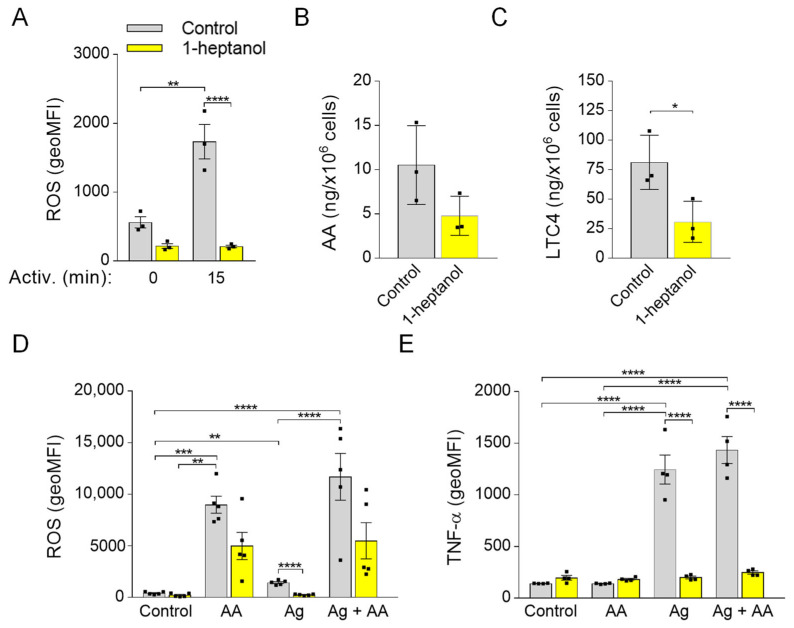
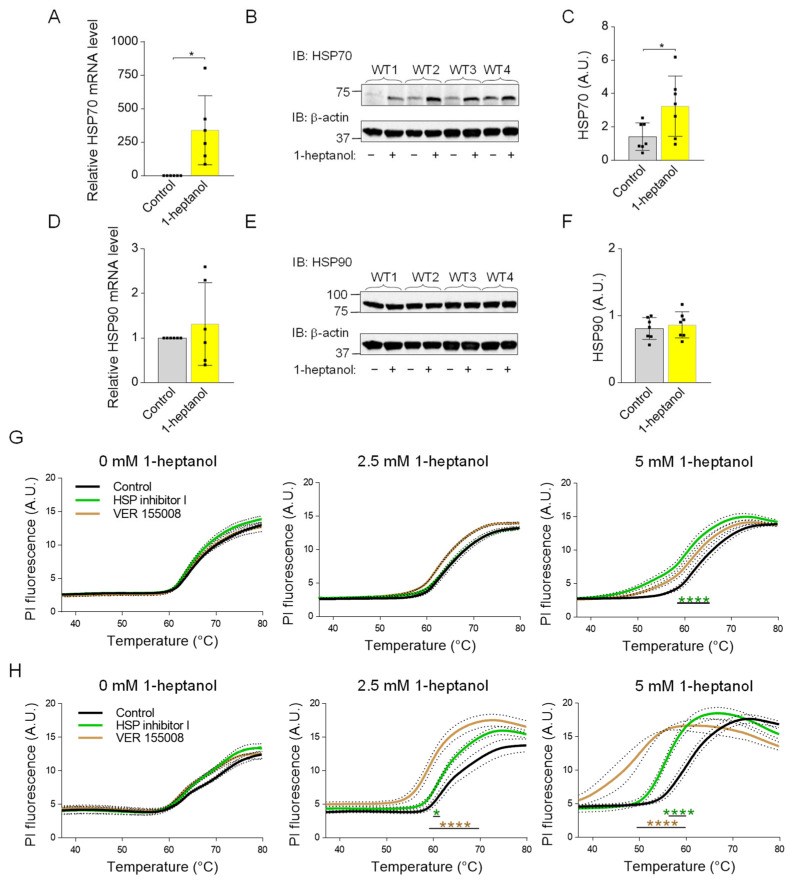
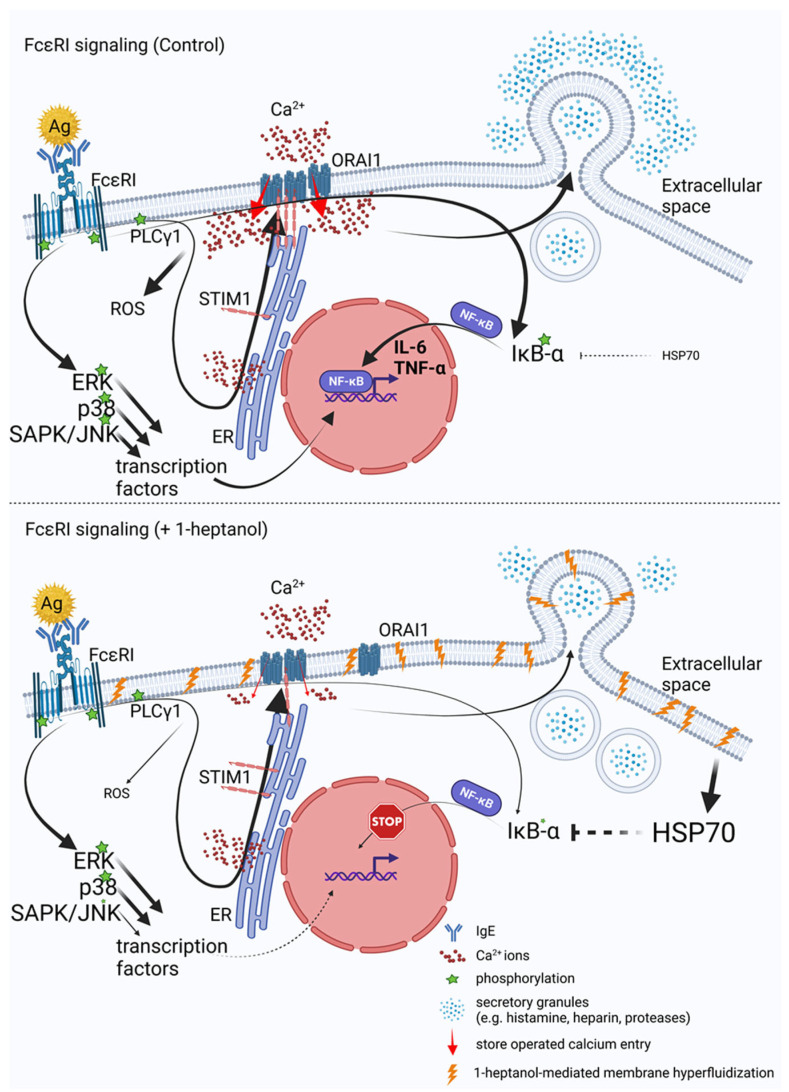
Signal transduction by the high-affinity IgE receptor (FcεRI) depends on membrane lipid and protein compartmentalization. Recently published data show that cells treated with 1-heptanol, a cell membrane fluidizer, exhibit changes in membrane properties. However, the functional consequences of 1-heptanol-induced changes on mast cell signaling are unknown. This study shows that short-term exposure to 1-heptanol reduces membrane thermal stability and dysregulates mast cell signaling at multiple levels. Cells treated with 1-heptanol exhibited increased lateral mobility and decreased internalization of the FcεRI. However, this did not affect the initial phosphorylation of the FcεRI-β chain and components of the SYK/LAT1/PLCγ1 signaling pathway after antigen activation. In contrast, 1-heptanol inhibited SAPK/JNK phosphorylation and effector functions such as calcium response, degranulation, and cytokine production. Membrane hyperfluidization induced a heat shock-like response via increased expression of the heat shock protein 70, increased lateral diffusion of ORAI1-mCherry, and unsatisfactory performance of STIM1-ORAI1 coupling, as determined by flow-FRET. Furthermore, 1-heptanol inhibited the antigen-induced production of reactive oxygen species and potentiated stress-induced plasma membrane permeability by interfering with heat shock protein 70 activity. The combined data suggest that 1-heptanol-mediated membrane fluidization does not interfere with the earliest biochemical steps of FcεRI signaling, such as phosphorylation of the FcεRI-β chain and components of the SYK/LAT/PLCγ1 signaling pathway, instead inhibiting the FcεRI internalization and mast cell effector functions, including degranulation and cytokine production.

Keywords: FRAP; FcεRI signaling; STIM1-ORAI1 coupling; alkanol; flow-FRET; heat shock response; membrane fluidizer; store-operated calcium entry.


Conflict of interest statement

The authors declare no conflict of interest. The funders had no role in the design of the study, in the collection, analyses, or interpretation of data, in the writing of the manuscript, or in the decision to publish the results.

Figures

Figure 1
Figure 1
Dose-dependent effects of 1-heptanol on annexin V-APC/Hoechst 33258 staining and membrane thermal stability of various mast cell types. (AF) Representative flow cytometry profiles of mouse BMMCs (A), RBL-2H3 cells (C), and human ROSA cells (E) exposed for 15 min to various concentrations of 1-heptanol and stained with annexin V-APC and Hoechst 33258. Quantitative analysis of flow cytometry data as shown in (A) ((B), n = 4), (C) ((D), n = 4), and (E) ((F), n = 4). (GI) Membrane thermal stability analysis. BMMCs ((G), n = 4), RBL-2H3 cells ((H), n = 3), and human ROSA cells ((I), n = 4) were exposed to the indicated concentrations of 1-heptanol and PI. The cells were plated in 96-well plates for RT-PCR and incubated for 15 min at 37 °C, followed by PI fluorescence measurement at a slowly increasing temperature in the RT-PCR instrument. Saponin-treated cells with disrupted membranes served as positive controls in (GI); these data were not included in the statistical evaluation of intergroup differences using 2-way ANOVA. Values indicate means ± SEM calculated from n, which show numbers of biological replicates; * p < 0.05, ** p < 0.01, **** p < 0.0001.
Figure 2
Figure 2
1-Heptanol enhances the lateral mobility of FcεRI, as determined by FRAP, but retards internalization. (A) IgE-FITC-sensitized RBL-2H3 cells were exposed for 10 min to the vehicle (BSS-BSA; Control) or 2.5 mM 1-heptanol. Representative fluorescence image sequences are from cells at the indicated time points before photobleaching (Pre-bleach), at photobleaching (Bleach; the circled areas) or after photobleaching (Post-bleach; the circled areas). Bars indicate 10 µm. (B) Quantification of the recovery into the photobleached areas as shown in A. The relative fluorescence intensity was calculated at each time point by dividing the fluorescence in the bleached region by the fluorescence in the corresponding unbleached region. The background was subtracted from all signals. Values in (B) indicate means ± SEM of two independent experiments for the control cells (n = 16) and 1-heptanol-treated cells (n = 15). (C) FcεRI internalization in antigen-activated BMMCs in the absence (control, n = 5) or presence of 2.5 mM 1-heptanol (n = 5). Statistical significance of intergroup differences is indicated in (B,C); * p < 0.05, ** p < 0.01.
Figure 3
Figure 3
1-Heptanol does not affect tyrosine phosphorylation of global cellular proteins, FcεRI-βsubunit, or SYK/LAT1/PLCγ1 axis in antigen-activated BMMCs. (A) IgE-sensitized BMMCs were exposed for 15 min to the vehicle (BSS-BSA; Control) or 2.5 mM 1-heptanol and then activated with antigen (TNP-BSA; 0.5 µg/mL) for the indicated time intervals in the absence or presence of 2.5 mM 1-heptanol. Whole lysates from the cells were size-fractionated by SDS-PAGE and analyzed by immunoblotting (IB) with PY-20-HRP conjugate. For loading control, the blots were developed with an antibody specific for β-actin (n = 3). (B,C) The cells were treated for 15 min with vehicle (Control) or 2.5 mM 1-heptanol and then activated with antigen as in A. The FcεRI complexes were immunoprecipitated (IP) and analyzed by IB with the PY-20-HRP conjugate. The position of the FcεRI-β chain is indicated (n = 3). (DI) IgE-sensitized BMMCs were treated and activated as in A; the whole-cell lysates were size-fractionated by SDS-PAGE and analyzed by immunoblotting with phosphotyrosine-specific antibodies recognizing SYKY519/Y520 ((D,E); n = 7), LAT1Y195 ((F,G); n = 5), and PLCγ1Y783 ((H,I); n = 9). Representative immunoblots with the corresponding protein loading controls are shown in B, D, F, and H. The results from quantifying the tyrosine-phosphorylated proteins in activated cells are normalized to signals in non-activated cells and loading control proteins (C,E,G,I). Values indicate means ± SEM calculated from the numbers indicated above (n), which denote the numbers of biological replicates. Numbers on the left in (A,B,D,F,H) indicate the positions of molecular weight markers in kDa.
Figure 4
Figure 4
1-Heptanol does not affect tyrosine phosphorylation of global cellular proteins, FcεRI-βsubunit, or the SYK/LAT1/PLCγ1 axis in antigen-activated RBL-2H3 mast cells. (A) IgE-sensitized cells were treated for 15 min with vehicle (Control) or 2.5 mM 1-heptanol and then activated with antigen (TNP/BSA; 0.5 µg/mL) for the indicated time intervals in the absence or presence of 2.5 mM 1-heptanol. Whole-cell lysates were size-fractionated by SDS-PAGE and analyzed by immunoblotting (IB) with PY-20-HRP conjugate. For loading control, the blots were developed with an antibody specific for β-actin (n = 3). (B,C) The cells were treated for 15 min with vehicle (Control) or 2.5 mM 1-heptanol and then activated with antigen as in A for 5 min. The FcεRI complexes were immunoprecipitated (IP) and analyzed by IB with the PY-20-HRP conjugate. For loading controls, the blots were developed with FcεRI-β chain-specific antibody. The position of the FcεRI-β chain is indicated (n = 3). (C) Quantitative analysis of the phosphorylated FcεRI-β chains normalized to their amounts. Values indicate means ± SEM (n = 3). (DI) RBL-2H3 cells were activated for different time intervals as in A, size-fractionated by SDS-PAGE, and analyzed by immunoblotting with phosphotyrosine-specific antibodies recognizing SYKY519/Y520 ((D,E); n = 4), LAT1Y195 ((F,G); n = 3), and PLCγ1Y783 ((H,I); n = 5). The antibodies specific to the corresponding proteins were used as loading controls. Representative immunoblots with the corresponding protein loading controls are shown in (D,F,H). The results from the quantification of the tyrosine-phosphorylated proteins in activated cells are normalized to signals in non-activated cells and loading control proteins (E,G,I). Values indicate means ± SEM calculated from the numbers above (n), denoting the numbers of biological replicates. Numbers on the left in (A,B,D,F,H) indicate the positions of molecular weight markers in kDa.
Figure 5
Figure 5
1-Heptanol inhibits phosphorylation of SAPK/JNK (JNK) but not ERK and p38 in antigen-activated BMMCs. (AF) IgE-sensitized BMMCs were pre-incubated with vehicle (BSS-BSA; Control) or 2.5 mM 1-heptanol for 15 min and then activated or not with antigen (TNP-BSA; 0.5 µg/mL) for the indicated time intervals. Whole-cell lysates were size fractionated by SDS-PAGE and analyzed by immunoblotting with phosphotyrosine-specific antibodies recognizing ERKY204 ((A,B); n = 3), p38T180/Y182 ((C,D); n = 3), and JNKT183/Y185 ((E,F); n = 3). Antibodies specific for the corresponding proteins were used as loading controls. Representative immunoblots with the corresponding protein loading controls are shown in (A,C,E). The results of quantification of the tyrosine-phosphorylated proteins in activated cells are normalized to the signals in non-activated cells and loading control proteins (B,D,F). Values are mean ± SEM calculated from the numbers indicated above (n), which indicate the numbers of biological replicates. Statistical significance of intergroup differences is indicated in (F); **** p < 0.0001. Numbers on the left in (A,C,E) indicate positions of molecular weight markers in kDa.
Figure 6
Figure 6
1-Heptanol inhibits mast cell degranulation and calcium mobilization in activated cells. (A) IgE-sensitized BMMCs pretreated for 15 min with vehicle (PBS) alone (Control) or 2.5 mM 1-heptanol were non-activated (time 0 min; n = 8) or activated for 15 min with antigen (TNP-BSA; 0.5 µg/mL; n = 8). The level of β-glucuronidase released into the supernatant was determined using 4-methylumbelliferyl-β-D-glucuronide hydrate as a substrate. (B) In the experiment with reversibility of 1-heptanol action, the cells were treated as in A, but 1-heptanol was washed out before antigen activation. (C) Intracellular calcium mobilization in IgE-sensitized BMMCs in the presence of extracellular calcium and vehicle (Control) or 1-heptanol. BMMCs were loaded for 15 min in the presence of 1.8 mM calcium with Fura 2-AM alone (Control; black line; n = 5) or with 2.5 mM 1-heptanol (red line; n = 5). (D) Alternatively, the cells were loaded for 15 min with Fura-2-AM in the Ca2+-free BSS-BSA in the absence (Control–Ca2+; black line; n = 5) or presence of 2.5 mM 1-heptanol (red line; n = 5). The cells were activated with antigen (Ag, the arrow, TNP-BSA; 0.5 µg/mL) followed by the addition of calcium (final concentration 1.8 mM) at the indicated time interval (blue arrow Ca2+). (E) Intracellular calcium mobilization was analyzed as in C, except that thapsigargin (Th) at a final concentration of 1 µM was used for triggering (n = 4). The extent of calcium mobilization in (C,D) was monitored by measuring the fluorescence ratios. The bars in (A,B) indicate statistically significant intergroup differences. The bars above the curves in (C,D) indicate statistically significant differences between controls and 1-heptanol-treated groups. Values indicate means ± SEM, calculated from n, which show numbers of biological replicates; * p < 0.05, range of *** p < 0.001 **** p < 0.0001.
Figure 7
Figure 7
1-Heptanol decreased calcium mobilization but increased ORAI1-mCherry lateral diffusion in HEK293 cells. (A) Intracellular calcium mobilization in HEK293 cells. The cells were loaded with Fura 2-AM alone (Control; black line; n = 10) or with Fura 2-AM and 2.5 mM 1-heptanol (red line; n = 12) for 15 min. The cells were then activated by adding 1 µM thapsigargin (Th, arrow), and calcium response was monitored by measuring fluorescence ratios. The values indicate means ± SEM. The bars under the curves denote statistically significant differences between control and 1-heptanol-treated cells at the indicated time intervals; ** p < 0.01; *** p < 0.001. (B) 1-Heptanol enhances the membrane mobility of ORAI1 as determined by FRAP. HEK293 cells transfected with ORAI1-mCherry were exposed to the vehicle (BSS-BSA; Control) or 2.5 mM 1-heptanol for 10 min. Representative fluorescence image sequences are from cells at the indicated time points before photobleaching (pre-bleach), at photobleaching (bleach; the circled areas), or after photobleaching (post-bleach; the circled areas). Bars indicate 10 µm. (C) Quantification of the recovery into the photobleached areas as shown in (B). Relative fluorescence intensity was calculated at each time point by dividing the fluorescence in the bleached region by the fluorescence in the corresponding unbleached region. The background was subtracted from all signals. Values in (C) indicate the means ± SEM of two independent experiments for the control cells (n = 14) and 1-heptanol-treated cells (n = 15). Statistical differences between groups in the range ** p < 0.01–**** p < 0.0001 are indicated in (C).
Figure 8
Figure 8
1-Heptanol-induced changes interfere with ORAI1 and STIM1 interactions. (A) The flow-FRET method in HEK293 cells for determining the sensitized FRET emission between EYFP and ECFP pairs. Co-expression of EYFP and ECFP determined a negative FRET signal compared to cells expressing the EYFP–ECFP construct, which corresponds to FRET-positive cells displayed in the triangular gate (FRET-positive gate) as a percentage of transfected cells excited at 405 nm with simultaneous photon collection of ECFP and EYFP emission (shown in third line). The Section 2 and Section 3 provide more details on the method and gating strategy. (B) ORAI1 homomultimers determined by flow-FRET in untreated (n = 3) or 2.5 mM 1-heptanol-treated (+1-heptanol; n = 3) HEK293 cells transfected with ORAI1–ECFP and ORAI1-EYFP. (C) Quantitative analysis of cells in the FRET-positive gate as shown in B. (D) The interaction of STIM1–EYFP with ORAI1–ECFP was determined in cells pretreated with vehicle (BSS-BSA, n = 12) or 2.5 mM 1-heptanol (+1-heptanol; n = 8) using flow-FRET. Then, the transfected cells were activated with thapsigargin at a final concentration of 1 µM; 5 min later, cells in the FRET-positive gate were measured. The rectangles bordered by the green box show the enlarged area in the triangular gate. (E) Quantitative analysis of cells in the FRET-positive gate as shown in (D). Representative flow cytometry profiles are presented. Values indicate means ± SEM calculated from n, which show the numbers of biological replicates; **** p < 0.0001.
Figure 9
Figure 9
Impaired IκB-α phosphorylation and cellular TNF-α expression in 1-heptanol-treated BMMCs. (A) IκB-α phosphorylation (p-IκB-α) and expression of IkB-α and GRB-2 were determined by SDS-PAGE size-fractionation and IB of lysates from BMMCs treated with 2.5 mM 1-heptanol or vehicle (Control) and activated for the indicated time intervals with antigen (TNP-BSA; 0.5 µg/mL; n = 3). Representative immunoblots developed with the corresponding antibodies are shown. (B) The results from the quantification of data as in A normalized to signals in non-activated cells and loading control proteins. (C,D) RT-PCR quantification of TNF-α mRNA ((C); n = 4) and IL-6 ((D); n = 6) in non-activated or antigen-activated (Ag; 0.5 µg/mL; 1h) BMMCs pretreated for 15 min with 2.5 mM 1-heptanol or vehicle (Control). (E,F) The levels of TNF-α (E) and IL-6 (F) released into the supernatant of IgE-sensitized BMMCs pretreated with vehicle (Control; n = 4) or 2.5 mM 1-heptanol (n = 4) and non-activated or activated with antigen (Ag) for 4 h. Values indicate means ± SEM calculated from n, which show the numbers of biological replicates; ** p < 0.01, *** p < 0.001, **** p < 0.0001.
Figure 10
Figure 10
Reduced production of ROS and LTC4 in 1-heptanol-treated cells and the effect of ROS restoration by arachidonic acid on TNF-α production in BMMCs. (A) IgE-sensitized and H2DCFDA-loaded BMMCs were incubated for 15 min in the presence of a vehicle (BSS-BSA; Control; n = 3) or 2.5 mM 1-heptanol (n = 3). BMMCs were then activated with antigen (Ag; 0.5 µg/mL). Fifteen min later, the fluorescence signal was quantified by flow cytometry. (B,C) UPLC MS/MS analysis of arachidonic acid (AA; B) and LTC4 (C) from supernatants of untreated (Control; n = 3) or 1-heptanol-treated (n = 3) antigen-activated BMMCs. (D) IgE-sensitized and H2DCFDA-loaded BMMCs were prepared as in A. BMMCs were then untreated (Control; n = 5) or treated with arachidonic acid (n = 5), antigen (0.5 µg/mL; n = 5), or antigen in combination with arachidonic acid (n = 5). The fluorescence signal was quantified as above. (E) Analysis of cellular TNF-α production by flow cytometry in non-activated IgE-sensitized BMMCs (Control; n = 4), cells exposed for 1.5 h to arachidonic acid (n = 4), antigen alone (n = 4) or antigen and arachidonic acid (n = 4), and concurrently in the presence or absence of 2.5 mM 1-heptanol. Values indicate means ± SEM calculated from n, which show the numbers of biological replicates; * p < 0.05, ** p < 0.01, *** p < 0.001, **** p < 0.0001.
Figure 11
Figure 11
Enhanced expression of HSP70 in 1-heptanol-treated BMMCs and the thermal stability of the plasma membrane in the presence of 1-heptanol and inhibitors affecting HSP70 function or expression. (A) RT-PCR quantification of HSP70 mRNA in non-activated (n = 6) BMMCs pretreated for 15 min with 2.5 mM 1-heptanol or vehicle (Control). (B) HSP70 expression levels in BMMCs untreated (−) or treated (+) with 2.5 mM 1-heptanol for 75 min. (C) Quantitative analysis of the HSP70 levels normalized to β-actin expression as in B. Values are means ± SEM calculated from seven biological replicates. (D) RT-PCR quantification of HSP90 mRNA in non-activated (n = 6) BMMCs pretreated for 15 min with 2.5 mM 1-heptanol or vehicle (Control). (E) Expression levels of HSP90 in control BMMCs and BMMCs treated with 2.5 mM 1-heptanol for 75 min. (F) Quantitative analyses of the HSP90 levels normalized to β-actin expression as in E. Values indicate means ± SEM calculated from seven biological replicates. * p < 0.05. (G) Membrane thermal stability analysis of BMMCs pretreated overnight with vehicle (DMSO; Control; n = 6), HSP inhibitor I (n = 3), or VER 155008 (n = 3) in the absence (0 mM) or presence of 2.5 mM or 5 mM 1-heptanol. (H) Membrane thermal stability analysis of RBL-2H3 cells pretreated overnight with vehicle (DMSO; Control; n = 6), HSP inhibitor I (40 μM, n = 3), or VER 155008 (25 μM, n = 3) in the absence (0 mM) or presence of 2.5 mM or 5 mM 1-heptanol. Cells in (G,H) were exposed to the indicated concentrations of 1-heptanol and PI. The cells were plated in 96-well plates for RT-PCR and incubated for 15 min at 37 °C, followed by PI fluorescence measurement at a slowly increasing temperature in the RT-PCR instrument. Values indicate means ± SEM calculated from n, which show the numbers of biological replicates. Intergroup differences between control and heptanol-treated cells were examined by two-way ANOVA; * p < 0.05, **** p < 0.0001.
Figure 12
Figure 12
Model of a possible mechanism by which 1-heptanol inhibits FcεRI-mediated mast cell activation. FcεRI signaling in control and 1-heptanol-treated cells are shown on the top and bottom, respectively. The initial steps in FcεRI signaling, including FcεRI and PLCγ1 phosphorylation and release of Ca2+ from the endoplasmic reticulum (ER) stores, are similar in control and 1-heptanol-treated cells. However, ORAI1-STIM1 coupling is decreased in 1-heptanol-treated cells activated with antigen, suggesting that the resulting membrane hyperfluidization disrupts CRAC channels. The reduced influx of Ca2+ ions from extracellular space is associated with impaired degranulation and ROS production. In addition, exposure to 1-heptanol leads to overexpression of HSP70 and inhibition of IκB-α and SAPK/JNK phosphorylation, contributing to the inhibition of cytokine production.

Similar articles

References

    1. Brown D.A. Lipid rafts, detergent-resistant membranes, and raft targeting signals. Physiology. 2006;21:430–439. doi: 10.1152/physiol.00032.2006. - DOI - PubMed
    1. Bag N., Wagenknecht-wiesner A., Lee A., Shi S.M., Holowka D.A., Baird B.A. Lipid-based and protein-based interactions synergize transmembrane signaling stimulated by antigen clustering of IgE receptors. Proc. Natl. Acad. Sci. USA. 2021;118:e2026583118. doi: 10.1073/pnas.2026583118. - DOI - PMC - PubMed
    1. Bugajev V., Bambousková M., Dráberová L., Dráber P. What precedes the initial tyrosine phosphorylation of the high affinity IgE receptor in antigen-activated mast cell? FEBS Lett. 2010;584:4949–4955. doi: 10.1016/j.febslet.2010.08.045. - DOI - PubMed
    1. Balint S., Dustin M.L. Localizing order to boost signaling. Elife. 2017;6:e25375. doi: 10.7554/eLife.25375. - DOI - PMC - PubMed
    1. Kovárová M., Tolar P., Arudchandran R., Dráberová L., Rivera J., Dráber P. Structure-function analysis of Lyn kinase association with lipid rafts and initiation of early signaling events after Fcε receptor I aggregation. Mol. Cell Biol. 2001;21:8318–8328. doi: 10.1128/MCB.21.24.8318-8328.2001. - DOI - PMC - PubMed

Publication types