. 2023 Aug 18;12(16):2094.
doi: 10.3390/cells12162094.

Skin-Grafting and Dendritic Cell "Boosted" Humanized Mouse Models Allow the Pre-Clinical Evaluation of Therapeutic Cancer Vaccines

Affiliations

Skin-Grafting and Dendritic Cell "Boosted" Humanized Mouse Models Allow the Pre-Clinical Evaluation of Therapeutic Cancer Vaccines

Bijun Zeng et al. Cells. .

Abstract

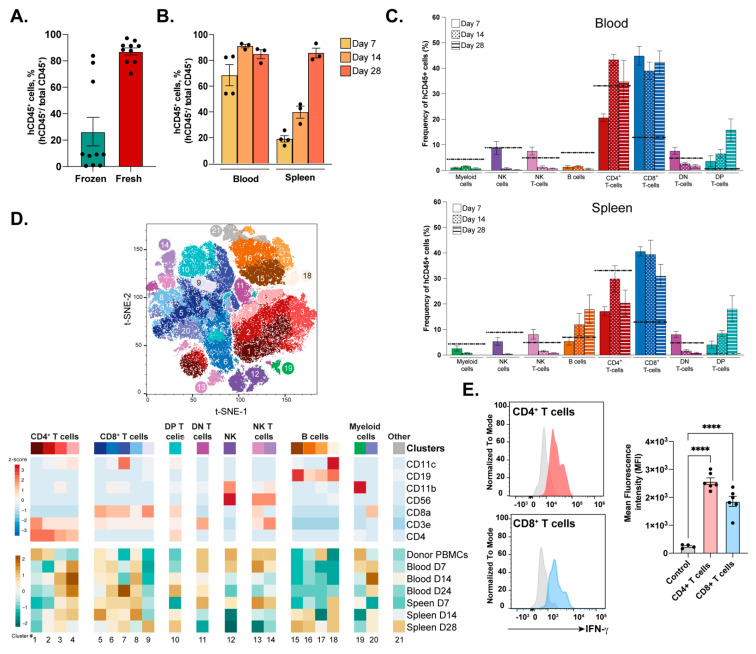
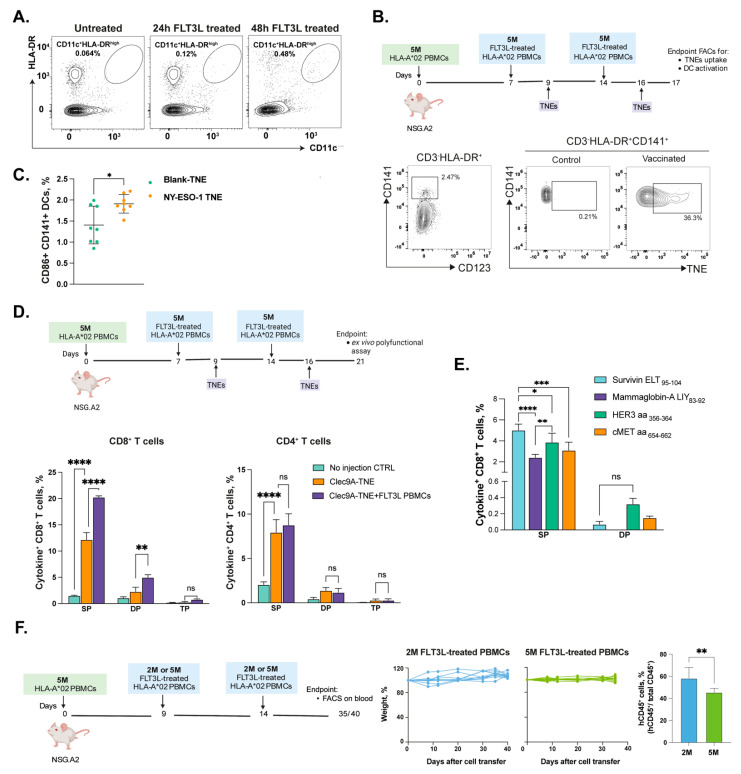
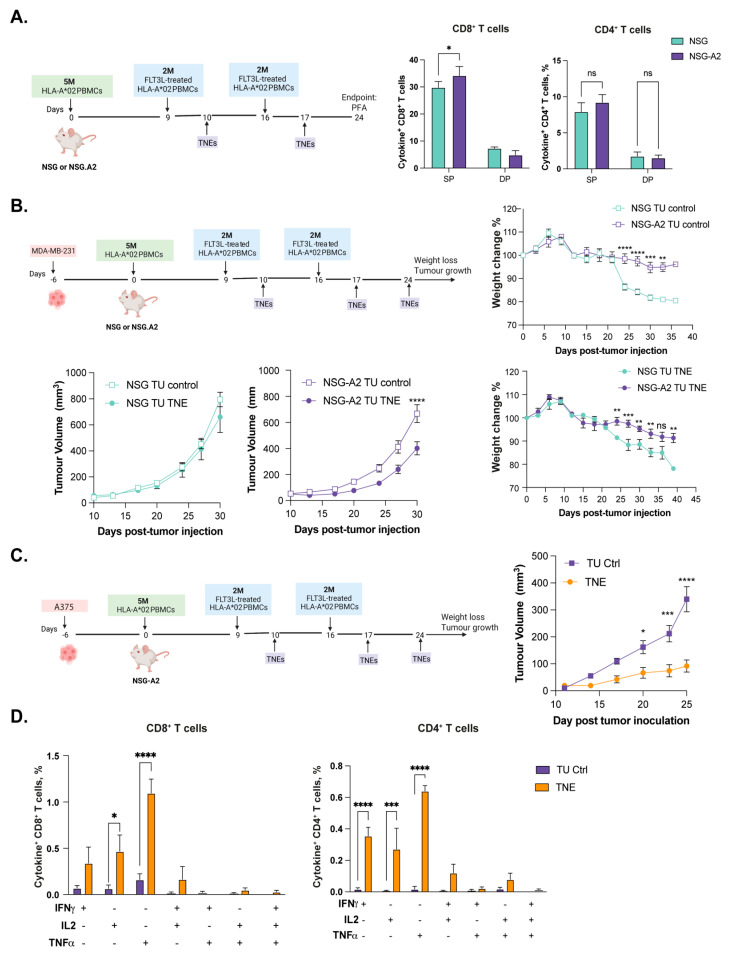
Vaccines have been hailed as one of the most remarkable medical advancements in human history, and their potential for treating cancer by generating or expanding anti-tumor T cells has garnered significant interest in recent years. However, the limited efficacy of therapeutic cancer vaccines in clinical trials can be partially attributed to the inadequacy of current preclinical mouse models in recapitulating the complexities of the human immune system. In this study, we developed two innovative humanized mouse models to assess the immunogenicity and therapeutic effectiveness of vaccines targeting human papillomavirus (HPV16) antigens and delivering tumor antigens to human CD141+ dendritic cells (DCs). Both models were based on the transference of human peripheral blood mononuclear cells (PBMCs) into immunocompromised HLA-A*02-NSG mice (NSG-A2), where the use of fresh PBMCs boosted the engraftment of human cells up to 80%. The dynamics of immune cells in the PBMC-hu-NSG-A2 mice demonstrated that T cells constituted the vast majority of engrafted cells, which progressively expanded over time and retained their responsiveness to ex vivo stimulation. Using the PBMC-hu-NSG-A2 system, we generated a hyperplastic skin graft model expressing the HPV16-E7 oncogene. Remarkably, human cells populated the skin grafts, and upon vaccination with a DNA vaccine encoding an HPV16-E6/E7 protein, rapid rejection targeted to the E7-expressing skin was detected, underscoring the capacity of the model to mount a vaccine-specific response. To overcome the decline in DC numbers observed over time in PBMC-hu-NSG-A2 animals, we augmented the abundance of CD141+ DCs, the specific targets of our tailored nanoemulsions (TNEs), by transferring additional autologous PBMCs pre-treated in vitro with the growth factor Flt3-L. The Flt3-L treatment bolstered CD141+ DC numbers, leading to potent antigen-specific CD4+ and CD8+ T cell responses in vivo, which caused the regression of pre-established triple-negative breast cancer and melanoma tumors following CD141+ DC-targeting TNE vaccination. Notably, using HLA-A*02-matching PBMCs for humanizing NSG-A2 mice resulted in a delayed onset of graft-versus-host disease and enhanced the efficacy of the TNE vaccination compared with the parental NSG strain. In conclusion, we successfully established two humanized mouse models that exhibited strong antigen-specific responses and demonstrated tumor regression following vaccination. These models serve as valuable platforms for assessing the efficacy of therapeutic cancer vaccines targeting HPV16-dysplastic skin and diverse tumor antigens specifically delivered to CD141+ DCs.

Keywords: HPV; T cells; animal models; breast cancer; cancer; dendritic cells; humanized-mouse models; melanoma; vaccine.


Conflict of interest statement

The authors declare no conflict of interest.

Figures

Figure 1
Figure 1
Engraftment and immune profile of transferred PBMCs into NSG-A2 mice by flow cytometry. (A) Proportion of human PBMCs (hCD45+) from total human and mouse hematopoietic cells (total CD45+) in the blood of engrafted NSG-A2 animals 2 weeks post-transference. (B) Percentage of engrafted hCD45+ cells in blood and spleen at 7, 14, and 28 days post-transference. (C) Frequency of several immune cell subsets derived from engrafted human PBMCs at 7, 14, and 28 days post-transference in the blood and spleen of the recipient mice. The dashed line represents the frequency of a particular cell subset in the donor PBMCs. (D) Unbiased clustering based on the expression of seven surface markers represented by different colors on the t-distributed stochastic neighbor embedding plot (t-SNE-1, top) and heat map of the relative fluorescence intensity of a given marker (bottom). The bottom heat map represents the relative abundance of a given cell subset within the hematopoietic compartment and across different time points (D7, D14, and D28) in the donor PBMCs, blood, and spleen samples. Cluster IDs are indicated by numbers. (E) Histogram representation (left) and quantification (right) of IFNγ intracellular expression by ex vivo unstimulated T cells (grey) or stimulated CD4+ and CD8+ T cells extracted from the spleen at 21 days post-PBMC transference. NK, natural killers; DN, double-positive T cells. The data are presented as mean values ± SEM. p < 0.0001 (****) (One-way ANOVA).
Figure 2
Figure 2
Generation and testing of HPV-derived dysplastic skin-grafting humanized mouse model. (A) Generation of skin expressing HPV16 E7 oncogene (NSG-A2_K14E7) and control (NSG.A2_B6) in the NSG-A2 background by crossing B6 or K14E7 animals with NSG-A2 mice (left). H&E staining of the ear skin of the F1 resulting from the cross B6 or K14E7 × NSG-A2 (right). (B) Schematic of the ear skin grafting process onto NSG-A2 recipients and transference of HLA.A*02+ matching PBMCs (left). Examples of controls (NSG-A2) and E7-expressing (NSG-A2_K14E7) well-healed grafts onto the flank of recipient mice (right). (C) Changes in graft size before and after PBMC transference up to 180 days post-skin-grafting. (D) Animal weight is expressed as the percentage of the initial weight. Signs of GvHD are typically manifested when 25% body weight loss is reached. (E) H&E staining of the skin grafts 2 months post-surgery. (F) Quantification of the thickness of the epidermis of skin grafts using H&E images and ImageJ software. The data are presented as mean values ± SEM. p = 0.1234 (ns), 0.0332 (*), 0.0021 (***), <0.0002 (****) (unpaired t test). (G) Immunohistochemistry showing human CD45+ infiltrating cells (purple) in the spleen and skin of grafted PBMC-hu-NSG-A2 animals. (H) Immunofluorescence staining showing human CD3e+ cells (red) infiltrating the spleen of skin-grafted control (no PBMCs were transferred) and humanized animals (PBMC-hu-NSG-A2). (I) Changes in graft size in control animals (NTC-gD2 vaccinated) and test animals (HPV16_E6E7 vaccinated). The data are presented as mean values ± SEM. p = 0.1234 (ns), p < 0.05 (*) (one-way ANOVA). (J) Percentage of IFNγ-expressing CD4+ and CD8+ human T cells (hT cells) resident in the spleen after ex vivo re-stimulation with two pools of five peptides each (Table 3, 1–5 and 5–9 pp), encompassing the entire length of the HPV16 E7 protein. The data are presented as mean values ± SEM. p < 0.05 (*), p < 0.001 (***), p < 0.0001 (****) (unpaired t test). pp = peptide.
Figure 3
Figure 3
Boosting of PBMC-hu-NSG-A2 mice with FLT3-L-treated autologous PBMCs. (A) Representative dot plots of CD11c+HLA-DRhi DCs expansion in human PBMCs after treating with 200 ng/mL of FLT3-L for 24 h or 48 h in vitro. (B,C) NSG-A2 mice were humanized with 5 × 10⁶ HLA-A*02+ PBMCs on day 0 and boosted with FLT3-L-treated autologous PBMCs on days 7 and 14. Dil-labelled F-actin-TNEs or F-actin-TNEs loaded with NY-ESO-1119–143 and NY-ESO-1157–165 epitope peptides were i.v. injected into the humanized mice on days 9 and 16. The spleens were collected on day 17 and processed as detailed in Methods. (B) Representative dot plots of F-actin-TNEs uptaken by splenic CD3negHLA-DR+CD141+ DCs. (C) CD86 expression on CD141+ DCs one day after vaccination. (D) NSG-A2 mice were humanized with 5 × 10⁶ HLA-A*02+ PBMCs on day 0, with or without FLT3-L-treated autologous PBMCs boosting on days 7 and 14. F-actin-TNEs loaded with NY-ESO-1119–143 and NY-ESO-1157–165 epitope peptides were i.v. injected into the humanized mice on days 9 and 16. On day 21, the spleens were harvested and processed as described in Methods. Cytokine production in CD8+ and CD4+ T cells was measured by flow cytometry and intracellular cytokine staining after ex vivo stimulation of splenocytes with NY-ESO-1 epitopes for 6 h. (E) Experiment scheme as per (D) with FLT-L-treated autologous PBMCs boosting on days 7 and 14. F-actin-TNEs loaded with a pool of epitopes consisting of Survivin95–104, Mammaglobin83–92, HER3356–364, and cMET654–662 were i.v. injected into the mice on days 9 and 16. On day 21, the spleens were harvested and processed as described in Methods. Cytokine production in CD8+ and CD4+ T cells was measured by flow cytometry and intracellular cytokine staining after ex vivo stimulation of splenocytes with the individual epitopes listed. SP = single positive = cells expressing one of the cytokines IFNg, IL2, or TNFa; double positive = cells expressing any combination of two cytokines; TP = triple positive = cells co-expressing all three cytokines. (F) NSG-A2 mice were humanized with 5 × 10⁶ HLA-A*02+ PBMCs on day 0 and boosted with 2 × 10⁶ or 5 × 10⁶ FLT3-L-treated autologous PBMCs on days 7 and 14. Graphs show changes in weight and human CD45+ cell engraftment in mice that received different doses of FLT3-L-treated autologous PBMCs boosts. The data are presented as mean values ± SEM. p < 0.05 (*), p < 0.01 (**), p < 0.001 (***), p < 0.0001 (****) (two-way ANOVA).
Figure 4
Figure 4
The boosted PBMC-hu-NSG-A2 model supports therapeutic testing of cancer vaccines. (A) NSG-A2 mice were humanized with 5 × 10⁶ HLA-A*02+ PBMCs on day 0 and boosted 2 × 10⁶ FLT3-L-treated autologous PBMCs on days 7 and 14. F-actin-TNEs loaded with hTERT540–548, Survivin95–104, and Survivin97–111 were i.v. injected into the humanized mice on days 10 and 17. On day 24, the spleens were harvested and processed as described in Methods. Cytokine production in CD8+ and CD4+ T cells was measured by intracellular cytokine staining and flow cytometry after ex vivo peptide stimulation. SP = single positive = cells expressing one of the cytokines IFNg, IL2, or TNFa; double positive = cells expressing any combination of two cytokines; TP = triple positive = cells co-expressing all three cytokines. (B) NSG or NSG-A2 mice were injected with MDA-MB-231 tumor cells orthotopically and humanized with HLA-A*02 PBMCs 6 days after (d0). All mice were boosted with FLT-L-treated autologous PBMCs on days 9 and 16. The mice were then vaccinated with F-actin TNEs loaded with the hTERT540–548, hSurvivin95–104, and hSurvivin97–111 epitopes on days 10, 17, and 24. Tumor growth and weight loss comparison of control (TU control) and vaccinated (TNE) NSG or NSG-A2 mice are reported. (C) NSG-A2 mice were injected with A375 human melanoma cells subcutaneously and humanized with HLA-A*02 PBMCs 6 days after (d0). The mice were boosted with FLT-L-treated autologous PBMCs on days 9 and 16. The mice were then vaccinated with F-actin TNEs loaded with a pool of tumor-associated immunogenic epitopes on days 10, 17, and 24. Tumor growth comparison in mice vaccinated with F-actin TNE (TNE) or unvaccinated (TU Ctrl) is reported. (D) The spleens were collected on day 40, and the cytokine production in splenic CD8+ and CD4+ T cells was measured by flow cytometry upon ex vivo stimulation with a pool of tumor-associated epitopes for 6 h and intracellular cytokine staining. The data are presented as mean values ± SEM p < 0.05 (*), p < 0.01 (**), p < 0.001 (***), p < 0.0001 (****) (two-way ANOVA). TU = tumor-bearing mice.

Similar articles

References

    1. Tay B.Q., Wright Q., Ladwa R., Perry C., Leggatt G., Simpson F., Wells J.W., Panizza B.J., Frazer I.H. Evolution of Cancer Vaccines-Challenges, Achievements, and Future Directions. Vaccines. 2021;9:535. doi: 10.3390/vaccines9050535. - DOI - PMC - PubMed
    1. Mosmann T.R., Coffman R.L. TH1 and TH2 cells: Different patterns of lymphokine secretion lead to different functional prop-erties. Annu. Rev. Immunol. 1989;7:145–173. doi: 10.1146/annurev.iy.07.040189.001045. - DOI - PubMed
    1. Tatsumi T., Kierstead L.S., Ranieri E., Gesualdo L., Schena F.P., Finke J.H., Bukowski R.M., Mueller-Berghaus J., Kirkwood J.M., Kwok W.W. Disease-associated bias in T helper type 1 (Th1)/Th2 CD4+ T cell responses against MAGE-6 in HLA-DRB10401+ patients with renal cell carcinoma or melanoma. J. Exp. Med. 2002;196:619–628. doi: 10.1084/jem.20012142. - DOI - PMC - PubMed
    1. De La Rochere P., Guil-Luna S., Decaudin D., Azar G., Sidhu S.S., Piaggio E. Humanized Mice for the Study of Immuno-Oncology. Trends Immunol. 2018;39:748–763. doi: 10.1016/j.it.2018.07.001. - DOI - PubMed
    1. Chew H.Y., De Lima P.O., Cruz J.L.G., Banushi B., Echejoh G., Hu L., Joseph S.R., Lum B., Rae J., O’donnell J.S., et al. Endocytosis Inhibition in Humans to Improve Responses to ADCC-Mediating Antibodies. Cell. 2020;180:895–914.e27. doi: 10.1016/j.cell.2020.02.019. - DOI - PubMed

Publication types