. 2023 Aug 19;12(16):2101.
doi: 10.3390/cells12162101.

The Adiponectin Receptor Agonist, ALY688: A Promising Therapeutic for Fibrosis in the Dystrophic Muscle

Affiliations

The Adiponectin Receptor Agonist, ALY688: A Promising Therapeutic for Fibrosis in the Dystrophic Muscle

Nicolas Dubuisson et al. Cells. .

Abstract

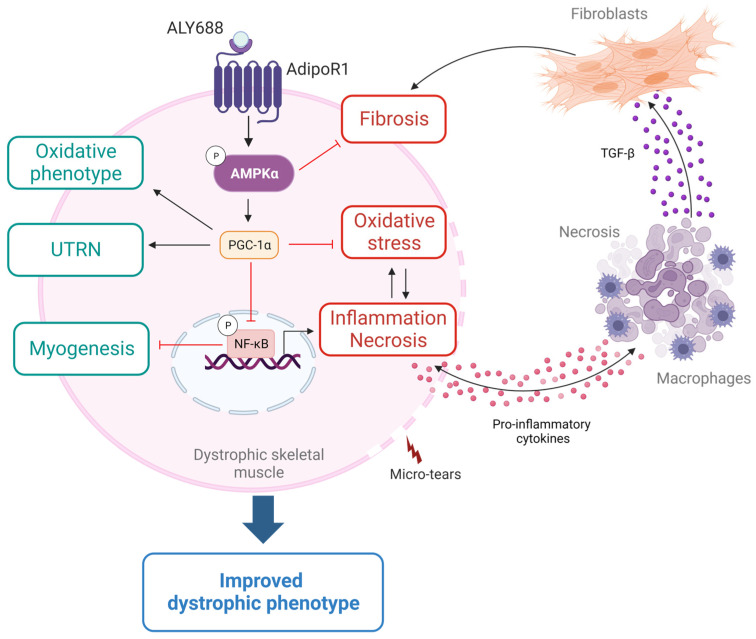
Duchenne muscular dystrophy (DMD) is one of the most devastating myopathies, where severe inflammation exacerbates disease progression. Previously, we demonstrated that adiponectin (ApN), a hormone with powerful pleiotropic effects, can efficiently improve the dystrophic phenotype. However, its practical therapeutic application is limited. In this study, we investigated ALY688, a small peptide ApN receptor agonist, as a potential novel treatment for DMD. Four-week-old mdx mice were subcutaneously treated for two months with ALY688 and then compared to untreated mdx and wild-type mice. In vivo and ex vivo tests were performed to assess muscle function and pathophysiology. Additionally, in vitro tests were conducted on human DMD myotubes. Our results showed that ALY688 significantly improved the physical performance of mice and exerted potent anti-inflammatory, anti-oxidative and anti-fibrotic actions on the dystrophic muscle. Additionally, ALY688 hampered myonecrosis, partly mediated by necroptosis, and enhanced the myogenic program. Some of these effects were also recapitulated in human DMD myotubes. ALY688's protective and beneficial properties were mainly mediated by the AMPK-PGC-1α axis, which led to suppression of NF-κβ and TGF-β. Our results demonstrate that an ApN mimic may be a promising and effective therapeutic prospect for a better management of DMD.

Keywords: ALY688; AMPK; adiponectin; duchenne muscular dystrophy; fibrosis; inflammation; myonecrosis; necroptosis; regeneration; skeletal muscle.


Conflict of interest statement

The authors declare no conflict of interest. The funders had no role in the design of the study; in the collection, analyses, or interpretation of data; in the writing of the manuscript; or in the decision to publish the results.

Figures

Figure 1
Figure 1
ALY688 treatment improves muscle function and endurance of mdx mice. Four groups of mice were compared at the age of 11 weeks: WT, mdx (untreated), mdx treated with ALY688 3 mg/kg (mdx-T3) and mdx treated with ALY688 15 mg/kg (mdx-T15) mice. Functional tests were carried out in vivo. (A) Mice were subjected to a wire test where they were suspended by their limbs and the time until they completely released the wire and fell was registered (s). This time was then normalised to body weight (kgBW × s). (B) Mice were lowered on a grid connected to a sensor to measure the muscle force of their four limbs; data were then expressed in gram-force relative to gram-body weight (gF/gBW). (C) Mice were placed on a moving belt and encouraged to run to exhaustion with an uphill inclination of 5° and a gradually increasing speed. The mice started by running 10 min at a pace of 20 cm/s (step 1), then 5 min at 25 cm/s (step 2), followed by 5 min at 30 cm/s (step 3) and finally 5 min at a maximum speed set up at 35cm/s (step 4). The distance covered in meters (m) was recorded either after exhaustion or at the end of the test. (D) Treadmill exhaustion test’s success rate. Data are means ± SEM; n = 8–10 mice for all experiments. Statistical analysis was performed using a one-way ANOVA followed by Tukey’s test. ** p < 0.01, *** p < 0.001, **** p < 0.0001 vs. WT mice. $ p = 0.08, # p < 0.05, ### p < 0.001, #### p < 0.001 vs. mdx mice.
Figure 2
Figure 2
ALY688 treatment reduces muscle inflammation and oxidative stress in mdx mice. Immunohistochemistry was performed on G muscles of the 4 groups of mice. Sections were stained with specific antibodies directed against two pro-inflammatory cytokines (IL-1β and TNFα), two oxidative stress markers (HNE and PRDX3) and one pan-macrophage marker (CD68). Representative sections for 6 mice per group is shown. Scale bars = 50 μm.
Figure 3
Figure 3
ALY688 treatment reduces muscle inflammation and oxidative stress in mdx mice. (AE) Immunohistochemistry quantification of IL-1β, TNFα, HNE, PRDX3 and CD68 on G muscles in the 4 groups of mice. Data are calculated as the percentage area stained by DAB, then presented as relative expression compared to WT mice (RE). (F,G) ELISA quantification of TNFα and HNE protein levels in whole Q muscle homogenates; data are then presented as RE. Results are means ± SEM; n = 6 mice per group for all experiments. Statistical analysis was performed using a one-way ANOVA followed by Tukey’s test. * p < 0.05, ** p < 0.01, *** p < 0.001, **** p < 0.0001 vs. WT mice. # p < 0.05, ## p < 0.01, #### p < 0.0001 vs. mdx mice.
Figure 4
Figure 4
Quantification of myonecrosis in muscle sections of mdx mice. (A) H&E-stained transverse sections of paraffin-embedded TA muscles. Areas of myonecrosis (indicated by white arrows) encompass both muscle fibres with fragmented sarcoplasm and inflammatory cells. (B) Quantification is calculated as the proportion (%) of whole muscle section area occupied by myonecrosis, then presented as relative expression compared to WT mice (RE). (C) ELISA assays were used to quantify P-RIP, a marker of necroptosis on Q muscle; data are then presented as RE. Results are means ± SEM; n = 6 mice per group for all experiments. Statistical analysis was performed using a one-way ANOVA followed by Tukey’s test. * p < 0.05, **** p < 0.0001 vs. WT mice. ## p < 0.05, ### p < 0.01 vs. mdx mice. Scale bars: 100 µm.
Figure 5
Figure 5
ALY688 treatment increases the number of revertant myofibres and enhances the myogenic program in mdx mice. Immunofluorescence staining, mRNA and protein abundance measurements were performed on Q muscles in the 4 groups of mice. (A) Sections were stained with specific antibodies directed against dystrophin (in green). Nuclei were counterstained with DAPI (blue). Scale bars = 20 μm. (BD) Quantification of dystrophin-positive revertant fibres (RF). The number of RFs per section was counted according to the following categories: (B) the % of RFs, (C) the number of RF clusters and (D) the maximum number of RFs in a single cluster. (E) mRNA levels of Mrf4, a marker of late muscle differentiation was quantified, normalised to Cyclophilin and then presented as relative expression (RE) compared to WT values. (F,G) Protein levels of Myogenin, a differentiation marker, and Myh7, a marker of slow-twitch oxidative type I fibres, were measured by ELISA; data are then presented as RE. Results are means ± SEM n = 6 mice per group for all experiments. Statistical analysis was performed using a one-way ANOVA followed by Tukey’s test (or Dunnett’s test for BD). N/A, not applicable. * p < 0.05, ** p < 0.01, *** p < 0.001, **** p < 0.0001 vs. WT mice. $ p = 0.09, + p = 0.07, # p < 0.05, ## p < 0.01, ### p < 0.001, #### p < 0.0001 vs. mdx mice.
Figure 6
Figure 6
ALY688 treatment markedly reduces muscle fibrosis in mdx mice. Experiments were performed on Q muscles from the four groups of mice. (A) Picrosirius red staining. Scale bars = 100 μm. (B) Quantification of Picrosirius red (expressed as % of collagen-stained area). (C,D) ELISA assays were used to quantify TGF-β, a marker of extracellular matrix production, and phosphorylated-Smad2 (P-Smad2), an effector of the TGF-β pathway. (E,F) mRNA levels of COL1A1 and COL3A1. These levels were normalised to Cyclophilin. Results for TGF-β, P-Smad2, COL1A1 and COL3A1 were presented as relative expression (RE) compared to WT values. Data are means ± SEM; n = 6 mice per group for all experiments. Statistical analysis was performed using a one-way ANOVA followed by Tukey’s test. * p < 0.05, *** p < 0.001, **** p < 0.001 vs. WT mice. # p < 0.05, ## p < 0.01, #### p < 0.0001 vs. mdx mice.
Figure 7
Figure 7
ALY688 treatment activates key effectors of the AMPK-PGC-1α axis in mdx mice. Experiments were performed on TA from the four groups of mice. (A) Levels of AMPK activity, (B) PGC-1α protein, (C) NF-κB activity (P-p65 subunit) and (D) UTRN protein quantified by ELISAs. Absorbance data are presented as relative expression (RE) compared with WT values. Data are means ± SEM; n = 6 mice per group for all experiments. Statistical analysis was performed using a one-way ANOVA followed by Tukey’s test. ** p < 0.01, **** p < 0.0001 vs. WT mice. # p < 0.05, ## p < 0.01, #### p < 0.0001 vs. mdx mice.
Figure 8
Figure 8
ALY688 recapitulates its anti-inflammatory and pro-UTRN effects in human DMD myotubes, via its action on AdipoR1. (AC) Dose-response curves illustrating the effects of ALY688 on IL-1β, TNFα and UTRN mRNA levels in primary cultures of myotubes obtained from DMD patients. Cells were treated or not with several concentrations of ALY688 (from 10 pM to 300 nM) for 24 h, while being challenged with an inflammatory cocktail (human recombinant TNFα/INFγ, each at 15 ng/mL). mRNA levels were normalised to human TBP. Data were then presented as % of the maximal levels obtained either without (A,B) or with 300 nM ALY688 (C). (DF) In some experiments, cells were first transfected (24 h) with siRNA against AdipoR1 (50 nM) or a negative [non-targeting, siNT (50 nM)] control and then treated with ALY688 (100 nM) combined to inflammation (TNFα/IFNγ) for an additional 24 h. After normalisation, mRNA levels were presented as relative expression (RE) to siNT conditions (DF). Data are means ± SEM for 4 cultures, each obtained from a different donor (i.e., 4 DMD subjects). Statistical analysis was performed using repeated measures of ANOVA followed by Dunnett’s test (AC) or a two-tailed paired Student’s t-test (DF). * p < 0.05, ** p < 0.01 vs. siNT.
Figure 9
Figure 9
ALY688 treatment recapitulates its effects on key effectors of the AMPK signalling in human DMD myotubes, via its action on AdipoR1. (AC) Dose-response curves illustrating the effects of ALY688 on AMPK and NF-κB activity (P-p65 subunit) and UTRN protein levels in primary cultures of myotubes obtained from DMD patients. Cells were treated or not with several concentrations of ALY688 (from 10 pM to 300 nM) for 24 h, while being challenged with an inflammatory cocktail (human recombinant TNFα/INFγ, each at 15 ng/mL). Levels of each protein were measured by ELISAs and then presented as % of the maximum achieved either without (B) or with 300 nM ALY688 (AC). (DF) In some experiments, cells were first transfected (24 h) with siRNA against AdipoR1 (50 nM) or a negative [non-targeting, siNT (50 nM)] control and then treated with ALY688 (100 nM) combined to inflammation (TNFα/IFNγ) for an additional 24 h. For each protein, levels were presented as relative expression (RE) compared with siNT conditions. Data are means ± SEM for 4 cultures, each obtained from a different donor (i.e., 4 DMD subjects). Statistical analysis was performed using repeated measures of ANOVA followed by Dunnett’s test or using a two-tailed paired Student’s t-test. * p < 0.05, ** p < 0.01 vs. siNT.
Figure 10
Figure 10
Comparison of two adiponectin receptor agonists (ALY688 and AdipoRon) in challenged myotubes from DMD patients. Myotubes were either left untreated or treated with AdipoRon (25 µM) or ALY688 (100 nM) for 24 h, while being challenged or not with an inflammatory cocktail [TNFα (15 ng/mL) + (IFNγ) (15 ng/mL)]. (AC) mRNA levels of pro-inflammatory genes (IL-1β and TNFα) and UTRN. mRNA levels were normalised to human TBP and the subsequent ratios were presented as relative expression (RE) compared with the control condition (i.e., no compound, no inflammation). (DF) Levels of AMPK and NF-κB activity (P-p65 subunit), and UTRN protein, were quantified by ELISAs and presented as relative expression (RE) compared with control. Data are means ± SEM for 4 cultures, each obtained from a different donor (i.e., 4 DMD subjects). Statistical analysis was performed using a one-way ANOVA followed by Tukey’s test. ** p < 0.01, *** p < 0.001, **** p < 0.0001 vs. Control. # p < 0.05, ## p < 0.01, ### p < 0.001, #### p < 0.0001 vs. Inflammation. $$$ p < 0.001 vs. AdipoRon.
Figure 11
Figure 11
Proposed model for the effects of ALY688 in DMD. This figure summarises the effects and the mechanism of action of ALY688 on the dystrophic skeletal muscle, which is characterised by micro-tears in the sarcolemma due to lack of dystrophin protein. Briefly, binding of ALY688 to AdipoR1 will activate AMPK-PGC-1α pathway. Then, PGC-1α represses NF-κB activity resulting in a reduction in inflammation and necrosis, as well as in an improved myogenic program. In addition, the activation of the AMPK-PGC-1α axis will help mediate several effects of ALY688. First, increased muscle oxidative capacity and function. Second, increased expression and production of utrophin (UTRN) and reduced oxidative stress, which would protect the dystrophic muscle. Third, marked decrease in TGF-β levels and signalling pathways, either directly or indirectly by reducing inflammation, and subsequently blunted muscle fibrosis. These beneficial and protective properties will thus lead to an improved dystrophic phenotype. All these effects have been demonstrated on skeletal muscle from mdx mice and/or confirmed in human DMD myotubes. Pointed head black arrows indicate activation or induction, while blunt head red arrows indicate inhibition. Boxes with processes in green represent net beneficial effects of ALY688, while boxes with processes in red represent deleterious factors inhibited by ALY688. Created with BioRender.com.

Similar articles

Cited by

References

    1. Blake D.J., Weir A., Newey S.E., Davies K.E. Function and genetics of dystrophin and dystrophin-related proteins in muscle. Physiol. Rev. 2002;82:291–329. doi: 10.1152/physrev.00028.2001. - DOI - PubMed
    1. Ryder S., Leadley R.M., Armstrong N., Westwood M., de Kock S., Butt T., Jain M., Kleijnen J. The burden, epidemiology, costs and treatment for Duchenne muscular dystrophy: An evidence review. Orphanet J. Rare Dis. 2017;12:79. doi: 10.1186/s13023-017-0631-3. - DOI - PMC - PubMed
    1. Acharyya S., Villalta S.A., Bakkar N., Bupha-Intr T., Janssen P.M., Carathers M., Li Z.W., Beg A.A., Ghosh S., Sahenk Z., et al. Interplay of IKK/NF-kappaB signaling in macrophages and myofibers promotes muscle degeneration in Duchenne muscular dystrophy. J. Clin. Investig. 2007;117:889–901. doi: 10.1172/JCI30556. - DOI - PMC - PubMed
    1. Klingler W., Jurkat-Rott K., Lehmann-Horn F., Schleip R. The role of fibrosis in Duchenne muscular dystrophy. Acta Myol. 2012;31:184–195. - PMC - PubMed
    1. Abou-Samra M., Selvais C.M., Dubuisson N., Brichard S.M. Adiponectin and Its Mimics on Skeletal Muscle: Insulin Sensitizers, Fat Burners, Exercise Mimickers, Muscling Pills… or Everything Together? Int. J. Mol. Sci. 2020;21:2620. doi: 10.3390/ijms21072620. - DOI - PMC - PubMed

Publication types

LinkOut - more resources