. 2023 Aug 19;12(16):2105.
doi: 10.3390/cells12162105.

Effect of Expansion Media on Functional Characteristics of Bone Marrow-Derived Mesenchymal Stromal Cells

Affiliations

Effect of Expansion Media on Functional Characteristics of Bone Marrow-Derived Mesenchymal Stromal Cells

Viktoria Jakl et al. Cells. .

Abstract

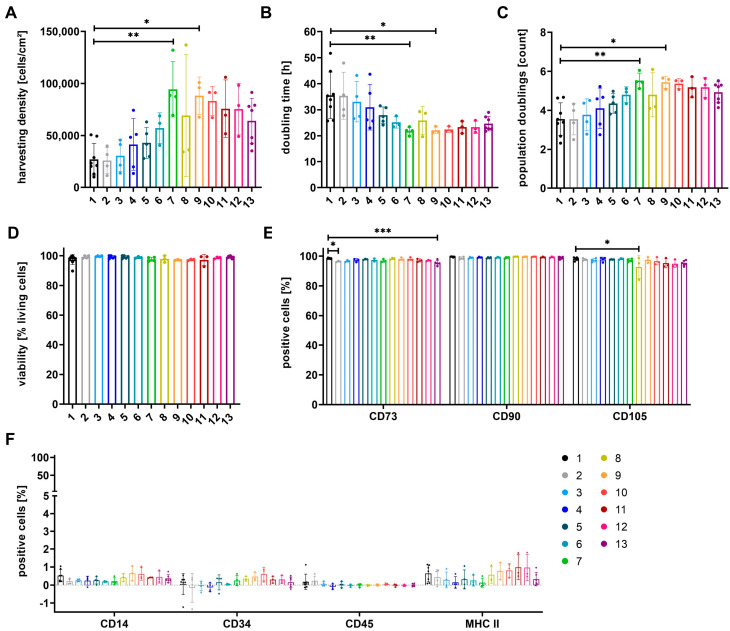
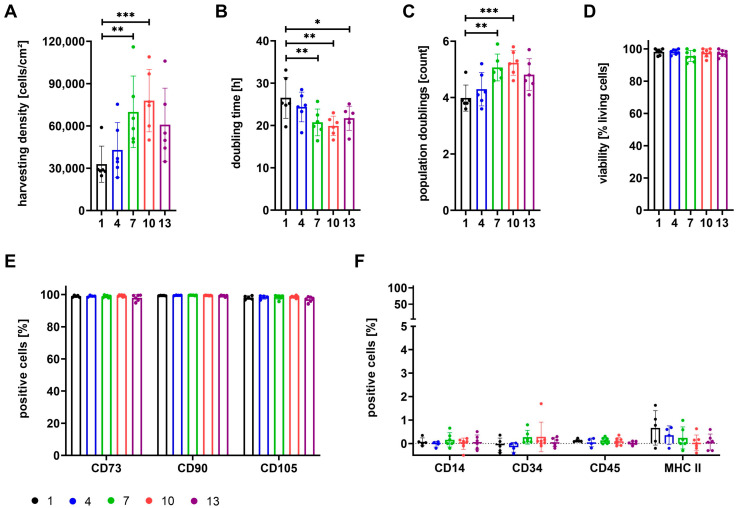
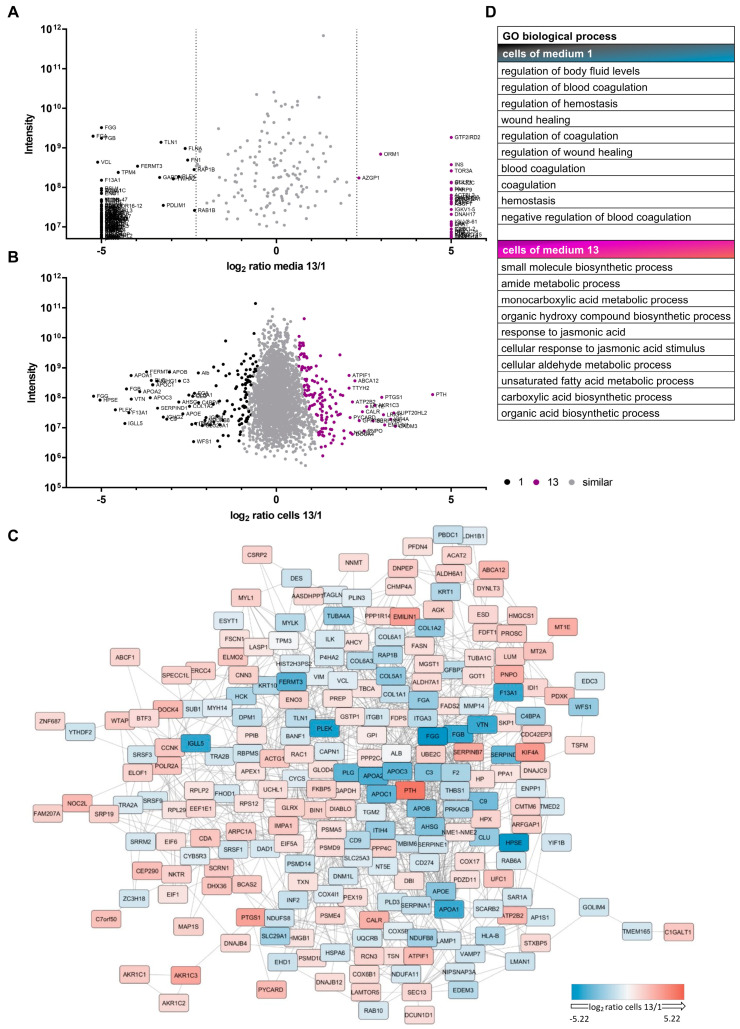
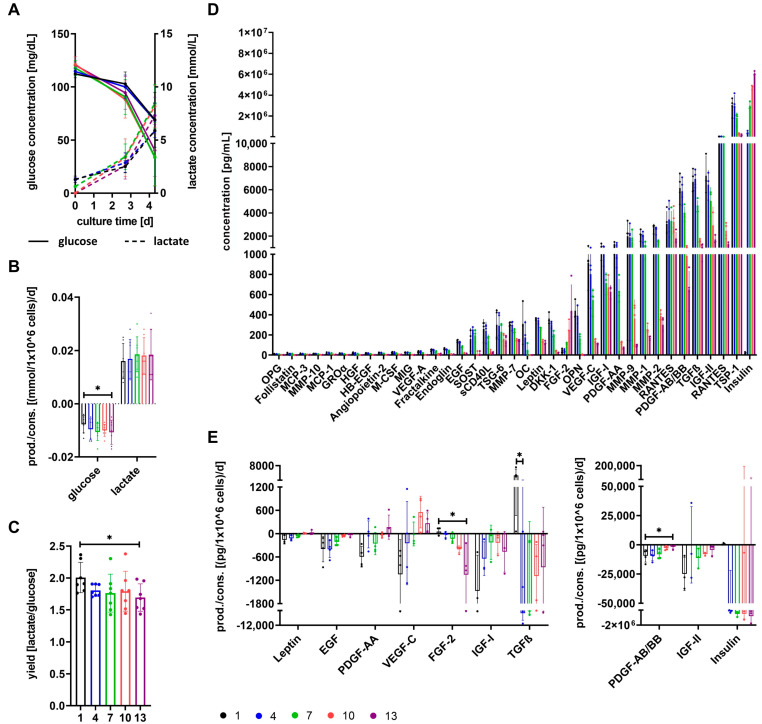
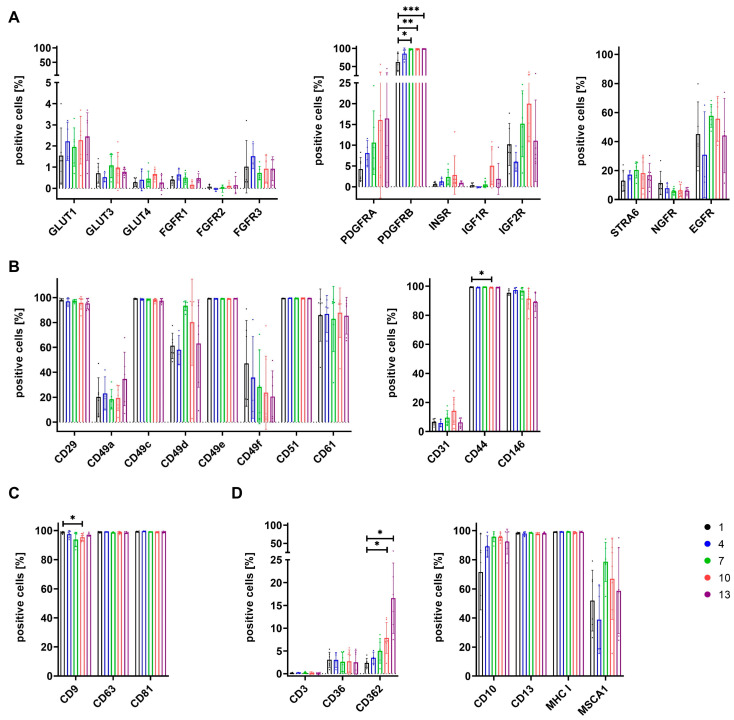
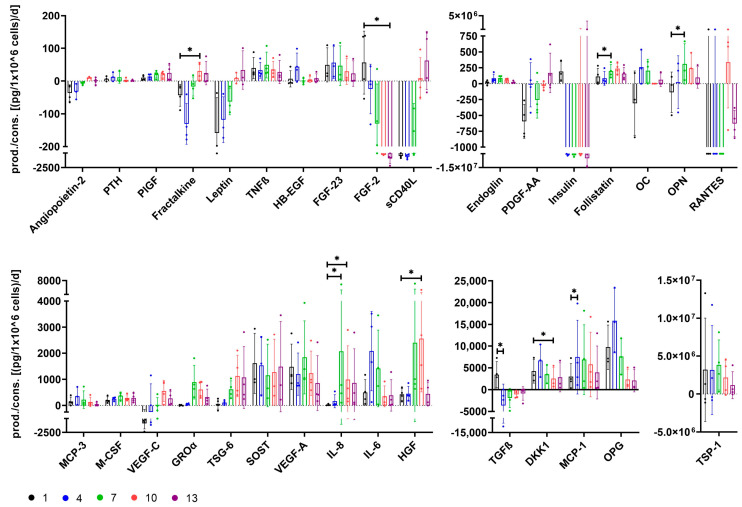
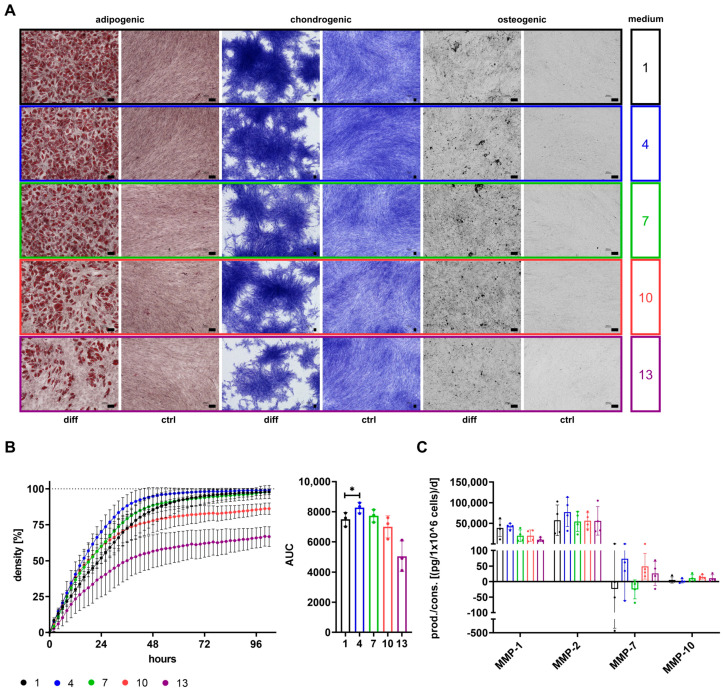
The therapeutic efficacy of mesenchymal stromal cells (MSCs) has been shown to rely on their immunomodulatory and regenerative properties. In order to obtain sufficient numbers of cells for clinical applications, MSCs have to be expanded ex vivo. Expansion media with xenogeneic-free (XF) growth-promoting supplements like human platelet lysate (PL) or serum- and xenogeneic-free (SF/XF) formulations have been established as safe and efficient, and both groups provide different beneficial qualities. In this study, MSCs were expanded in XF or SF/XF media as well as in mixtures thereof. MSCs cultured in these media were analyzed for phenotypic and functional properties. MSC expansion was optimal with SF/XF conditions when PL was present. Metabolic patterns, consumption of growth factors, and secretome of MSCs differed depending on the type and concentration of supplement. The lactate per glucose yield increased along with a higher proportion of PL. Many factors in the supernatant of cultured MSCs showed distinct patterns depending on the supplement (e.g., FGF-2, TGFβ, and insulin only in PL-expanded MSC, and leptin, sCD40L PDGF-AA only in SF/XF-expanded MSC). This also resulted in changes in cell characteristics like migratory potential. These findings support current approaches where growth media may be utilized for priming MSCs for specific therapeutic applications.

Keywords: media; mesenchymal stem cells; mesenchymal stromal cells; platelet lysate; serum-free; xenogeneic-free.


Conflict of interest statement

The authors declare no conflict of interest. The funders had no role in the design of the study; in the collection, analyses, or interpretation of data; in the writing of the manuscript; or in the decision to publish the results.

Figures

Figure 1
Figure 1
Expansion parameters and basic characterization of MSCs grown in media 1 to 13. MSCs, primarily isolated in medium αMEM+8%PL, were expanded in media 1 to 13 (for composition see Table 1; colors as indicated in scheme) for P3. The expansion parameters harvesting density (A), doubling time (B), and number of population doublings (C) were determined in addition to the viability of cells (D). The expression of identity markers (CD73, CD90, and CD105) (E) and purity markers (CD14, CD34, CD45, and MHC II) (F) was analyzed by flow cytometry. Data are presented as mean ± SD and N ≥ 3 independent experiments were performed. Statistically significant differences are depicted as follows: *: p < 0.05; **: p < 0.01; ***: p < 0.001.
Figure 2
Figure 2
Expansion parameters and basic characterization of MSCs grown in media 1, 4, 7, 10, and 13. MSCs were isolated and subsequently expanded in media 1 (100% αMEM+8%PL; black), 4 (95% αMEM+8%PL + 5% StemMACSTM; blue), 7 (50% αMEM+8%PL + 50% StemMACSTM; green), 10 (5% αMEM+8%PL + 95% StemMACSTM; red) and 13 (100% StemMACSTM; violet) for P1. The expansion parameters harvesting density (A), doubling time (B), and number of population doublings (C) were determined in addition to the viability of cells (D). The expression of identity markers (CD73, CD90, and CD105) (E) and purity markers (CD14, CD34, CD45, and MHC II) (F) was analyzed by flow cytometry. Data are presented as mean ± SD and N ≥ 4 independent experiments were performed. Statistically significant differences are depicted as follows: *: p < 0.05; **: p < 0.01; ***: p < 0.001.
Figure 3
Figure 3
Proteomic analyses of media and MSCs. MSCs, isolated and expanded in αMEM+8%PL (medium 1; black) or StemMACSTM (medium 13; violet), and respective media were used for proteomic analyses. Log2 ratio of proteins identified in media 1 and 13 (A) or expressed by cells grown in media 1 and 13 (B) are illustrated. Proteins with similar quantity or expression are shown as gray dots, proteins with high quantity in medium 1 (A) or highly expressed in cells grown in medium 1 (B) are shown as black dots and those with high quantity in medium 13 (A) or high expression in cells grown in medium 13 (B) are shown as violet dots, respectively. (C) Differentially expressed proteins shown in (B) were queried for known interactions on StringDb [60] and visualized. (D) Expressed proteins seem to play a role in various biological processes based on gene ontology (GO) enrichment analysis.
Figure 4
Figure 4
Consumption and production of metabolic factors by MSCs. MSCs were grown in media 1 (100% αMEM+8%PL; black), 4 (95% αMEM+8%PL + 5% StemMACSTM; blue), 7 (50% αMEM+8%PL + 50% StemMACSTM; green), 10 (5% αMEM+8%PL + 95% StemMACSTM; red) and 13 (100% StemMACSTM; violet). (A) Glucose and lactate concentrations were determined in media at the beginning of the cell cultures (d0) and in conditioned media at the time point of media exchange (d2–3) and harvesting of cells (d4–6). Glucose consumption and lactate production of one million cells per day (B) and the yield of lactate per glucose (C) were analyzed for the time between media exchange and harvesting of cells. (D) Concentrations of the factors OPG, follistatin, MCP-3, MMP-10, MCP-1, GROα, HGF, HB-EGF, angiopoietin-2, M-CSF, MIG, VEGF-A, fractalkine, endoglin, EGF, SOST, sCD40L, TSG-6, MMP-7, OC, leptin, DKK1, FGF-2, OPN, VEGF-C, IGF-I, PDGF-AA, MMP-9, MMP-1, MMP-2, RANTES, PDGF-AB/BB, TGFβ, IGF-II, TSP-1, and insulin were analyzed in media. (E) Consumption and production of growth factors EGF, PDGF-AA, VEGF-C, FGF-2, IGF-I, TGFβ, PDGF-AB/BB and IGF-II, as well as hormones leptin and insulin, was calculated between media exchange and harvesting of cells and normalized to 1 × 10⁶ MSC/24 h. Data are presented as mean ± SD and N ≥ 3 independent experiments were performed (except for analysis of MIG (all media) and IGF-II (medium 10)). Statistically significant differences are depicted as follows: *: p < 0.05.
Figure 5
Figure 5
Surface antigen expression by MSCs grown in media 1, 4, 7, 10, and 13. MSCs grown in media 1 (100% αMEM+8%PL; black), 4 (95% αMEM+8%PL + 5% StemMACSTM; blue), 7 (50% αMEM+8%PL + 50% StemMACSTM; green), 10 (5% αMEM+8%PL + 95% StemMACSTM; red), and 13 (100% StemMACSTM; violet) were analyzed for the expression of different surface antigens. These included metabolism-related markers GLUT1, GLUT3, GLUT4, FGFR1, FGFR2, FGFR3, PDGFRA, PDGFRB, INSR, IGF1R, IGF2R, STRA6, NGFR, and EGFR (A), cell adhesion-related markers CD29, CD49a, CD49c, CD49d, CD49e, CD49f, CD51, CD61, CD31, CD44, and CD146 (B), tetraspanins CD9, CD63, and CD81 (C), as well as the additional markers CD3, CD36, CD362, CD10, CD13, MHC I, and MSCA1 (D). Data are presented as mean ± SD and N ≥ 3 independent experiments were performed. Statistically significant differences are depicted as follows: *: p < 0.05; **: p < 0.01; ***: p < 0.001.
Figure 6
Figure 6
Secretion of functional factors by MSCs grown in media 1, 4, 7, 10, and 13. MSCs were grown in media 1 (100% αMEM+8%PL; black), 4 (95% αMEM+8%PL + 5% StemMACSTM; blue), 7 (50% αMEM+8%PL + 50% StemMACSTM; green), 10 (5% αMEM+8%PL + 95% StemMACSTM; red) and 13 (100% StemMACSTM; violet). The secretion of factors angiopoietin-2, PTH, PlGF, fractalkine, leptin, TNFβ, HB-EGF, FGF-23, FGF-2, sCD40L, endoglin, PDGF-AA, insulin, follistatin, OC, OPN, RANTES, MCP-3, M-CSF, VEGF-C, GROα, TSG-6, SOST, VEGF-A, IL-8, IL-6, HGF, TGFβ, DKK1, MCP-1, OPG and TSP-1 was analyzed for the period between media exchange and harvesting of cells and normalized to 1 × 10⁶ MSC/24 h. *: p < 0.05.
Figure 7
Figure 7
Differentiation and migration potential of MSCs grown in media 1, 4, 7, 10, and 13. MSCs were expanded in media 1 (100% αMEM+8%PL; black), 4 (95% αMEM+8%PL + 5% StemMACSTM; blue), 7 (50% αMEM+8%PL + 50% StemMACSTM; green), 10 (5% αMEM+8%PL + 95% StemMACSTM; red) and 13 (100% StemMACSTM; violet) and analyzed for their differentiation potential and migratory capacity. (A) MSCs were differentiated into cells of adipogenic, chondrogenic, and osteogenic lineages by culture in specific differentiation media (diff). Control cells were expanded in αMEM+20%FCS (ctrl). Cells of adipogenic differentiation were stained by Oil Red O and hematoxylin. Methylene blue staining was performed to detect chondrogenic differentiation. Activity of alkaline phosphatase was visualized by 5-bromo-4-chloro-3-indolylphosphate (BCIP)/nitroblue tetrazolium (NBT) substrate to detect osteogenic differentiation. Pictures of cells were taken by an inverted phase contrast microscope with 4 times (chondrogenic) and 10 times (adipogenic and osteogenic) magnification, respectively. Black scale bars indicate 100 µm. (B) Migratory potential of cells was investigated by a scratch wound assay. For this, cells were grown in media 1, 4, 7, 10, and 13 in a 96-well plate until confluence of cell cultures was reached. A scratch wound area was created into the cell layer and migration of cells was analyzed for 96 h. Relative cell density was identified by IncuCyte® S3 Live-Cell Analysis system. The area under the curve (AUC) was determined for observed analyses curves of wound density over time. (C) The secretion of MMP-1, MMP-2, MMP-7, and MMP-10 was analyzed for cells grown in media 1, 4, 7, 10, and 13. Data are presented as mean ± SD and N = 2 (A) or N ≥ 3 (B,C) independent experiments were performed. Statistically significant differences are depicted as follows: *: p < 0.05. Representative images were chosen for differentiation assays.

References

    1. Friedenstein A.J., Gorskaja J.F., Kulagina N.N. Fibroblast Precursors in Normal and Irradiated Mouse Hematopoietic Organs. Exp. Hematol. 1976;4:267–274. - PubMed
    1. Pittenger M.F., Mackay A.M., Beck S.C., Jaiswal R.K., Douglas R., Mosca J.D., Moorman M.A., Simonetti D.W., Craig S., Marshak D.R. Multilineage Potential of Adult Human Mesenchymal Stem Cells. Science. 1999;284:143–147. doi: 10.1126/science.284.5411.143. - DOI - PubMed
    1. Dominici M., Le Blanc K., Mueller I., Slaper-Cortenbach I., Marini F., Krause D., Deans R., Keating A., Prockop D., Horwitz E. Minimal Criteria for Defining Multipotent Mesenchymal Stromal Cells. The International Society for Cellular Therapy Position Statement. Cytotherapy. 2006;8:315–317. doi: 10.1080/14653240600855905. - DOI - PubMed
    1. Soler R., Orozco L., Munar A., Huguet M., Lopez R., Vives J., Coll R., Codinach M., Garcia-Lopez J. Final Results of a Phase I-Ii Trial Using Ex Vivo Expanded Autologous Mesenchymal Stromal Cells for the Treatment of Osteoarthritis of the Knee Confirming Safety and Suggesting Cartilage Regeneration. Knee. 2016;23:647–654. doi: 10.1016/j.knee.2015.08.013. - DOI - PubMed
    1. Gjerde C., Mustafa K., Hellem S., Rojewski M., Gjengedal H., Yassin M.A., Feng X., Skaale S., Berge T., Rosen A., et al. Cell Therapy Induced Regeneration of Severely Atrophied Mandibular Bone in a Clinical Trial. Stem Cell Res. Ther. 2018;9:213. doi: 10.1186/s13287-018-0951-9. - DOI - PMC - PubMed

Publication types

LinkOut - more resources