. 2023 Aug 5;12(8):1093.
doi: 10.3390/biology12081093.

Combined Use of a Bacterial Consortium and Early-Colonizing Plants as a Treatment for Soil Recovery after Fire: A Model Based on Los Guájares (Granada, Spain) Wildfire

Affiliations

Combined Use of a Bacterial Consortium and Early-Colonizing Plants as a Treatment for Soil Recovery after Fire: A Model Based on Los Guájares (Granada, Spain) Wildfire

Marla Niza Costa et al. Biology (Basel). .

Abstract

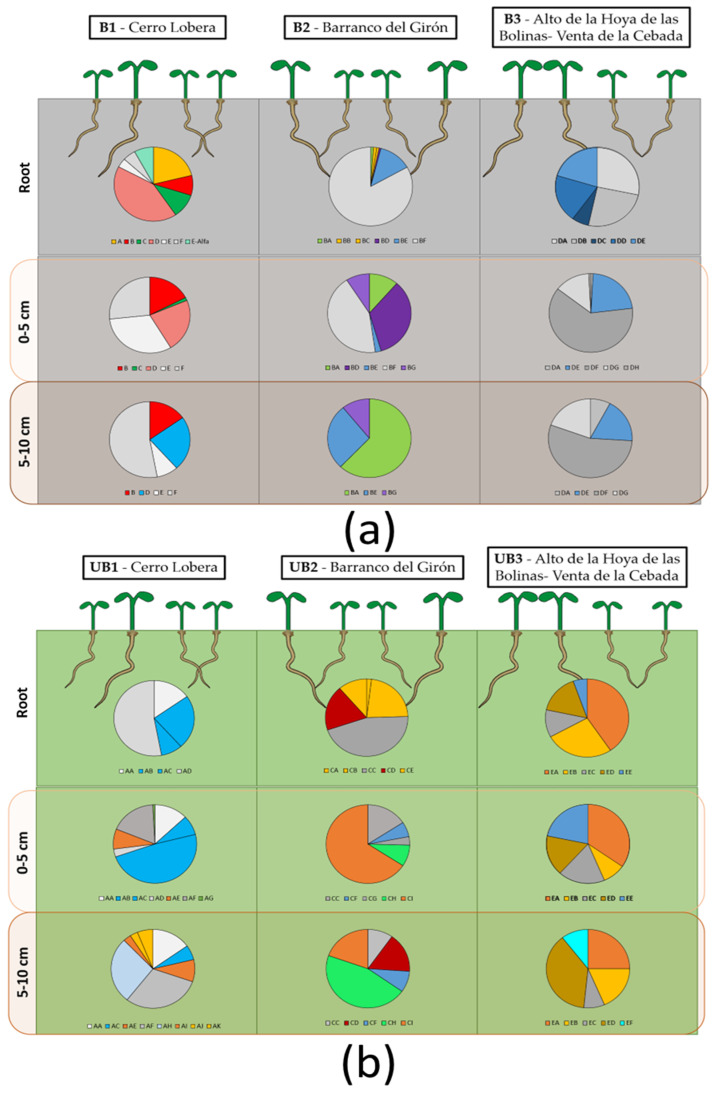
During 2022, intense heat waves, together with particularly extreme dry conditions, created a propitious scenario for wildfires, resulting in the area of vegetation consumed in Europe doubling. Mediterranean countries have been particularly affected, reaching 293,155 hectares in Spain, the worst data in the last 15 years. The effects on the vegetation and the soil are devastating, so knowing the recovery factors is essential for after-fire management. Resilient microorganisms play a fundamental role in rapid nutrient recycling, soil structure, and plant colonization in fire-affected soils. In this present work, we have studied emergent microbial communities in the case of the Los Guájares (Granada, Spain) fire, one of the most extensive of the year, to evaluate their role in the recovery of soil and vegetation cover. We aim to discern which are the main actors in order to formulate a new treatment that helps in the ecosystem recovery. Thus, we have found the relevant loss in phosphorous and potassium solubilizers, as well as siderophores or biofilm producers. Here, we decided to use the strains Pseudomonas koreensis AC, Peribacillus frigoritolerans CB, Pseudomonas fluorescens DC, Paenibacillus lautus C, Bacillus toyonensis CD, and Paenarthrobacter nitroguajacolicus AI as a consortium, as they showed most of the capacities required in a regenerative treatment. On the other hand, the microcosm test showed an enhanced pattern of germination of the emerging model plant, Bituminaria bituminosa, as well as a more aggregated structure for soil. This new approach can create a relevant approach in order to recover fire-affected soils in the future.

Keywords: emerging colonizers; fired soil; microbial communities; microbial nutrient cycling; vegetable coverture symbiosis.


Conflict of interest statement

The authors declare no conflict of interest.

Figures

Figure 1
Figure 1
Sampling locations. The map infography shows the locations selected for sampling (the numbers 1, 2 and 3 refer to the sampling locations as listed in Table 1). Location pins in green indicate samples of soil collected in areas not affected by fire; black pins indicate samples of soil collected in areas affected by fire. The map of the total area affected by the Los Guájares forest fire is a modification of the one issued by the COPERNICUS Emergency Management Service website (https://emergency.copernicus.eu/mapping/ems-product-component/EMSR632_AOI01_GRA_PRODUCT_r1_RTP01/1, accessed on 10 May 2023), where the maroon color indicates the places where the intensity of the fire was high; red, where the intensity was intermediate; and pink, where the intensity was low. All the samples were obtained from locations where the intensity of the fire was intermediate.
Figure 2
Figure 2
Proposed model and treatments for microcosms evaluation tests. The microcosms were prepared in 4 L volume in sandy soils (a) mixed with ashes in the case of the burnt evaluation model (b). In both conditions, relative humidity was maintained by regular water spraying, controlling the excess in case by using a draining system. Here, we established four treatments (c) for microcosms without (w/o) ashes and with ashes. Treatments included were (i) control soil, (ii) soil + synthetic bacterial community (SynCom), (iii) soil + Bituminaria bituminosa, and (iv) soil + SynCom + B. bituminosa.
Figure 3
Figure 3
Population analysis. The circular phylogenetic tree shows the proximity of the strains isolated in this study, indicated by branch length. The strains labelled in green were isolated from unburnt locations; the ones labeled in red, from burnt locations; and the ones labelled in grey, from the mix of ashes.
Figure 4
Figure 4
Distribution of culturable population in the different sampling locations. This infographic and pie charts show the distribution of the strains isolated in the three locations (1 for Cerro Lobera, 2 for Barranco del Girón, and 3 for Alto de la Hoya-Venta de la Cebada) for burnt ‘B’ (a) and their corresponding unburnt ‘UB’ areas (b). Here, the reddish-colored sectors represent the prevalence of Bacillus strains; the yellowish-colored ones, Peribacillus strains; the orangish-colored ones, Paenarthrobacter strains; the bluish-colored ones, Pseudomonas strains; the purplish-colored ones, Exiguobacterium strains; the goldish-colored ones, Priestia strains; and the greenish-colored ones gather Achromobacter, Paenibacillus and Flavobacterium strains.
Figure 5
Figure 5
Principal Component Analysis (PCA). The first two principal components from a Principal Component Analysis using rlog transformed expression values. Principal Component Analysis (PCA) of strains isolated in unburnt locations (green), in burnt locations (red), and in the mix of ashes (black). The first principal component (PC1, x-axis) explains 18.19% of the variation in the data while the second principal component (PC2, y-axis) increases total explained variation to 17.26%. A confidence ellipsis at 99% is drawn for each group. Each trait evaluated was represented with a red vector in the graph. ‘N’ corresponds to nitrogen fixation; ‘P’ to phosphorus solubilization; ‘K’ to potassium solubilization; ‘S’ to sulfur oxidizing; ‘Sid’ to siderophores production; ‘B’ to biofilm production; ‘IAA’ to auxin production; and ‘AOX’ to antioxidant production.
Figure 6
Figure 6
Evolution in microcosms. The line graphs show the evolution in the pH (a), the slaking index coefficient (SIC) (b), and the germination rate of Bituminaria bituminosa seeds (c) under each condition recorded in each microcosm (n = 3) during the 40 days of evaluation. Here, the circular-green markers stand for unburnt microcosms; the squared-green markers, for unburnt microcosms treated with the consortium; the circular-grey markers, for unburnt microcosms; the squared-grey markers, for unburnt microcosms treated with the consortium. The rhomboid-empty markers stand for in vitro germination rate recorded in parallel as control. The sets of data were compared using a two-ways ANOVA, where the letters indicate same significance level; alternatively, the asterisks represent a statistically significant difference at p < 0.001 ***, and p < 0.0001, ****; meanwhile, ns stands for groups with no statistical difference with respect to the in vitro control for germination. Error bars represent s.d.
Figure 7
Figure 7
Aggregation induction by treatments in microcosms. The microscope pictures show the aggregation patterns of the control and burnt-mimicking microcosms for mock (a,b), treated with plant (c,d), with the bacterial consortium (e,f), and with both (g,h). The scale bars represent 1 mm in the pictures, and the red arrows indicate some of the more representative aggregation patterns detected, although these measurements do not allow us to evaluate patterns for each condition and treatment. The stacked column chart represents the granulometry fractions in % (i) 40 days after the beginning of the microcosm experiment. Here, ‘M’ stands for mock microcosm; ‘Bb’ for microcosm with plants; ‘C’ for microcosm with consortium; and ‘Bb + C’ for microcosm with both treatments. For the granulometry, color box 1 stands for >1 mm fraction; 2 for 1–0.45 mm; 3 for 0.45–0.25 mm; 4 for 0.25–0.063 mm; and 5 for <0.063 mm fraction.
Figure 8
Figure 8
Determination of soluble nutrient content (N, P, K) in microcosms. The dot graph shows the amount (mg/Kg) of soluble nitrogen (N), phosphorus (P), and potassium (K) at the end of the experiment in each control and burnt-mimicking microcosm. The red dots stand for N; the green ones for P; and the blue ones for K. Here, ‘M’ stands for mock microcosm; ‘Bb’ for microcosm with plants; ‘C’ for microcosm with consortium; and ‘Bb + C’ for microcosm with both treatments. The sets of data were compared using a two-ways ANOVA. The asterisks represent a statistically significant difference at p < 0.01 **, p < 0.001 ***, and p < 0.0001, ****; meanwhile, ns stands for groups with no statistical difference with respect to each mock set as control. Error bars represent s.d.
Figure 9
Figure 9
Phenotype evaluation of Bituminaria bituminosa plants germinated in the microcosms. The bar graphs show the root length (a), shoot length (b), and full-plant dry weight (c) in the plants germinated (n = 30) under burnt-mimicking conditions (grey-colored bars) and control conditions (green-colored bars) in each microcosm (n = 3) during the 40 days of evaluation. The sets of data were compared using a two-ways ANOVA, where the asterisks represent a statistically significant difference at p < 0.05 *, p < 0.01 **, p < 0.001 ***, and p < 0.0001, ****; meanwhile, ns stands for groups with no statistical difference with respect to the control. Error bars represent s.d.

References

    1. NOAA State of the Climate: Global Climate Report for 2022; USA. [(accessed on 18 January 2023)]; Available online: https://www.ncei.noaa.gov/access/monitoring/monthly-report/global/202213.
    1. Van den Besselaar E.J.M., Klein Tank A.M.G., Buishand T.A. Trends in European precipitation extremes over 1951–2010. Int. J. Climatol. 2013;33:2682–2689. doi: 10.1002/joc.3619. - DOI
    1. EFFIS Annual Fire Report. [(accessed on 16 January 2023)]. Available online: https://effis.jrc.ec.europa.eu/
    1. MITECO Incendios Forestales. [(accessed on 16 January 2023)]. Available online: https://www.miteco.gob.es/es/biodiversidad/temas/incendios-forestales/es....
    1. Memoli V., Panico S.C., Santorufo L., Barile R., Di Natale G., Di Nunzio A., Toscanesi M., Trifuoggi M., De Marco A., Maisto G. Do Wildfires Cause Changes in Soil Quality in the Short Term? Int. J. Environ. Res. Public Health. 2020;17:5343. doi: 10.3390/ijerph17155343. - DOI - PMC - PubMed

LinkOut - more resources