. 2023 Aug 10;12(8):1116.
doi: 10.3390/biology12081116.

Guild Vertical Stratification and Drivers of Bat Foraging in a Semi-Arid Tropical Region, Kenya

Affiliations

Guild Vertical Stratification and Drivers of Bat Foraging in a Semi-Arid Tropical Region, Kenya

Ana Rainho et al. Biology (Basel). .

Abstract

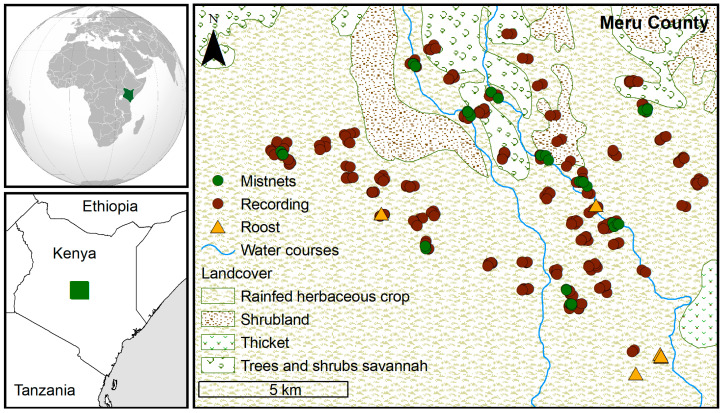
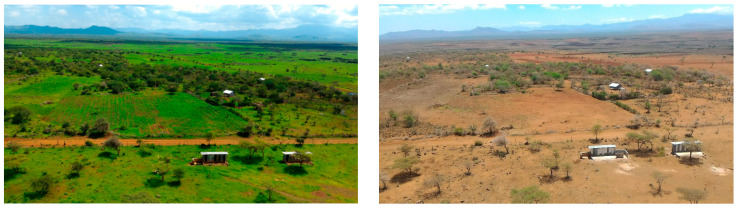
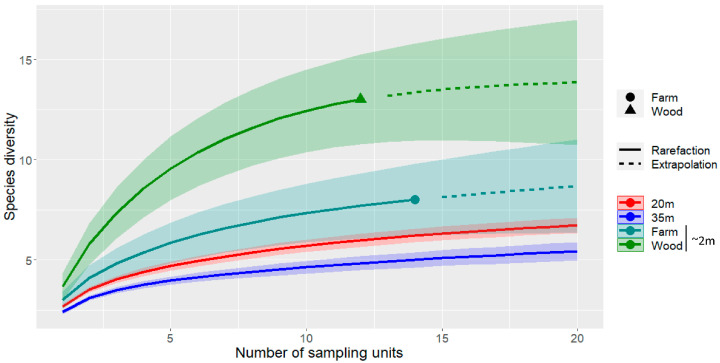
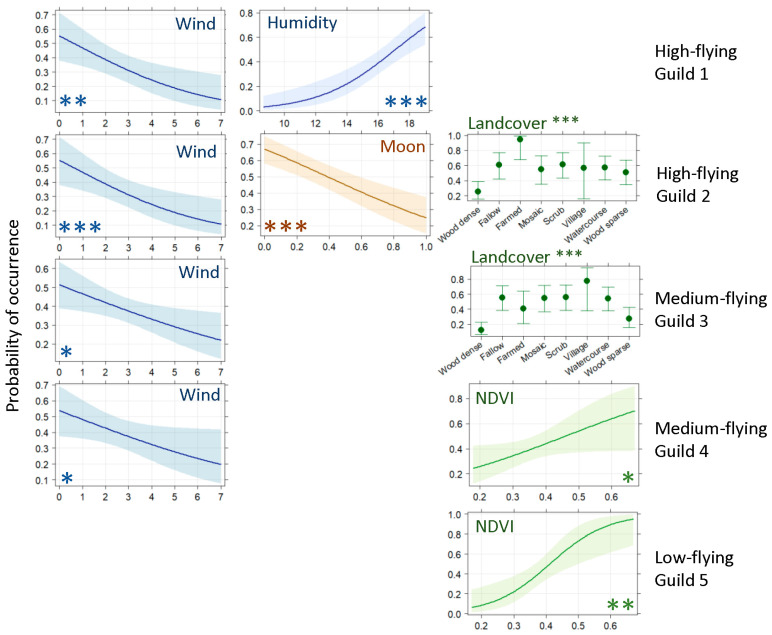
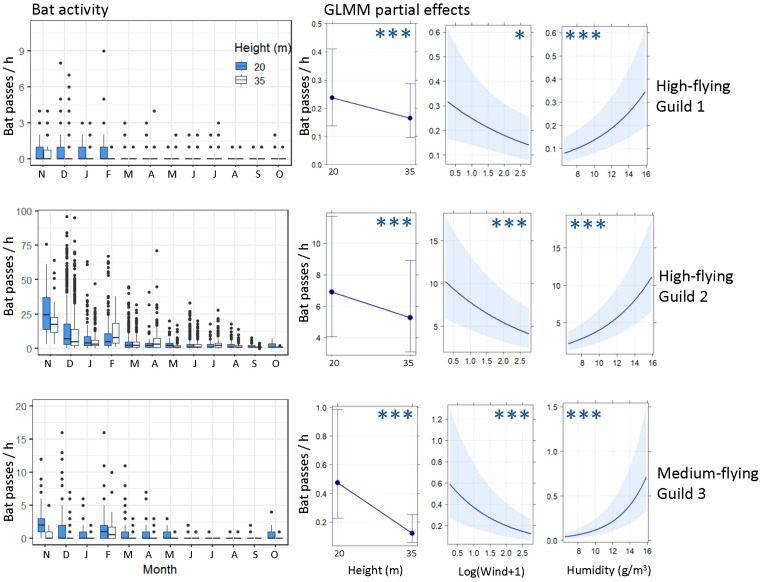
Africa faces significant challenges in reconciling economic and social development while preserving its natural resources. Little is known about the diverse bat community on the continent, particularly in drier ecosystems. A better understanding of the bat community will help improve and inform the management of these ecosystems. Our study aimed to provide detailed information on the main drivers of bat richness and activity at three different heights above the ground in a semi-arid region of Kenya. We assessed how bat activity varied with space and height using acoustic sampling and complementary methods. We sampled 48 sites at ground level and two sites on meteorological masts at 20 m and 35 m above the ground. We recorded more than 20 bat species, including one species of concern for conservation. Our models showed that the use of space varies with bat guild, creating trade-offs in the variables that affect their activity. Low-flying bat species are mostly associated with habitat variables, whereas high-flying species are more dependent on weather conditions. Our study highlights the richness of bat assemblages in semi-arid environments and emphasizes the need for management measures to protect bat diversity in the face of habitat degradation caused by climate change, land management, and development projects.

Keywords: Africa; bat conservation; drylands; landscape management; species richness.


Conflict of interest statement

The authors declare no conflict of interest.

Figures

Figure 1
Figure 1
Map showing the spatial arrangement of sampling sites. Inset shows the study area location in Kenya and Africa.
Figure 2
Figure 2
View of the study area in November 2016 (short rainy season, (left)) and September 2017 (end of the long dry season, (right)).
Figure 3
Figure 3
Sample-size-based (solid line) and extrapolation (dashed) sampling curves for species richness (q = 0) recorded using acoustic methods at three different heights (~2 m, 20 m, and 35 m), using two landcover types for ground sampling (~2 m): open farmlands (farm) and dense woodlands (wood). Shaded areas represent 95% confidence intervals.
Figure 4
Figure 4
Binomial GLM models’ partial effects for the occurrence of each bat guild recorded at the ground level. Order of environmental variables from left to right and top to bottom: wind (Beaufort scale, from 0—calm to 7 high wind), relative humidity (%), fraction of visible moon (between 0—new and 1- full moon), landcover, and NDVI (index ranging from −1—no green biomass to +1—full green biomass; see Table 1 and Table 2 for further details on guilds and variables). Error bars and shaded areas represent 95% confidence intervals. Asterisks represent the significance of the effect (*** <0.001; ** <0.01; * <0.05). See Table S3 for the complete models.
Figure 5
Figure 5
Bat activity at 20 and 35 m heights and its drivers throughout the year. The first column shows the monthly bat activity (bat passes/hour) of the three medium- and high-flying guilds at two heights from November 2016 to October 2017. The three columns on the right show each guild’s GLMM model partial effects of the main bat activity drivers: height (20 and 35 m), wind speed (m/s), and absolute humidity (g/m3), respectively. Error bars and shaded areas represent 95% confidence intervals. Asterisks represent the significance of the effect (*** <0.001; * <0.05). The activity of guild Medium_3 was also significantly and positively affected by temperature (not represented). All models include the site and season as random intercept values. See Table 1 and Table 2 for further details on guilds and variables and Table S4 for the complete models.

References

    1. Oakleaf J.R., Kennedy C.M., Baruch-Mordo S., West P.C., Gerber J.S., Jarvis L., Kiesecker J. A World at risk: Aggregating development trends to forecast global habitat conversion. PLoS ONE. 2015;10:e0138334. doi: 10.1371/journal.pone.0138334. - DOI - PMC - PubMed
    1. Tilman D., Clark M., Williams D.R., Kimmel K., Polasky S., Packer C. Future threats to biodiversity and pathways to their prevention. Nature. 2017;546:73–81. doi: 10.1038/nature22900. - DOI - PubMed
    1. Jellason N.P., Robinson E.J.Z., Chapman A.S.A., Neina D., Devenish A.J.M., Po J.Y.T., Adolph B. A Systematic review of drivers and constraints on agricultural expansion in Sub-Saharan Africa. Land. 2021;10:332. doi: 10.3390/land10030332. - DOI
    1. Gibbs H.K., Ruesch A.S., Achard F., Clayton M.K., Holmgren P., Ramankutty N., Foley J.A. Tropical forests were the primary sources of new agricultural land in the 1980s and 1990s. Proc. Natl. Acad. Sci. USA. 2010;107:16732–16737. doi: 10.1073/pnas.0910275107. - DOI - PMC - PubMed
    1. Weng L., Boedhihartono A.K., Dirks P.H.G.M., Dixon J., Lubis M.I., Sayer J.A. Mineral industries, growth corridors and agricultural development in Africa. Glob. Food Secur. 2013;2:195–202. doi: 10.1016/j.gfs.2013.07.003. - DOI

LinkOut - more resources