. 2023 Aug 11;15(16):4061.
doi: 10.3390/cancers15164061.

Mitochondrial Peptide Humanin Facilitates Chemoresistance in Glioblastoma Cells

Affiliations

Mitochondrial Peptide Humanin Facilitates Chemoresistance in Glioblastoma Cells

Jorge A Peña Agudelo et al. Cancers (Basel). .

Abstract

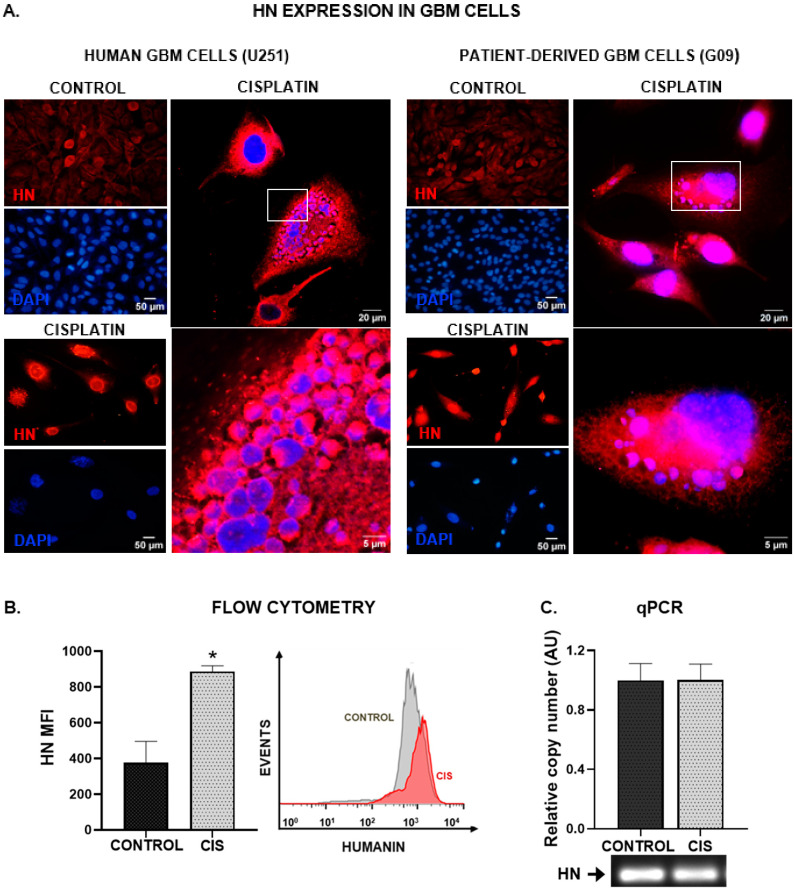
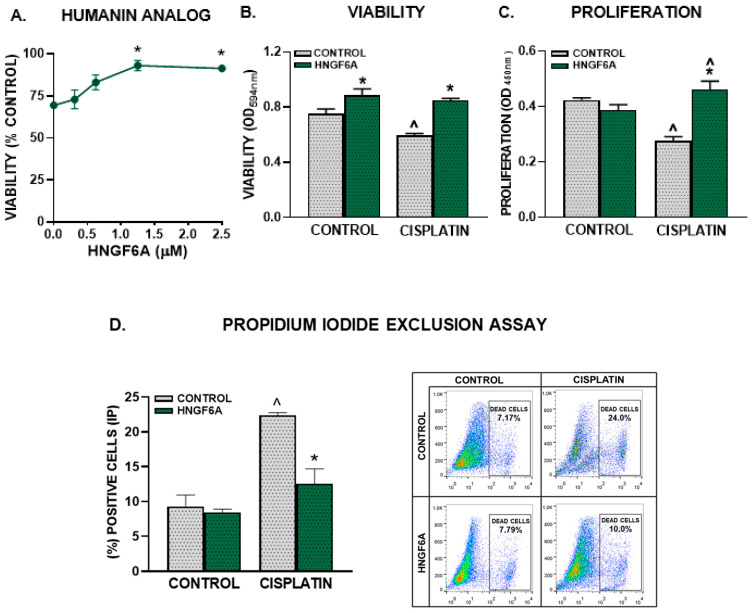
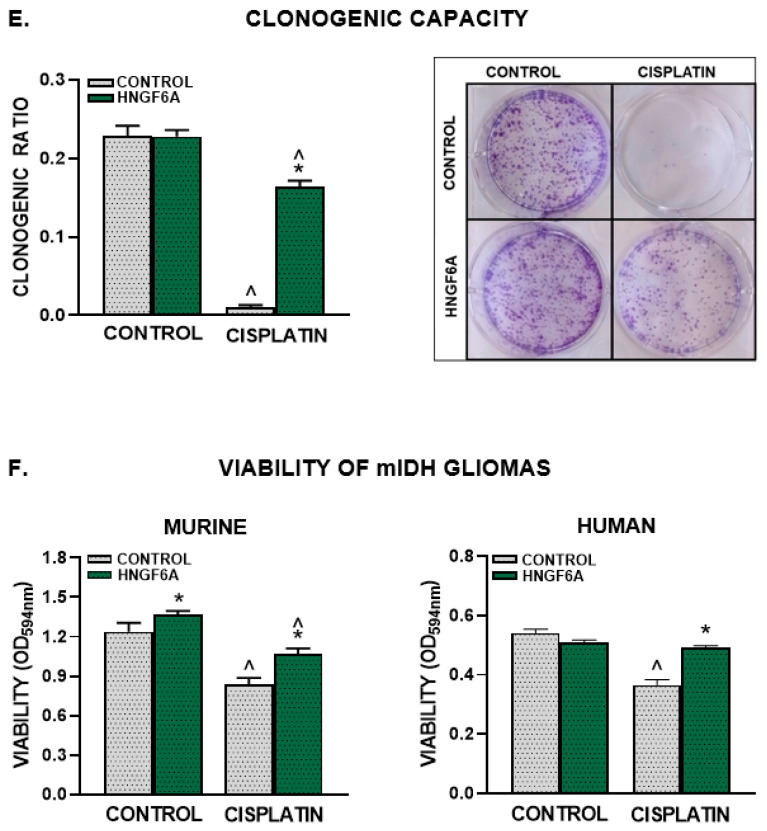
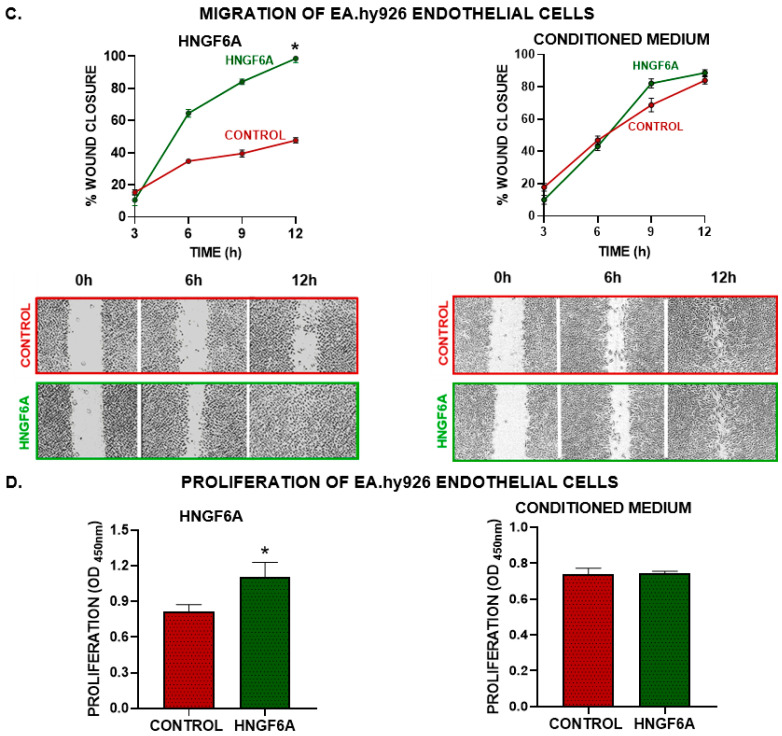
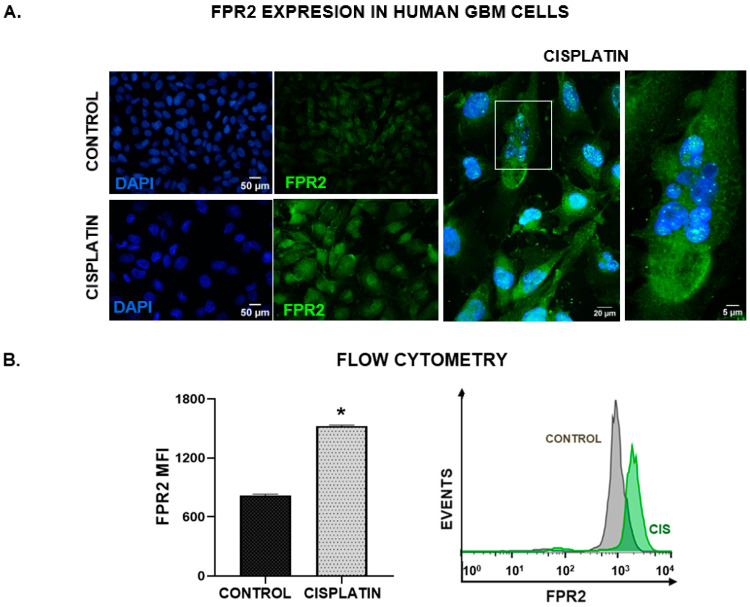
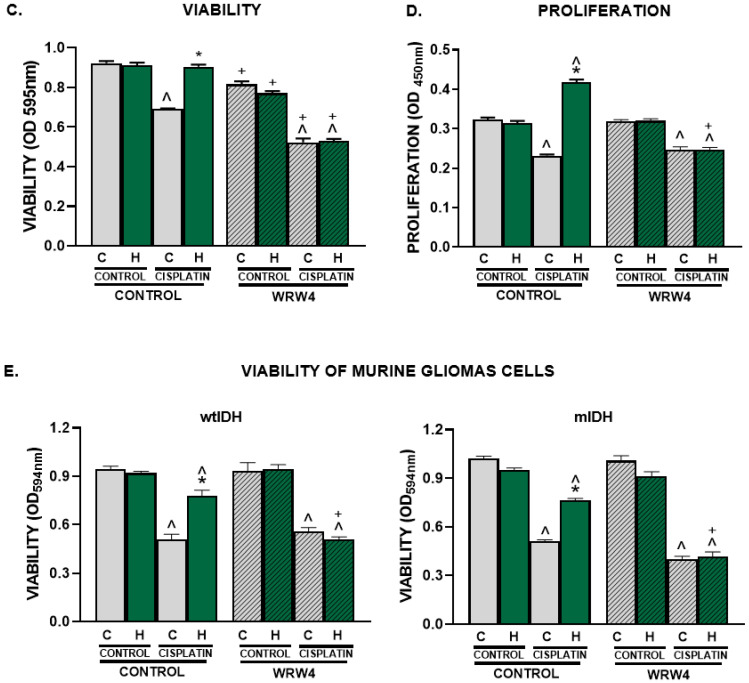
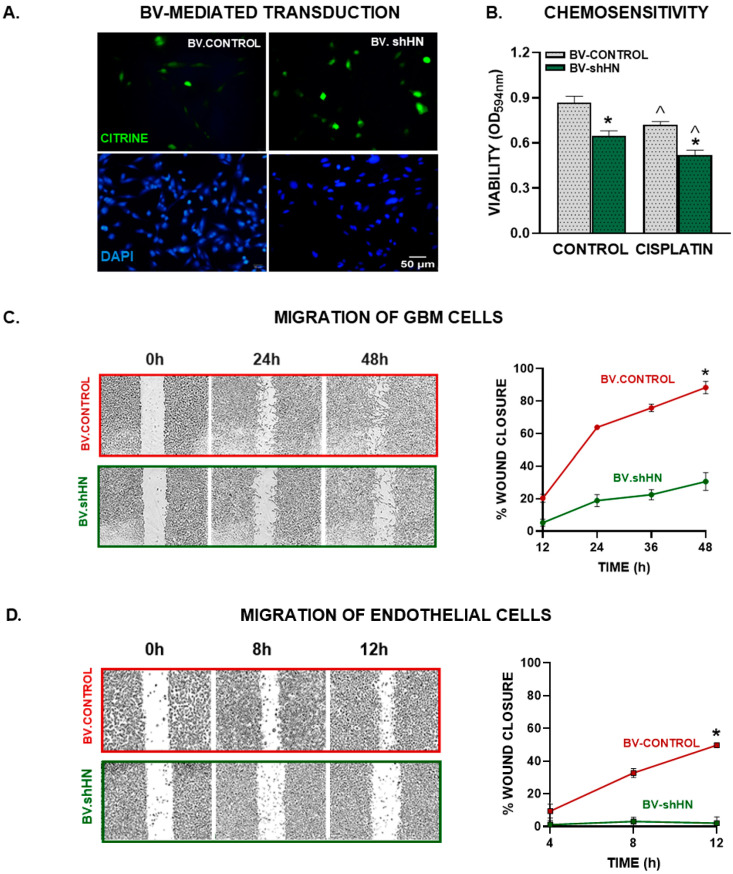
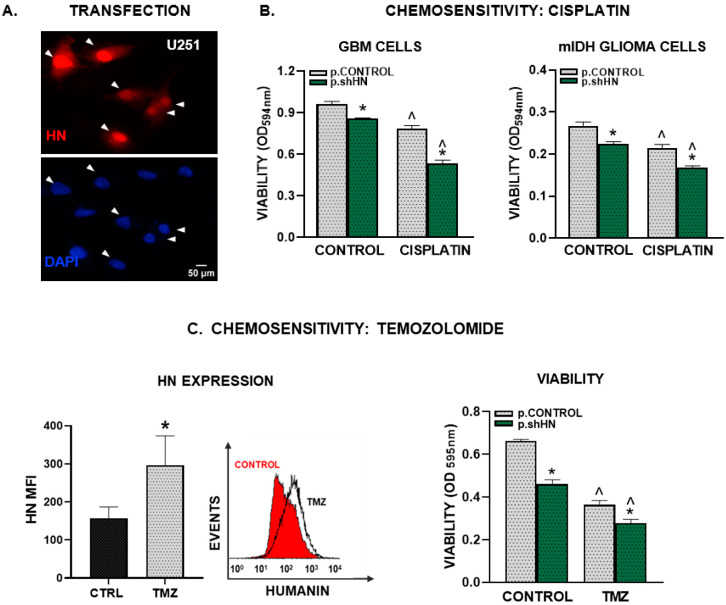
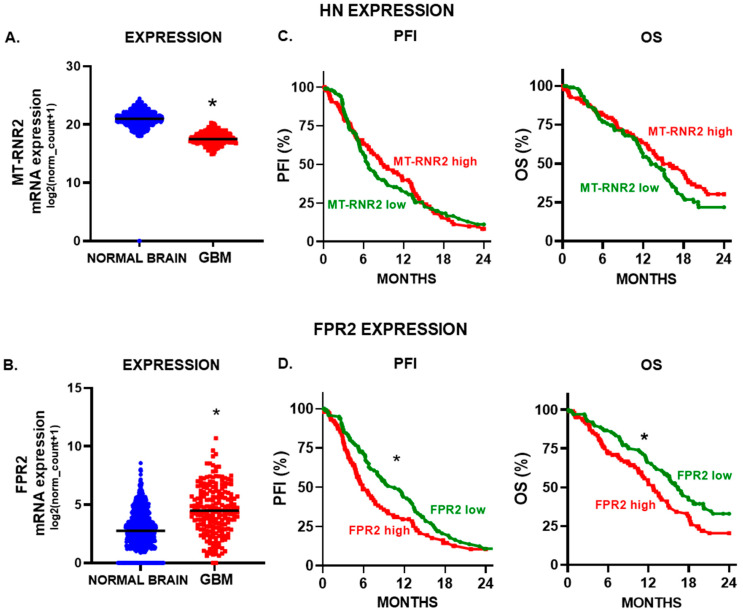
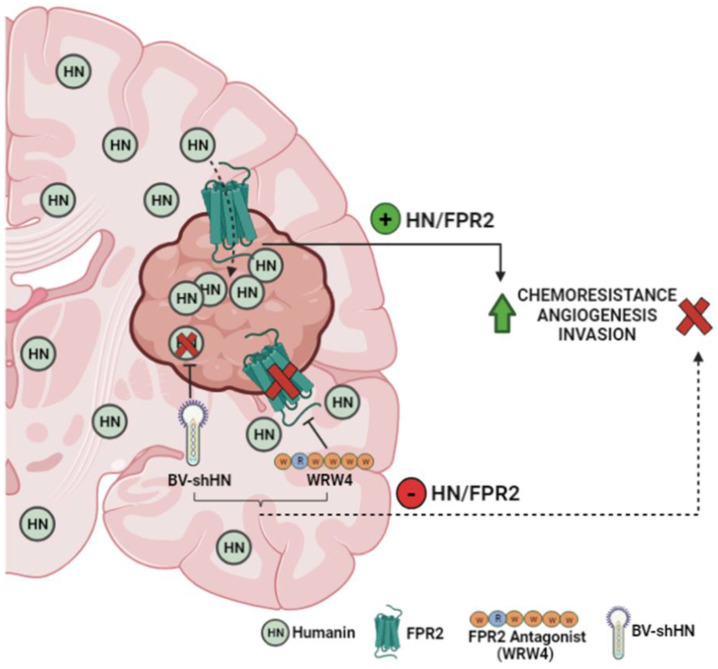
Humanin (HN) is a mitochondrial-derived peptide with robust cytoprotective effects in many cell types. Although the administration of HN analogs has been proposed to treat degenerative diseases, its role in the pathogenesis of cancer is poorly understood. Here, we evaluated whether HN affects the chemosensitivity of glioblastoma (GBM) cells. We found that chemotherapy upregulated HN expression in GBM cell lines and primary cultures derived from GBM biopsies. An HN analog (HNGF6A) boosted chemoresistance, increased the migration of GBM cells and improved their capacity to induce endothelial cell migration and proliferation. Chemotherapy also upregulated FPR2 expression, an HN membrane-bound receptor, and the HNGF6A cytoprotective effects were inhibited by an FPR2 receptor antagonist (WRW4). These effects were observed in glioma cells with heterogeneous genetic backgrounds, i.e., glioma cells with wild-type (wtIDH) and mutated (mIDH) isocitrate dehydrogenase. HN silencing using a baculoviral vector that encodes for a specific shRNA for HN (BV.shHN) reduced chemoresistance, and impaired the migration and proangiogenic capacity of GBM cells. Taken together, our findings suggest that HN boosts the hallmark characteristics of GBM, i.e., chemoresistance, migration and endothelial cell proliferation. Thus, strategies that inhibit the HN/FPR2 pathway may improve the response of GBM to standard therapy.

Keywords: FPR2; chemotherapy; glioblastoma; humanin.


Conflict of interest statement

The authors declare no conflict of interest.

Figures

Figure 1
Figure 1
Chemotherapy upregulates HN in human GBM cells. Human U251-MG GBM cells and patient-derived GBM cell cultures (G09) were incubated with 5 µM cisplatin for 48 h. HN expression was assessed by immunofluorescence (A), flow cytometry (B) and qPCR (C). (A) Images show cells immunostained with HN antibody (red), and DAPI-stained nuclei (blue). Representative magnified images of cisplatin-treated human GBM cells were obtained by confocal microscopy. The white box indicates the area magnified in the bottom panel. (B) Mean fluorescence intensity (MFI) of HN staining in human U251-MG GBM cells (n = three replicates/condition). A representative histogram is depicted. * p < 0.05, Student’s t test. (C) Expression of HN mRNA as assessed by qPCR. A representative gel of qPCR products is shown.
Figure 2
Figure 2
HN analogue facilitates chemoresistance in human GBM cells. (AE) U251-MG cells were incubated with different concentrations (A) or 1.25 μM HNGF6A (BE) for 2 h before cisplatin (2 μM) was added for additional 72 h (n = six replicates/condition). Viability was assessed by the MTT assay (A,B), proliferation was evaluated by BrdU incorporation (ELISA) (C) and cell death was determined by the propidium iodide exclusion method (D). Representative dot plots are shown for each condition. (E) Clonogenic capacity was evaluated 10 days after seeding the cells that were alive after cisplatin treatment (n = three replicates/condition). The panels on the right show representative images of the colonies formed in each experimental condition at the end of the clonogenic assay. (F) mIDH glioma neurospheres derived from genetically engineered mouse tumors and patient-derived biopsies cells (G01) were incubated with HNGF6A (1.25 μM) for 2 h before adding cisplatin (5 μM) for 72 h. Viability was measured by MTT assay. * p < 0.05 vs. respective controls without HNGF6A; ^ p < 0.05 vs. respective control without cisplatin, ANOVA followed by Tukey’s test.
Figure 2
Figure 2
HN analogue facilitates chemoresistance in human GBM cells. (AE) U251-MG cells were incubated with different concentrations (A) or 1.25 μM HNGF6A (BE) for 2 h before cisplatin (2 μM) was added for additional 72 h (n = six replicates/condition). Viability was assessed by the MTT assay (A,B), proliferation was evaluated by BrdU incorporation (ELISA) (C) and cell death was determined by the propidium iodide exclusion method (D). Representative dot plots are shown for each condition. (E) Clonogenic capacity was evaluated 10 days after seeding the cells that were alive after cisplatin treatment (n = three replicates/condition). The panels on the right show representative images of the colonies formed in each experimental condition at the end of the clonogenic assay. (F) mIDH glioma neurospheres derived from genetically engineered mouse tumors and patient-derived biopsies cells (G01) were incubated with HNGF6A (1.25 μM) for 2 h before adding cisplatin (5 μM) for 72 h. Viability was measured by MTT assay. * p < 0.05 vs. respective controls without HNGF6A; ^ p < 0.05 vs. respective control without cisplatin, ANOVA followed by Tukey’s test.
Figure 3
Figure 3
Effect of HNGF6A on GBM cell migration and angiogenic capacity. (A) GBM U251-MG cells were seeded to confluence and incubated with HNGF6A (1.25 μM, left panels) or with conditioned media from HNGF6A-treated cells (right panels). The monolayer was scratched and the cell-free area was measured at different time points. * p < 0.05 (nonlinear regression analysis). Representative images of the scratch areas are shown. (B) SDS-PAGE gelatin zymography of conditioned media from human GBM U251-MG cells incubated in the presence of HNGF6A (1.25 μM) for 48 h. The bands were analyzed by densitometry with the ImageJ software (Version: 1.53k) and the zymographic activity was expressed as a percentage in relation to a standard internal sample that is saturated at a density of 50%. * p  <  0.05 Student’s t-test (C) EA.hy926 endothelial cells were seeded to confluence and incubated directly with HNGF6A (1.25 µM) or using conditioned media from HNGF6A-treated U251-MG cells. A scratch test was performed and the cell-free area was measured at different time points. * p < 0.05 (nonlinear regression analysis). (D) EA.hy926 endothelial cells were incubated with HNGF6A (1.25 µM) or with conditioned media from HNGF6A-treated U251-MG cells for 48 h and proliferation was determined by BrdU incorporation (ELISA) * p < 0.05 Student’s t-test.
Figure 3
Figure 3
Effect of HNGF6A on GBM cell migration and angiogenic capacity. (A) GBM U251-MG cells were seeded to confluence and incubated with HNGF6A (1.25 μM, left panels) or with conditioned media from HNGF6A-treated cells (right panels). The monolayer was scratched and the cell-free area was measured at different time points. * p < 0.05 (nonlinear regression analysis). Representative images of the scratch areas are shown. (B) SDS-PAGE gelatin zymography of conditioned media from human GBM U251-MG cells incubated in the presence of HNGF6A (1.25 μM) for 48 h. The bands were analyzed by densitometry with the ImageJ software (Version: 1.53k) and the zymographic activity was expressed as a percentage in relation to a standard internal sample that is saturated at a density of 50%. * p  <  0.05 Student’s t-test (C) EA.hy926 endothelial cells were seeded to confluence and incubated directly with HNGF6A (1.25 µM) or using conditioned media from HNGF6A-treated U251-MG cells. A scratch test was performed and the cell-free area was measured at different time points. * p < 0.05 (nonlinear regression analysis). (D) EA.hy926 endothelial cells were incubated with HNGF6A (1.25 µM) or with conditioned media from HNGF6A-treated U251-MG cells for 48 h and proliferation was determined by BrdU incorporation (ELISA) * p < 0.05 Student’s t-test.
Figure 4
Figure 4
FPR2 mediates the cytoprotective effect of HN in GBM cells. Human GBM U251-MG cells were incubated with 2 µM cisplatin for 48 h. FPR2 expression was assessed by immunofluorescence (A) and flow cytometry (B). (A) Images show FPR2 immunostaining (green), and DAPI-stained nuclei (blue). A representative magnified image of cisplatin-treated cells using confocal microscopy is shown. The white box indicates the area magnified in the right panel (B) Mean fluorescence intensity (MFI) of FPR2 in human U251-MG GBM cells (n = three replicates/condition). * p < 0.05 Student’s t test. (CE) U251-MG GBM cells as well as wtIDH and mIDH murine neurospheres were incubated with 10 µM WRW4 (FPR2 antagonist), in the presence of HNGF6A and cisplatin for 72 h. (n = six replicates/condition). Viability was determined by MTT assay (C,E) and proliferation was assessed by BrdU incorporation (ELISA, (D)). * p < 0.05 vs. respective control without HNGF6A; ^ p < 0.05 vs. respective control without cisplatin. + p < 0.05 vs. respective control without WRW4. ANOVA followed by Tukey’s test. (C: Control, H: HNGF6A).
Figure 4
Figure 4
FPR2 mediates the cytoprotective effect of HN in GBM cells. Human GBM U251-MG cells were incubated with 2 µM cisplatin for 48 h. FPR2 expression was assessed by immunofluorescence (A) and flow cytometry (B). (A) Images show FPR2 immunostaining (green), and DAPI-stained nuclei (blue). A representative magnified image of cisplatin-treated cells using confocal microscopy is shown. The white box indicates the area magnified in the right panel (B) Mean fluorescence intensity (MFI) of FPR2 in human U251-MG GBM cells (n = three replicates/condition). * p < 0.05 Student’s t test. (CE) U251-MG GBM cells as well as wtIDH and mIDH murine neurospheres were incubated with 10 µM WRW4 (FPR2 antagonist), in the presence of HNGF6A and cisplatin for 72 h. (n = six replicates/condition). Viability was determined by MTT assay (C,E) and proliferation was assessed by BrdU incorporation (ELISA, (D)). * p < 0.05 vs. respective control without HNGF6A; ^ p < 0.05 vs. respective control without cisplatin. + p < 0.05 vs. respective control without WRW4. ANOVA followed by Tukey’s test. (C: Control, H: HNGF6A).
Figure 5
Figure 5
BV-mediated silencing of HN in GBM cells. Murine GBM cells (GL26) were transduced with BV.Control or BV.shHN (750 pfu/cell) for 48 h. (A) Expression of the reporter gene (green) was assessed using fluorescent microscopy. (B) Transduced cells were incubated with cisplatin (5 μM) for 72 h and viability was assessed by MTT assay. * p < 0.05 vs. respective BV.Control, ^ p < 0.05 vs. respective control without cisplatin. ANOVA followed by Tukey’s test. (C) Murine GBM cells (GL26) were seeded until reaching confluence, transduced with BV.shHN or BV.Control (750 pfu/cells) and migration was evaluated at different time points using the wound assay. * p < 0.05 vs. BV.Control (nonlinear regression analysis). (D) EA.hy926 endothelial cells were seeded to confluence and incubated with conditioned medium from GBM cells transduced with BV-shHN. A wound assay was performed and the cell-free area was measured at different time points. * p < 0.05 vs. BV.Control (nonlinear regression analysis).
Figure 6
Figure 6
Silencing of HN and chemosensitivity in human GBM cells. Human U251-MG GBM cells as well as cells derived from mIDH glioma biopsies (G01) were transfected with a plasmid encoding an shRNA for human HN and the red fluorescent protein dtTomato, or a control plasmid not expressing the silencing sequence. (A) Representative images show reporter-gene-positive cells (red) and nuclei stained with DAPI (blue). Arrows indicate transfected cells. (B,C) Transfected cells were incubated with 2 μM cisplatin (B) or with 15 μM temozolomide, TMZ (C) for 72 h and viability was assessed by the MTT assay. * p < 0.05 vs. respective control plasmid (p.control), ^ p < 0.05 vs. respective control without cisplatin or TMZ. ANOVA followed by Tukey’s test. HN expression was assessed by flow cytometry in human U251-MG GBM cells that were incubated with 15 µM temozolomide for 48 h. Images show mean fluorescence intensity (MFI) (n = three replicates/condition). A representative histogram is depicted. * p < 0.05 Student’s t test (C).
Figure 7
Figure 7
HN and FPR2 expression and prognosis of GBM patients. The mRNA expression of humanin (A) (MT-RNR2) and (B) FPR2 was evaluated using transcriptomic data of normal brain tissue (GTEx, n = 1141) and GBM biopsies (TCGA Pan-Cancer database, n = 207). *, p < 0.05; Mann-Whitney U test. Kaplan–Meier curves were created using UCSC Xena database and TCGA LGG-GBM cohorts. Progression-free-interval (PFI) and overall survival (OS) curves of GBM patients that were stratified according to (C) HN (MT-RNR2) and (D) FPR2 mRNA expression levels using the median of expression as a cut-off point. * p < 0.05, Log rank (Mantel–Cox) test.
Figure 8
Figure 8
HN and FPR2 as therapeutic targets in GBM. HN, originated in brain and the tumor, can interact with the FPR2 receptor present in GBM cells, facilitating chemoresistance, angiogenesis and invasion. Transcriptional blockade of HN using BV.shHN or inhibition of FPR2 with WRW4 antagonist improves the chemosensitivity of GBM cells. Thus, the HN/FPR2 pathway could constitute a therapeutic target to improve GBM response to standard therapy, suppressing chemoresistance and reducing the invasive and angiogenic capacity of the tumor.

References

    1. Vigneswaran K., Neill S., Hadjipanayis C.G. Beyond the World Health Organization grading of infiltrating gliomas: Advances in the molecular genetics of glioma classification. Ann. Transl. Med. 2015;3:95. doi: 10.3978/j.issn.2305-5839.2015.03.57. - DOI - PMC - PubMed
    1. Chinot O.L., Barrie M., Fuentes S., Eudes N., Lancelot S., Metellus P., Muracciole X., Braguer D., Ouafik L., Martin P.M., et al. Correlation between O6-methylguanine-DNA methyltransferase and survival in inoperable newly diagnosed glioblastoma patients treated with neoadjuvant temozolomide. J. Clin. Oncol. 2007;25:1470–1475. doi: 10.1200/JCO.2006.07.4807. - DOI - PubMed
    1. Ou A., Yung W.K.A., Majd N. Molecular Mechanisms of Treatment Resistance in Glioblastoma. Int. J. Mol. Sci. 2020;22:351. doi: 10.3390/ijms22010351. - DOI - PMC - PubMed
    1. Guo B., Zhai D., Cabezas E., Welsh K., Nouraini S., Satterthwait A.C., Reed J.C. Humanin peptide suppresses apoptosis by interfering with Bax activation. Nature. 2003;423:456–461. doi: 10.1038/nature01627. - DOI - PubMed
    1. Cai H., Liu Y., Men H., Zheng Y. Protective Mechanism of Humanin Against Oxidative Stress in Aging-Related Cardiovascular Diseases. Front. Endocrinol. 2021;12:683151. doi: 10.3389/fendo.2021.683151. - DOI - PMC - PubMed

LinkOut - more resources